

Thrombospondin-1 induces immunogenic cell death in human mucoepidermoid carcinoma MC-3 cells via the PERK/eIF2α signaling pathway: potential implications for tumor immunotherapy
- PMID: 40253314
- PMCID: PMC12009254
- DOI: 10.1007/s12672-025-02315-7
Thrombospondin-1 induces immunogenic cell death in human mucoepidermoid carcinoma MC-3 cells via the PERK/eIF2α signaling pathway: potential implications for tumor immunotherapy
Abstract
Objective: To investigate whether Thrombospondin-1 (TSP-1) induces immunogenic cell death (ICD) in human mucoepidermoid carcinoma (MC-3) cells and explore its potential to induce calreticulin (CRT) exposure via the PERK/eIF2α signaling pathway.
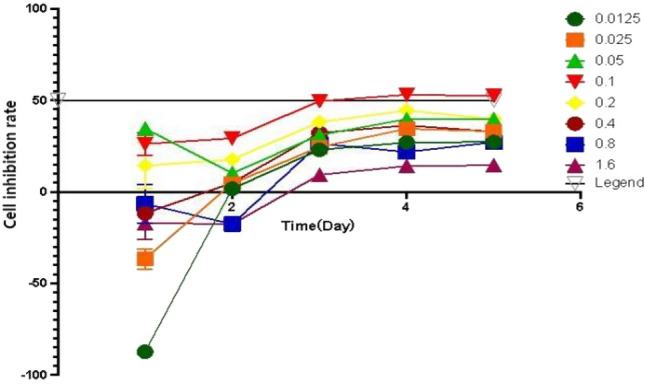
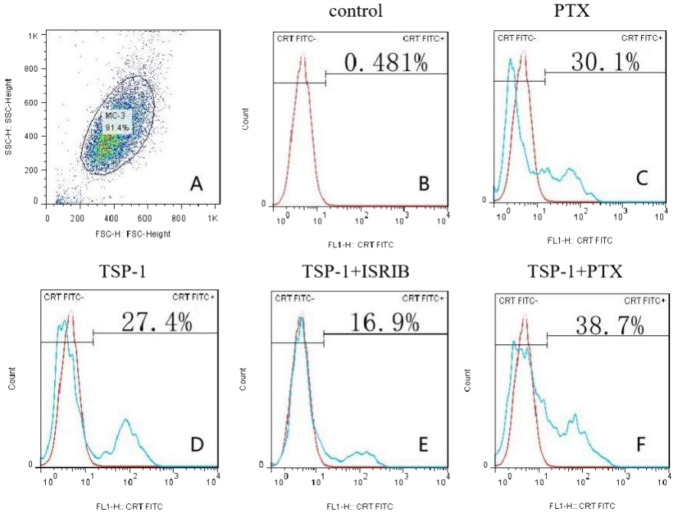
Methods: The MC-3 cell line was used as the research model. The CCK-8 assay was performed to determine the optimal seeding density, TSP-1 concentration, and treatment time. Annexin V/PI double staining combined with flow cytometry was used to assess apoptosis across different experimental groups (blank control, TSP-1, paclitaxel (PTX), TSP-1 + PTX). Cells were divided into groups: blank control, PTX, TSP-1, TSP-1 + ISRIB (ISRIB: Integrated Stress Response Inhibitor), and TSP-1 + PTX, and CRT expression was detected by flow cytometry. Immunofluorescence, Western blot, and qPCR were used to detect the expression of PERK (Protein Kinase R-like Endoplasmic Reticulum Kinase), eIF2α (eukaryotic Initiation Factor 2α), and CRT. All experiments were performed in triplicate, and data were analyzed using GraphPad Prism 8.0 software. Statistical significance was set at P < 0.05.
Results: At a seeding density of 2 × 10⁴/mL, MC-3 cells reached the growth plateau by day six. The optimal concentration and duration of TSP-1 treatment were 0.1 μmol/L and 72 h, respectively. Flow cytometry, immunofluorescence, Western blot, and qPCR results revealed that TSP-1 significantly induced CRT exposure in MC-3 cells (P < 0.05), accompanied by the upregulation of PERK and eIF2α expression (P < 0.05). Co-treatment with PTX further enhanced these effects, while the addition of ISRIB reduced the expression of PERK, eIF2α, and CRT (P < 0.05).
Conclusion: TSP-1 induces ICD in MC-3 cells, accompanied by CRT exposure, potentially mediated through the activation of the PERK/eIF2α signaling pathway. These findings suggest that TSP-1 may have potential as an adjunct to chemotherapy for enhancing tumor immunotherapy.
Keywords: Calreticulin; Immunogenic death; MC-3 cell line; PERK/eIF2α signaling pathway; Thrombospondin-1; Tumor immunotherapy.
© 2025. The Author(s).
Conflict of interest statement
Declarations. Competing interests: The authors declare no competing interests. Ethical approval: Not applicable. Consent to participate: Not applicable. Consent for publication: Not applicable.
Figures


Similar articles
-
Effects of anlotinib hydrochloride on the expression of immunogenic cell death-related molecules in Cal27 tongue cancer cells.Discov Oncol. 2025 Apr 29;16(1):639. doi: 10.1007/s12672-025-02464-9. Discov Oncol. 2025. PMID: 40299226 Free PMC article.
-
Endoplasmic reticulum stress-mediated membrane expression of CRT/ERp57 induces immunogenic apoptosis in drug-resistant endometrial cancer cells.Oncotarget. 2017 May 8;8(35):58754-58764. doi: 10.18632/oncotarget.17678. eCollection 2017 Aug 29. Oncotarget. 2017. PMID: 28938593 Free PMC article.
-
[Co-exposure of carbon black and cadmium induces autophagy and inflammation in human bronchial epithelial cells via PERK pathway].Zhonghua Lao Dong Wei Sheng Zhi Ye Bing Za Zhi. 2024 Jan 20;42(1):1-9. doi: 10.3760/cma.j.cn121094-20221221-00601. Zhonghua Lao Dong Wei Sheng Zhi Ye Bing Za Zhi. 2024. PMID: 38311942 Chinese.
-
Salubrinal Regulates the Apoptosis of Adrenocortical Carcinoma Cells via the PERK/eIF2α/ATF4 Signaling Pathway.Int J Endocrinol. 2021 Sep 7;2021:5038130. doi: 10.1155/2021/5038130. eCollection 2021. Int J Endocrinol. 2021. PMID: 34567111 Free PMC article.
-
eIF2α phosphorylation as a biomarker of immunogenic cell death.Semin Cancer Biol. 2015 Aug;33:86-92. doi: 10.1016/j.semcancer.2015.02.004. Epub 2015 Mar 6. Semin Cancer Biol. 2015. PMID: 25749194 Review.
References
-
- Sakamoto S, Kikuchi K. Expanding the cytological and architectural spectrum of mucoepidermoid carcinoma: the key to solving diagnostic problems in morphological variants. Semin Diagn Pathol. 2024;41(4):182–9. - PubMed
-
- Tirado Y, et al. Detection of CSF1 rearrangements deleting the 3′ UTR in tenosynovial giant cell tumors. Genes Chromosomes Cancer. 2020;59(12):693–701. - PubMed
-
- Stenman G, et al. Tumors of the intraoral minor salivary glands: a demographic and histologic study of 426 cases. J Oral Pathol Med. 2020;49(3):201–7. - PubMed
LinkOut - more resources
Full Text Sources
Research Materials
Miscellaneous