. 2025 Apr 19;16(1):3730.
doi: 10.1038/s41467-025-59096-4.

SNAP25-dependent membrane trafficking of the Kv1.5 channel regulates the onset of atrial fibrillation

Affiliations

SNAP25-dependent membrane trafficking of the Kv1.5 channel regulates the onset of atrial fibrillation

Xuling Su et al. Nat Commun. .

Abstract

Synaptosomal-associated protein 25 kDa (SNAP25) is essential for vesicular trafficking and protein docking at presynaptic membranes in the nervous system, yet its role in the heart remains poorly understood. Here, we show an unrecognized function of SNAP25, which is selectively expressed in the atria, in regulating atrial electrical remodeling and the onset of atrial fibrillation (AF). SNAP25 protein is downregulated in the atria of AF patients. Cardiomyocyte-specific knockout of SNAP25 in male mice significantly shortens the atrial effective refractory period and action potential duration (APD), increasing susceptibility to AF, which is attributed to elevated Kv1.5 current and membrane expression. Blocking Kv1.5 channels effectively restores atrial APD and reduces AF incidence. Mechanistically, SNAP25 deficiency reduces the internalization of Kv1.5 from the cell surface membrane to early endosomes. In human iPSC-derived atrial cardiomyocytes, SNAP25 deficiency similarly elevates arrhythmic activity and accelerates repolarization. In conclusion, this study reveals that SNAP25 regulates AF susceptibility by controlling the trafficking of the atrial-specific Kv1.5 channel, highlighting SNAP25 as a promising therapeutic target for atrial arrhythmias.


Conflict of interest statement

Competing interests: The authors declare no competing interests.

Figures
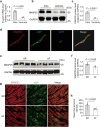
Fig. 1
Fig. 1. SNAP25 is preferentially expressed in the atria and down-regulated in the atria of AF.
a The mRNA expression of Snap25 in the atrium and ventricle of mice was detected by qPCR and its quantitative analysis, normalized to Gapdh levels (n = 4 samples per group) (P = 2.34e-5). The protein expression of SNAP25 in the atria and ventricles of mice was detected by western blot (b) and its quantitative analysis, normalized to GAPDH levels (c) (n = 4 samples per group) (P = 7.85e-5). d Immunofluorescence (IF) for detecting the subcellular localization of SNAP25 in mouse atrial cardiomyocytes (n = 3 samples per group, scale bar = 10 μm). SNAP25 (red), ANP (green), and DAPI (blue). The protein expression of SNAP25 in atria of the SR and AF patients was detected by western blot (e) and its quantitative analysis, normalized to GAPDH levels (f). The samples were taken from left atria (n = 5 samples per group). IF for detecting the localization and expression of SNAP25 in human atrial tissues (g) and quantitative analysis of mean fluorescence intensity (h) (n = 7 samples per group, scale bar = 50 μm). SNAP25 (red), ANP (green), and DAPI (blue). SR sinus rhythm, AF atrial fibrillation. Data are presented as mean ± SEM (a, c, f, and h). P values were calculated using two-tailed Student’s t-test. Source data are provided as a Source Data file.
Fig. 2
Fig. 2. Cardiomyocyte-specific knockout of SNAP25 increases AF susceptibility.
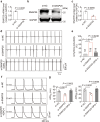
a Schematic diagram of SNAP25 cKO transgene mice construct. b The mRNA level of atrial Snap25 in WT and SNAP25 cKO mice were detected by qPCR, and its quantitative analysis, normalized to Gapdh levels (n = 4 samples per group). The protein level of atrial SNAP25 in WT and SNAP25 cKO mice were detected by western blot (c), and the quantification of SNAP25 protein level (d) (n = 5 samples per group) (P = 5.82e-5). Immunofluorescent localization of SNAP25 in ANP-expressing atrial cardiomyocytes from WT and cKO mice (e), and pooled data for the mean fluorescence intensity across the cells (f) (n = 5 samples per group). SNAP25 (red), ANP (green), and DAPI (blue), scale bar = 10 μm. g Quantification of atrial ERP in WT and SNAP25 cKO groups (n = 5 samples per group). Representative simultaneous recordings of lead-2 surface ECGs and intracardiac ECGs in WT and SNAP25 cKO mice (h), and the bar graph shows the increased incidence of AF inducibility in SNAP25 cKO versus WT mice (i) (n = 11 samples per group). j The quantification of AF duration in WT and cKO mice (n = 11 samples per group). WT wild-type, cKO SNAP25 conditional knockout, ECGs electrocardiograms, AF atrial fibrillation, ERP effective refractory period. Data are presented as median with interquartile ranges (IQR) (b, j) or mean ± SEM (d-g, i). P values were calculated using Mann-Whitney test (b, j), two-tailed Student’s t-test (d-g), or Chi-square test (i). Source data are provided as a Source Data file.
Fig. 3
Fig. 3. Cardiomyocyte-specific knockout of SNAP25 contributes to the shortening of atrial APD.
a Typical optical APD50 maps and AP signal records in perfused hearts. b Statistical and quantitative analysis of APD50 in WT and SNAP25 cKO mice (n = 5 samples per group). c Representative AP traces of single atrial cardiomyocyte from WT and SNAP25 cKO mice. d Statistical and quantitative analysis of APD50 (P = 2.72e-7) and APD90 (P = 1.41e-6) in atrial cardiomyocytes from WT and SNAP25 cKO mice (n = 6 samples per group). APD, action potential duration; APD50, APD at 50% repolarization; APD90, APD at 90% repolarization. Data are presented as mean ± SEM. P values were calculated using two-tailed Student’s t-test. Source data are provided as a Source Data file.
Fig. 4
Fig. 4. Shortening of atrial APD results from the upregulation of Kv1.5 current in SNAP25 cKO mice.
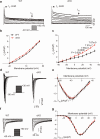
a Peak Ito and IKur current traces of atrial cardiomyocytes from WT and SNAP25 cKO groups. Cells were depolarized from −40 mV to +50 mV in 10 mV steps. Inset shows voltage protocol. b, c Peak current amplitudes normalized to cell capacitance, and current-voltage curves for peak Ito (b) and IKur (c) (n = 3 samples per group). Representative traces of voltage-dependent changes of late INa in single atrial cardiomyocyte from WT and SNAP25 cKO mice (d), and summarized current-voltage relationship for late INa (e). Cells were depolarized from −90 mV to +30 mV in 5 mV steps. Insert shows schematic voltage-clamp protocol (n = 3 samples per group). Representative ICa, L traces from WT and SNAP25 cKO mice (f), and summarized current-voltage relationship for ICa, L densities (g). Cells were depolarized from −60 mV to +60 mV in 5 mV steps. Insert shows schematic voltage-clamp protocol (n = 3 samples per group). IKur, ultrarapid delayed rectifier potassium current; Ito, transient-outward K+ current; INa, Na+ current; ICa, L, L-type Ca2+ current. Data are presented as mean ± SEM (b, c, e, and g). P values were calculated using two-way ANOVA. Source data are provided as a Source Data file.
Fig. 5
Fig. 5. The selective Kv1.5 blocker, DPO-1, rescues the shortening of atrial APD and the occurrence of AF in SNAP25 cKO mice.
a Typical optical APD50 maps and AP signal records in perfused hearts from WT and SNAP25 cKO mice treated with DPO-1 (1 µM). b Statistical and quantitative analysis of APD50 (n = 5 samples per group). c Representative AP traces of single atrial cardiomyocyte from WT and SNAP25 cKO mice treated with DPO-1. d Statistical and quantitative analysis of APD50 and APD90 (n = 5 samples per group). Representative simultaneous recordings of lead-2 surface ECGs and intracardiac ECGs in WT and SNAP25 cKO mice treated with DPO-1 (e), and the bar graph shows the incidence of AF in the WT and SNAP25 cKO mice treated with DPO-1 (f) (n = 5–8 samples per group). g The quantification of AF duration in WT and SNAP25 cKO mice treated with DPO-1 (n = 5 samples for WT group, n = 8 samples for cKO group). Data are presented as mean ± SEM (b, d, and f) or median with interquartile ranges (IQR) (g). P values were calculated using two-tailed Student’s t-test (b, d), Chi-square test (f), or Mann-Whitney test (g). DPO-1, diphenyl phosphine oxide-1; ns, not significant. Source data are provided as a Source Data file.
Fig. 6
Fig. 6. SNAP25 accelerates the internalization of Kv1.5 channel from the surface membrane to early endosomes.
a SNAP25 co-immunoprecipitated with Kv1.5 in mouse atrial tissues. The immunoprecipitating antibody is indicated above each lane (n = 3–5 samples per group). b IF imaging of Kv1.5 (red) and SNAP25 (green) in isolated mouse atrial cardiomyocytes using confocal microscopy, with yellow indicating colocalization. Zoom-in demonstrating the local association of SNAP25 with Kv1.5. White boxes indicate the orientation of the signal intensity profiling (n = 3–5 samples per group, scale bar = 10 μm). Colocalization analysis revealed a high percentage of overlapping SNAP25 and Kv1.5. c IF imaging of Kv1.5 (red) and Cav-3 (green) or EEA1 (green) in isolated mouse atrial cardiomyocytes using super-resolution structured illumination microscopy (SIM). Pearson’s correlation coefficients were performed for assessing the colocalization levels of Kv1.5 with Cav-3 or EEA1 (P = 9.05e-9) in WT and SNAP25 cKO group. Colocalization analysis displayed the colocalization of Kv1.5 and Cav-3 in plasma membrane of atrial cardiomyocyte from SNAP25 cKO mice, and the colocalization of Kv1.5 and EEA1 in cytoplasm of atrial cardiomyocyte from WT mice. Scale bar = 10 μm (n = 14 cells per group). Western blot detected the expression of surface proteins of SNAP25 and Kv1.5 in atrial tissues from WT, SNAP25 cKO, and SNAP25 cKO+Dyn group (d), and quantitative analysis (e) (n = 3 samples per group). IF Immunofluorescence, EEA1 early endosome antigen 1, Dyn Dynasore, Cav-3 Caveolin-3, ns not significant. Data are presented as median with interquartile ranges (IQR) (c, up) or mean ± SEM (c, down; e). P values were calculated using Mann-Whitney test (c, up), two-tailed Student’s t-test (c, down) or one-way ANOVA (e). Source data are provided as a Source Data file.
Fig. 7
Fig. 7. SNAP25 deficiency increases arrhythmogenicity in the human induced pluripotent stem cell-derived atrial cardiomyocyte monolayer.
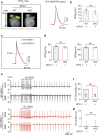
a Relative mRNA expression of SNAP25 in si-NC and si-SNAP25 group; GAPDH is used for the loading control (n = 3 independent experiments in each group) (P = 8.8e-4). Representative western blot bands (b) and normalized expression of SNAP25 protein expression in si-NC and si-SNAP25 group (c) (n = 3 independent experiments in each group). Representative MEA traces from human iPSC-aCMs monolayers (d), and a summary of the incidence of human iPSC-aCMs arrhythmia in si-NC, si-SNAP25, and si-SNAP25 + DPO-1 group (e) (n = 8-10 independent experiments in each group). f Representative AP traces of human iPSC-aCMs from si-NC, si-SNAP25, and si-SNAP25 + DPO-1 group. g Statistical and quantitative analysis of APD50 and APD90 in si-NC, si-SNAP25, and si-SNAP25 + DPO-1 group (n = 5 independent experiments in each group). Data are presented as mean ± SEM (a, c, e, and g). P values were calculated using two-tailed Student’s t-test (a, c), Chi-square test (e), or one-way ANOVA (g). Source data are provided as a Source Data file.

Similar articles

References

    1. Brundel, B. et al. Atrial fibrillation. Nat. Rev. Dis. Prim.8, 21 (2022). - PubMed
    1. Baman, J. R. & Passman, R. S. Atrial Fibrillation. Jama325, 2218 (2021). - PubMed
    1. Michaud, G. F. & Stevenson, W. G. Atrial Fibrillation. N. Engl. J. Med.384, 353–361 (2021). - PubMed
    1. Seiffge, D. J. et al. Secondary stroke prevention in people with atrial fibrillation: treatments and trials. Lancet Neurol.23, 404–417 (2024). - PubMed
    1. Spatz, E. S. & Herrin, J. Screening for atrial fibrillation to prevent stroke: increasing enthusiasm but outcomes still lag. Eur. Heart J.44, 205–207 (2023). - PubMed

MeSH terms

Substances

LinkOut - more resources