. 2025 Apr 19;16(1):3716.
doi: 10.1038/s41467-025-59070-0.

An organ-wide spatiotemporal transcriptomic and cellular atlas of the regenerating zebrafish heart

Affiliations

An organ-wide spatiotemporal transcriptomic and cellular atlas of the regenerating zebrafish heart

Lei Li et al. Nat Commun. .

Abstract

Adult zebrafish robustly regenerate injured hearts through a complex orchestration of molecular and cellular activities. However, this remarkable process, which is largely non-existent in humans, remains incompletely understood. Here, we utilize integrated spatial transcriptomics (Stereo-seq) and single-cell RNA-sequencing (scRNA-seq) to generate a spatially-resolved molecular and cellular atlas of regenerating zebrafish heart across eight stages. We characterize the cascade of cardiomyocyte cell states responsible for producing regenerated myocardium and explore a potential role for tpm4a in cardiomyocyte re-differentiation. Moreover, we uncover the activation of ifrd1 and atp6ap2 genes as a unique feature of regenerative hearts. Lastly, we reconstruct a 4D "virtual regenerating heart" comprising 569,896 cells/spots derived from 36 scRNA-seq libraries and 224 Stereo-seq slices. Our comprehensive atlas serves as a valuable resource to the cardiovascular and regeneration scientific communities and their ongoing efforts to understand the molecular and cellular mechanisms underlying vertebrate heart regeneration.


Conflict of interest statement

Competing interests: The authors declare no competing interests.

Figures
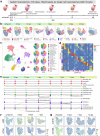
Fig. 1
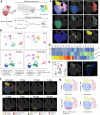
Fig. 1. A spatiotemporal transcriptomic and cellular transcriptomic atlas of the regenerating zebrafish heart.
a Schematic diagram of the experimental design. Hearts were harvested pre-injury (i.e., uninjured), 6 hpa, 12 hpa, 1 dpa, 3 dpa, 7 dpa, 14 dpa, and 28 dpa and subjected to Stereo-seq (3 sections per heart, 6 hearts per stage, 8 stages; 105 total sections analyzed) or scRNA-seq (3 or 6 libraries per stage, 27 total libraries, 7656 cells on average per library). b Documentation of key cellular responses across sequential stages of regeneration. Spatial distributions of major cell-type domains in representative cardiac sections from Stereo-seq. c UMAP clusters discovered by scRNA-seq including all 8 time-points of zebrafish heart across sequential regeneration stages. Pie charts represent the proportions of cell types at each stage. Single asterisks show newly appearing cell types at different time points, and double asterisks show cell types with significantly higher proportions at 1 dpa and 3 dpa compared to the uninjured group. d Scaled cell-type compositions within each domain. The color legend is shared with (b and c). e Directed acyclic graph showing inferred cellular trajectories during the stages of zebrafish heart regeneration. Each row corresponds to one cluster annotation, and each column corresponds to one regenerative stage. Nodes and their colors denote cell-type or cell-state annotations. The gray lines represent lineage relationships between different cell types or states. Speculated nodes and their relationships are shown using dashed nodes and lines. f, g Organ-wide spatial visualization of imputed expression patterns of genes cd63, hif1ab, acta1b, and mt-nd5 at the indicated regeneration stages. CM Cardiomyocyte, V Ventricle, A Atrium, comp. compact, activ. activation, dediff. dedifferentiation, prolif. proliferation, re-diff. re-differentiation, reg. pro-regenerative, BZm border zone myocardium, RZm remote zone myocardium, Vm Ventricular myocardium, Am Atrial myocardium, VAm Ventricular or Atrial myocardium, ECs Endothelial cells, SMC Smooth muscle cells, MC Macrophages, MFE Macrophages Fibroblasts and Endocardial cells, FB Fibroblasts, Epi Epicardium, RBC Red blood cells. Source data are provided as a Source Data file.
Fig. 2
Fig. 2. Cellular dynamics of regenerating cardiomyocytes.
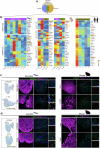
a Spatially-resolved visualization of cardiomyocyte-related domains at different stages. b Representative images of uninjured or regenerating heart sections processed for fluorescence in situ hybridization to visualize the distributions of tnfrsf11b (green) and nppb (green). The sections were co-stained with the myocardial antibody MF20 (magenta) and counterstained with DAPI (blue). c Immunostaining of regenerating heart sections with antibodies against TPM1 (magenta), ACTN2 (green) and counterstained with DAPI (blue). d Immunostaining of regenerating heart sections with antibody against embCMHC (green) and counterstained with DAPI (blue). e Immunostaining images of uninjured or regenerating heart sections with antibodies against PCNA (green) or Mef2 (red). Arrows point to PCNA-positive CMs. f Spatial visualization of imputed expression of tpm4a at different stages (top). Representative images of uninjured or regenerating zebrafish heart sections processed for fluorescence in situ hybridization to visualize the distributions tpm4a (green) (bottom). The sections were co-stained with MF20 (magenta) and counterstained with DAPI (blue). g Representative images of cardiac sections from wild-type (WT) and Z8+/- hearts at 30 dpa stained with Acid Fuchsin-Orange G (AFOG) (top), or immunostained with MF20 (magenta) and DAPI (blue) (bottom). The dashed lines outline scar tissue. h Scatter plot showing scar area expressed as a percentage of ventricular area for WT and Z8+/- hearts at 30 dpa. i Representative immunostaining images of WT and Z8+/- zebrafish heart at 7 dpa stained with antibodies against PCNA (green) and Mef2 (red) (top) and immunostaining with embCMHC (green) and DAPI (blue) (bottom). j Scatter plot showing the CM proliferation index for WT and Z8+/- hearts at 7 dpa. k Scatter plot showing the fluorescence intensity of embCMHC in the ventricular area for WT and Z8+/- hearts at 7 dpa. l Representative images of cardiac sections from WT and Z8+/- hearts at 30 dpa. Immunostained with antibodies against ACTN2 (green) and counterstained with DAPI (blue). Scale bars: 100 μm for (b, dg, i and l); 20 μm for (c). Source data are provided as a Source Data file.
Fig. 3
Fig. 3. Dynamic endocardium, macrophage and fibroblast subtypes during zebrafish heart regeneration.
a Dimensionality reduction of endocardium subtypes analyzed by scRNA-seq (top). Spatial visualization of Endocardium (activ.) abundance using cell type deconvolution. The color legend for the UMAP plots is shown in (b). b Bar graph showing the endocardial subtype percentages at each regeneration stage as determined by scRNA-seq (Red blood cells and Others were not included). c Sankey diagram showing the predicted pathways mediating cell-cell communications between cardiomyocytes and endocardium at 6 hpa, 12 hpa and 1 dpa. d Dimensionality reduction of macrophage subclasses determined by scRNA-seq (top) and spatial visualization of deconvoluted Macrophages (prolif.) abundance (bottom), respectively, at every regeneration stage. e Fluorescence in situ hybridization staining with grnas (green) and immunostaining with antibodies against MF20 (magenta) and DAPI (blue) in uninjured or regenerating hearts at 12 hpa or 1 dpa (n = 4 sections from 4 hearts for each time point). Arrows indicate cardiomyocytes, and arrowheads indicate non-cardiomyocytes. Scale bars: 100 μm for upper panels; 50 μm for lower panels. f UMAP clusters identified through scRNA-seq, including various subtypes of macrophages. The color legend for the UMAP plots is displayed in (g). g Bar graph showing the macrophage subtype percentages at each regeneration stage as determined by scRNA-seq. h Dimensionality reduction of fibroblast subpopulations analyzed by scRNA-seq (top) and spatial visualization domain 12: FB (reg.) by Stereo-seq (bottom), respectively, across all regeneration stages. i Fluorescence in situ hybridization staining with col12a1a (green), lum (red) and DAPI (blue) in uninjured or regenerating hearts at 7 dpa (n = 4 sections from 4 hearts for each time point). Arrowheads indicate co-located signals. Scale bars: 100 μm. j UMAP showing the subclusters and the RNA velocity of fibroblast as determined by scRNA-seq. The color legend for the UMAP plots is displayed in panel (k). k Bar graph showing the fibroblast subtype percentages at every regeneration stage as determined by scRNA-seq. Source data are provided as a Source Data file.
Fig. 4
Fig. 4. Identification of conserved transcriptional responses shared by highly regenerative hearts.
a Venn diagram illustrating genes that are upregulated or high expression in regenerative hearts (zebrafish and P1 mouse) and high expression in uninjured samples in non-regenerative hearts (P8 mouse and human). b Heatmaps showing the expression of overlapped genes selected in (a). c Spatial visualization of imputed expression of atp6ap2 in uninjured and regenerating hearts at 1 dpa (left). Representative images of fluorescence in situ hybridization for atp6ap2/Atp6ap2 (green) and immunostaining with antibodies against MF20 (magenta), TPM1(magenta) and DAPI (blue) on sections of zebrafish uninjured or regenerating hearts at 1 dpa and mouse hearts for sham surgery or 1 day after MI induces. Scale bars: 100 μm for left panels; 10 μm for right panels. d Spatial visualization of imputed expression of ifrd1 in uninjured and regenerating hearts at 6 hpa, based on Stereo-seq data imputation using scRNA-seq data (left). Representative images of fluorescence in situ hybridization for ifrd1/Ifrd1 (green) and immunostaining with antibodies against MF20 (magenta), TPM1(magenta) and DAPI (blue) on sections of zebrafish uninjured or regenerating hearts at 6 hpa and mouse hearts for sham surgery or 1 day after MI induces. Scale bars: 100 μm for left panels; 10 μm for right panels. MI, myocardial infarction; P1, the day of birth; P8, postnatal day 8; P1-1/3 (P8-1/3), collected at 1 or 3 days post-surgery; BZ, border zone; RZ, remote zone; IZ, ischaemic zone; FZ, fibrotic zone; CTRL, control. Source data are provided as a Source Data file.
Fig. 5
Fig. 5. Generation of 3D and 4D spatiotemporal transcriptional and cellular atlases of the uninjured and regenerating zebrafish heart.
a Workflow for reconstructing the 3D transcriptional landscape of the uninjured zebrafish heart. b UMAP plots of the scRNA-seq data from the uninjured atrium, ventricle, bulbus arteriosus (BA) and whole heart. The dashed lines identify major chamber-specific populations. c 2D projections of the 3D spatial distributions of major cell types in the uninjured zebrafish heart based on integrated data from Stereo-seq and scRNA-seq. d Heatmap showing the differential expression of genes highly expressed in the BA-specific endocardium subtype across all endocardial populations. e UMAP plot showing the expression of ccn1 (left). 2D projection of the 3D spatial distribution of ccn1 in uninjured zebrafish heart (middle). A representative image of a cardiac section processed for fluorescence in situ hybridization to detect ccn1 (green), counterstained with DAPI (blue). Scale bar: 200 μm. f 2D projections of the 3D spatial distributions of dynamic cellular changes during zebrafish heart regeneration (n = 15 sections analyzed for uninjured; n = 9–14 sections analyzed per regenerative time point). g Graphical summary of key dynamic cellular changes during zebrafish heart regeneration. Source data are provided as a Source Data file.

Similar articles

Cited by

References

    1. Wang, Z., Ma, L., Liu, M., Fan, J. & Hu, S. Summary of the 2022 Report on Cardiovascular Health and Diseases in China. Chin. Med. J. (Engl.)136, 2899–2908 (2023). - PMC - PubMed
    1. Tsao, C. W. et al. Heart Disease and Stroke Statistics-2023 Update: A Report From the American Heart Association. Circulation147, e93–e621 (2023). - PubMed
    1. Prabhu, S. D. & Frangogiannis, N. G. The biological basis for cardiac repair after myocardial infarction: from inflammation to fibrosis. Circ. Res. 119, 91–112 (2016). - PMC - PubMed
    1. Nguyen, P. D., de Bakker, D. E. M. & Bakkers, J. Cardiac regenerative capacity: an evolutionary afterthought? Cell Mol. Life Sci.78, 5107–5122 (2021). - PMC - PubMed
    1. Qi, Y. et al. Functional heart recovery in an adult mammal, the spiny mouse. Int. J. Cardiol.338, 196–203 (2021). - PubMed

Substances

LinkOut - more resources