. 2025 Apr 19;16(1):3714.
doi: 10.1038/s41467-025-58895-z.

Decoupled few-femtosecond phase transitions in vanadium dioxide

Affiliations

Decoupled few-femtosecond phase transitions in vanadium dioxide

Christian Brahms et al. Nat Commun. .

Abstract

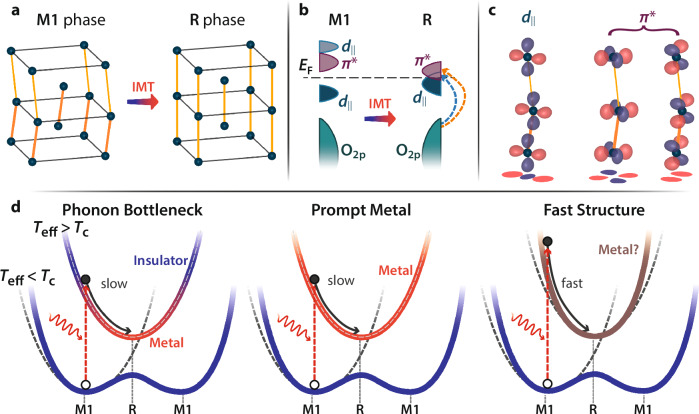
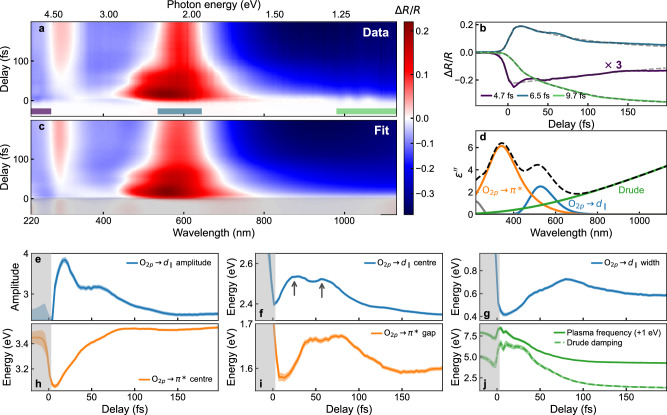
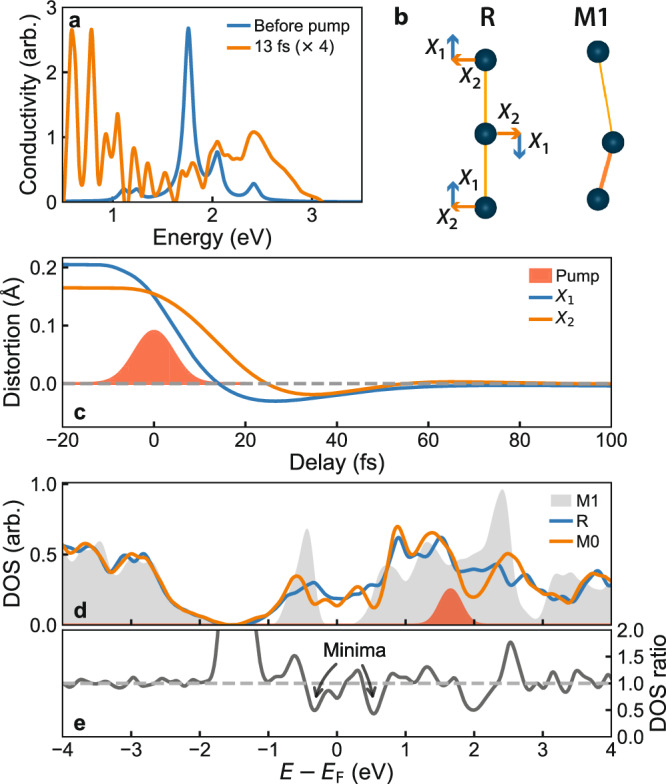
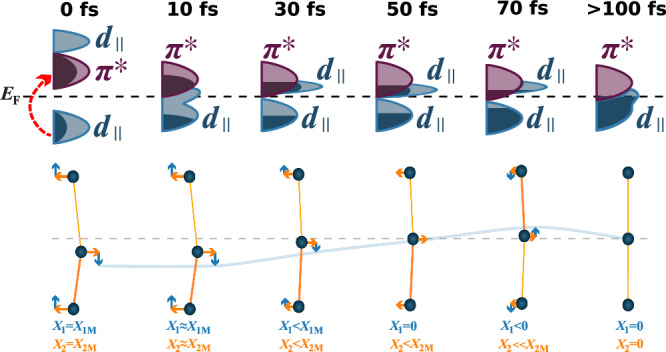
The nature of the insulator-to-metal phase transition in vanadium dioxide (VO2) is one of the longest-standing problems in condensed-matter physics. Ultrafast spectroscopy has long promised to determine whether the transition is primarily driven by the electronic or structural degree of freedom, but measurements to date have been stymied by their sensitivity to only one of these components and/or their limited temporal resolution. Here we use ultra-broadband few-femtosecond pump-probe spectroscopy to resolve the electronic and structural phase transitions in VO2 at their fundamental time scales. Our experiments show that the system transforms into a bad-metallic phase within 10 fs after photoexcitation, but requires another 100 fs to complete the transition, during which we observe electronic oscillations and a partial re-opening of the bandgap, signalling a transient semi-metallic state. Comparisons with tensor-network simulations and density-functional theory calculations show these features result from an unexpectedly fast structural transition, in which the vanadium dimers separate and untwist with two different timescales. Our results resolve the structural and electronic nature of the light-induced phase transition in VO2 and establish ultra-broadband few-femtosecond spectroscopy as a powerful tool for studying quantum materials out of equilibrium.


Conflict of interest statement

Competing interests: The authors declare no competing interests.

Figures

Fig. 1
Fig. 1. The light-induced phase transition in VO2.
a Structure of VO2 in the monoclinic (M1) and rutile (R) phases. Oxygen atoms are omitted for clarity. Darker orange lines indicate shorter (dimerised) bonds in the M1 phase. b Associated electronic density-of-states changes between the phases. In the M1 phase, the d band splits and the π* orbitals move to higher energies, opening a bandgap. Also indicated are the main optical transitions in the R phase as determined by ellipsometry (see methods). c Orbital structure of the two main bands involved in the IMT. Red and blue colouring indicate positive and negative values, respectively. The dimerisation and tilt in the M1 vanadium chains change the overlap of the d orbitals and two π* orbitals. d Possible scenarios for the interplay of the structural and electronic components of the ultrafast IMT. Photoexcitation (red arrows) causes a sudden change of lattice potential and raises the effective temperature Teff above its critical value for the phase transition, Tc. In the phonon bottleneck picture (left), VO2 remains insulating (blue shading) until the structure transforms (grey arrow), while in the prompt metal scenario (centre), the system abruptly metallises (red shading) and the structure transforms later. In the fast structural scenario (right), the lattice moves faster than the linear phonon modes, leaving it unclear if the structural transformation follows the electronic one or vice versa (brown shading). Dashed grey lines show the harmonic approximation to the lattice potential.
Fig. 2
Fig. 2. Ultra-broadband ultrafast spectroscopy of the photoinduced phase transition in VO2.
a Transient reflectivity of a 45 nm thick VO2 thin film on sapphire when excited through the phase transition by a few-fs-duration pulse centred at 610 nm and a flucence of 29 mJ/cm2. A variety of non-trivial dynamics are seen at all regions of the spectrum. b Lineouts (coloured lines) and rise time fits (dashed lines) of the dynamics averaged over wavelength in the three spectral bands indicated in (a). Transition times as low as 5 fs (temporal resolution limited) are observed. c Fit of the transient differential reflectivity using the metallic phase dielectric function. d The dielectric function of the rutile metallic phase (dashed line), as well as the constituent resonances (solid). Only the Drude term and the two indicated optical transitions (coloured lines) are allowed to vary in fitting the experimental data in panel a. The O2pd resonance is modelled as a Gaussian while the O2pπ* is modelled as a Tauc-Lorentz resonator. ej Variation of the fitting parameters from (d) with pump-probe delay. All parameters of the Drude and O2pd transitions are allowed to vary freely, while for the O2pπ* resonance the width and amplitude are fixed. This set of parameters represents the minimal best fit to the data; further details on the fitting procedure and model in Methods. Shaded areas around the lines show the error on the fit parameters as given by the square root of the diagonal of the covariance matrix.
Fig. 3
Fig. 3. Simulations of the ultrafast phase transition.
a TN-MF simulated optical conductivity before and 13 fs after photoexcitation showing instantaneous bandgap collapse. b Illustration of the two components of the structural distortion. c Structural dynamics following the phase transition. The dimerization relaxes prior to the tilt, overshooting the rutile positions, before fully relaxing in less than 100 fs. d DOS calculated with DFT for the monoclinic and rutile phases, and for a structural configuration (M0) close to that predicted by the TN-MF calculations for ~20 fs delay. e Ratio of the DOS of the M0 configuration and the rutile phase. The DOS near the Fermi level in the M0 phase exhibits several minima as compared to the rutile phase. Electrons generated at energies excited by the pump (red Gaussian in d) need to relax across these minima prior to full thermalization.
Fig. 4
Fig. 4. Electronic and structural changes during the light-induced IMT of VO2.
The system begins in the M1 phase, then photoexcitation causes a prompt electronic phase transition and the bandgap collapses. This launches rapid and coherent phonon motion, causing the lattice to transform faster than would be expected from the normal phonon modes. The structural competition/electron cooling causes the electronic structure to partially re-open the bandgap as the dimerization and tilt coherently evolve, stymying further purely electronic relaxation. After 100 fs strong electron-phonon scatters cools the electrons and heats the lattice, damping all coherent motion, and the system approaches the thermal rutile phase.

References

    1. Zylbersztejn, A. & Mott, N. F. Metal-insulator transition in vanadium dioxide. Phys. Rev. B11, 4383–4395 (1975).
    1. Goodenough, J. B. The two components of the crystallographic transition in VO2. J. Solid State Chem.3, 490–500 (1971).
    1. Grandi, F., Amaricci, A. & Fabrizio, M. Unraveling the Mott-Peierls intrigue in vanadium dioxide. Phys. Rev. Res. 2, 013298 (2020).
    1. Allen, P. B. Theory of thermal relaxation of electrons in metals. Phys. Rev. Lett.59, 1460–1463 (1987). - PubMed
    1. Cavalleri, A., Dekorsy, T., Chong, H. H. W., Kieffer, J. C. & Schoenlein, R. W. Evidence for a structurally-driven insulator-to-metal transition in VO2: A view from the ultrafast timescale. Phys. Rev. B70, 161102 (2004).

LinkOut - more resources