. 2025 Apr 19;15(1):153.
doi: 10.1038/s41398-025-03366-8.

Exon-variant interplay and multi-modal evidence identify endocrine dysregulation in severe psychiatric disorders impacting excitatory neurons

Affiliations

Exon-variant interplay and multi-modal evidence identify endocrine dysregulation in severe psychiatric disorders impacting excitatory neurons

Karolina Worf et al. Transl Psychiatry. .

Abstract

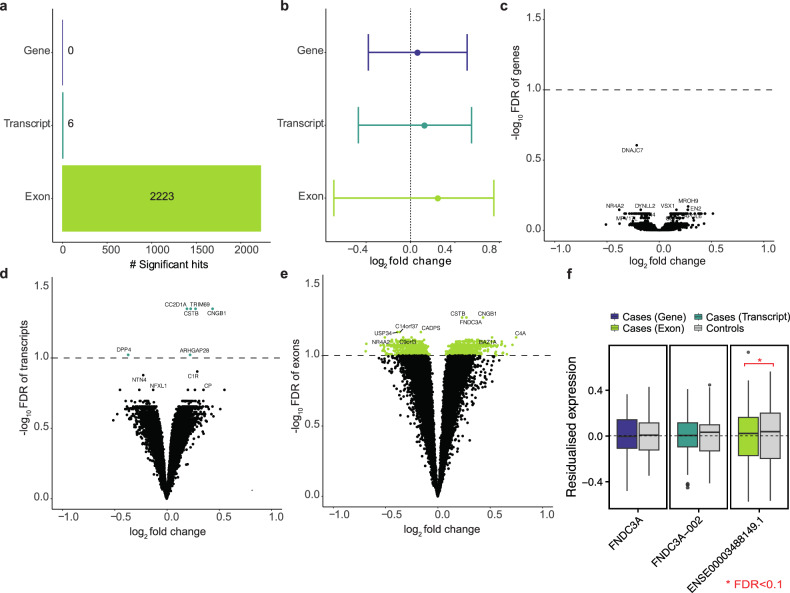
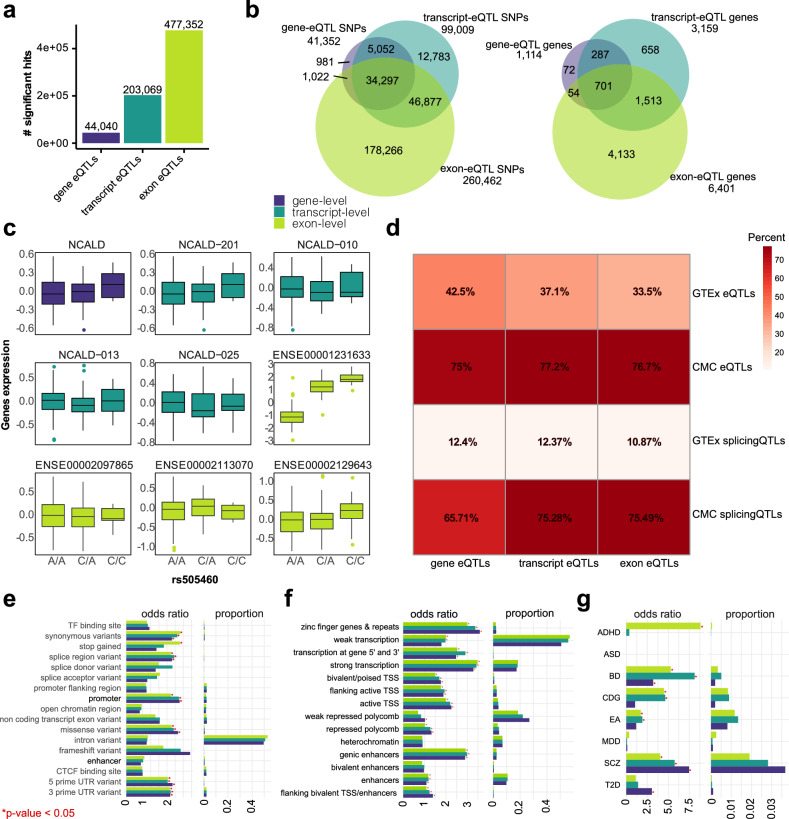
Bipolar disorder (BD), major depressive disorder (MDD), and schizophrenia share genetic architecture, yet their molecular mechanisms remain elusive. Both common and rare genetic variants contribute to neural dysfunction, impacting cognition and behavior. This study investigates the molecular effects of genetic variants on human cortical single-cell types using a single-exon analysis approach. Integrating exon-level eQTLs (common variants influencing exon expression) and joint exon eQT-Scores (combining polygenic risk scores with exon-level gene expression) from a postmortem psychiatric cohort (BD = 15, MDD = 24, schizophrenia = 68, controls = 62) with schizophrenia-focused rare variant data from the SCHEMA consortium, we identified 110 core genes enriched in pathways including circadian entrainment (FDR = 0.02), cortisol synthesis and secretion (FDR = 0.026), and dopaminergic synapse (FDR = 0.038). Additional enriched pathways included hormone signaling (FDRs < 0.0298, including insulin, GnRH, aldosterone, and growth hormone pathways) and, notably, adrenergic signaling in cardiomyocytes (FDR = 0.0028). These pathways highlight shared molecular mechanisms in the three disorders. Single-nuclei RNA sequencing data from three cortical regions revealed that these core set genes are predominantly expressed in excitatory neuron layers 2-6 of the dorsolateral prefrontal cortex, linking molecular changes to cell types involved in cognitive dysfunction. Our results demonstrate the power of integrating multimodal genetic and transcriptomic data at the exon level. This approach moves beyond symptom-based diagnoses toward molecular classifications, identifying potential therapeutic targets for psychiatric disorders.


Conflict of interest statement

Competing interests: F.J.T. consults for Immunai Inc., CytoReason Ltd, Cellarity, BioTuring Inc., and Genbio.AI Inc., and has an ownership interest in Dermagnostix GmbH and Cellarity. The other authors declare no competing interests. Ethics approval and consent to participate: All methods were performed in accordance with relevant guidelines and regulations. For Dataset 1, postmortem brains were collected with approval from the Ethics Committee of the Victorian Institute of Forensic Medicine, 1 and this study was further approved by the Human Ethics Committee of Melbourne Health [23]. For Dataset 2a, ethical approval was obtained from the Human Research Ethics Committees at the University of Wollongong (HE2018/351) and the Ludwig-Maximilians-Universität Munich (17-085 and 18-393). Two publicly available datasets (Dataset 2b and 2c) were used, and ethical approval for these studies was obtained by the original data generators. For Dataset 1, written informed consent was obtained from the next of kin for all tissue donations. For Dataset 2a, all donors provided written informed consent for brain donation prior to their death, which was subsequently confirmed by their next of kin.

Figures

Fig. 1
Fig. 1. Differential expression analysis results.
a Bar plot illustrating significantly differentially expressed genes at the gene-, transcript- and exon-level. b Forest plot displaying the log2 fold change (log2FC) range and median absolute log2FC (dot) of the 2 223 exon-level differentially expressed genes compared to transcript- and gene-level. Exon-level changes exhibit a larger magnitude (median absolute log2FC = 0.23, range of −0.69–0.75) than transcript- (median absolute log2FC = 0.11, range of −0.47–0.55) and gene-level (median absolute log2FC = 0.047, range of −0.38–0.51). Volcano plots depicting (c) gene-level, (d) transcript-level and (e) exon-level differential expression analysis outcomes. The x-axis represents log2FC, while the y-axis shows -log10(FDR). Significant hits (FDR < 0.1) are highlighted in turquoise for transcript-level and light green for exon-level differentially expressed gene hits. Among the exon-level differentially expressed genes, 51% (1 139 of 2 223 genes) and among the transcript-level differentially expressed genes, 83% (5 of 6 genes) are upregulated. f Boxplots illustrating the effect of diagnosis on FNDC3A expression, separately for each level: FNDC3A gene, FNDC3A-002 transcript and ENSE00003488 exon residualised expression for cases (purple, turquoise, or light green) and control subjects (gray). The x-axis indicates expression residuals and an asterisk indicates a significant multiple testing corrected p-value (FDR < 0.1).
Fig. 2
Fig. 2. eQTL results and enrichment analysis of genomic features.
a Bar plot showing significant eQTLs at the gene-, transcript- and exon-level. b Venn diagram illustrating the overlap of eQTL genes among all three levels. c Example association plot for rs505460-NCALD expression, displaying the effects of this variant on the expression of this gene at all three levels. rs505460 only has a visible influence on the expression of exon ENSE00001231633. d Overlap between genes from the three eQTL levels and eQTL and splicingQTL genes from the GTEx or CMC datasets in the human cortex. Genomic overlap between eSNPs of all three levels with (e) Ensembl Variant Effect Predictor (VEP) categories, (f) the 15-state model of the Roadmap Epigenomics Project measured in DLPFC and (g) various GWAS traits from the Psychiatric Genomics Consortium and non-psychiatric phenotypes as negative controls. The results are presented as bar plots showing odds ratios with significant p-values indicated by an asterisk (*p-value < 0.05), along with proportions of overlap with the original datasets. ADHD attention-deficit hyperactivity disorder, ASD autism spectrum disorder, BD bipolar disorder, CDG cross disorder meta-analysis, EA educational attainment, MDD major depressive disorder, SCZ schizophrenia, T2D type 2 diabetes.
Fig. 3
Fig. 3. Joint-SNP effects on cortical expression.
a Bar plot displaying the number of significant exon-level expression-polygenic risk score associations, also known as the exon expression quantitative trait score (exon eQT-Score). The y-axis represents the counts of exon eQT-Score genes, and the x-axis indicates the corresponding GWAS used in the eQT-Score calculation. b Forest plot illustrating the effect size of exon-level eQTL genes and exon eQT-Score genes. The y-axis shows the median beta or t-statistic and the x-axis displays the GWAS used in the eQT-Score calculation. Exon eQT-Score genes exhibited a larger effect size (median absolute schizophrenia t-stats = 2.55, range from −4.53–4.32, median absolute MDD t-stats = 2.46, range from −4.39–5.2, median absolute BD t-stats = 2.63, range from −4.81–4.89) compared to single-exon-level eQTL genes (median absolute beta = −0.1, range from −3.77–2.48, p-value Wilcoxon test < 2.2 × 10−16). c Venn diagram showing the overlap between exon eQTL genes (gray), the joint BD, MDD and SCZ GWAS exon eQT-Score genes (purple) and differentially expressed exon-level genes (blue). BD bipolar disorder, MDD major depressive disorder, SCZ schizophrenia, CDG cross disorder, T2D type 2 diabetes.
Fig. 4
Fig. 4. Genes disrupted by rare and common variants.
a Venn diagram showing the overlap between single SNP exon eQTL genes (gray), joint exon eQT-Score genes (purple) and genes altered by rare variants in the SCHEMA consortium data [8] (green). b Bar plot illustrating the KEGG pathway enrichment analysis results for the core set of genes (n = 110). The top 10 pathways are visualized, with dark gray bars denoting statistically significant pathways. The significance threshold, set at FDR < 0.05 / -log10(adj.P-value)>1.3, is indicated by the dashed red line. The y-axis represents the enriched KEGG pathways, while the x-axis displays the -log10-transformed adjusted p-values (FDRs). c Heatmap depicting cell-type specificity for the core gene set of enrichment signals defined at the gene-level from the snRNA-seq data (BA11: Dataset 2a, BA9: Dataset 2b, BA6/10: Dataset 2c). The star indicates a significant enrichment p-value < 0.05. Ex excitatory neurons, In inhibitory neurons (identified based on the expression pattern of peptide genes: VIP, SST, SV2C and calcium-binding protein: gene PVALB), OPC oligodendrocyte precursor cell, Oligo oligodendrocyte.
Fig. 5
Fig. 5. The missense gene GRIN2A, a core gene enriched in excitatory neurons.
a Heatmap displaying 30 genes from the core gene set significantly enriched in at least one of the overrepresented BA9 cell types. The plot shows the datasets in which the genes are significant. b Association plot of cross-disorder PRS and ENSE00001323909.1 exon-level expression of GRIN2A, separated into cases and controls with mean residualized expression in control = 0.04 and cases = −0.02 (cross-disorder exon eQT-Score). The x-axis indicates expression residuals and the y-axis shows cross-disorder PRS values. c Box plot indicating the exon-level eQTL expression of GRIN2A exon ENSE00001323909.1 for rs1545099. The y-axis indicates expression residuals and the x-axis shows genotypes. d UMAP of the Glutamate Ionotropic Receptor NMDA Type Subunit 2A (GRIN2A) expression in BA9, where gray denotes minimal expression and blue represents high expression. e UMAP of the 26 clusters identified in BA9.

Similar articles

References

    1. Wang Y, Meng W, Liu Z, An Q, Hu X. Cognitive impairment in psychiatric diseases: biomarkers of diagnosis, treatment, and prevention. Front Cell Neurosci. 2022;16:1046692. - PMC - PubMed
    1. Huang M-L, Khoh T-T, Lu S-J, Pan F, Chen J-K, Hu J-B, et al. Relationships between dorsolateral prefrontal cortex metabolic change and cognitive impairment in first-episode neuroleptic-naive schizophrenia patients. Medicine. 2017;96:e7228. - PMC - PubMed
    1. Trubetskoy V, Pardiñas AF, Qi T, Panagiotaropoulou G, Awasthi S, Bigdeli TB, et al. Mapping genomic loci implicates genes and synaptic biology in schizophrenia. Nature. 2022;604:502–8. - PMC - PubMed
    1. Consortium TIS, The International Schizophrenia Consortium. Common polygenic variation contributes to risk of schizophrenia and bipolar disorder. Nature. 2009;460:748–52. - PMC - PubMed
    1. Binder EB. Polygenic risk scores in schizophrenia: ready for the real world? Am J Psychiatry. 2019;176:783–4. - PubMed