. 2025 Apr 19;15(1):154.
doi: 10.1038/s41398-025-03377-5.

Age-dependent cortical overconnectivity in Shank3 mice is reversed by anesthesia

Affiliations

Age-dependent cortical overconnectivity in Shank3 mice is reversed by anesthesia

Elena Montagni et al. Transl Psychiatry. .

Abstract

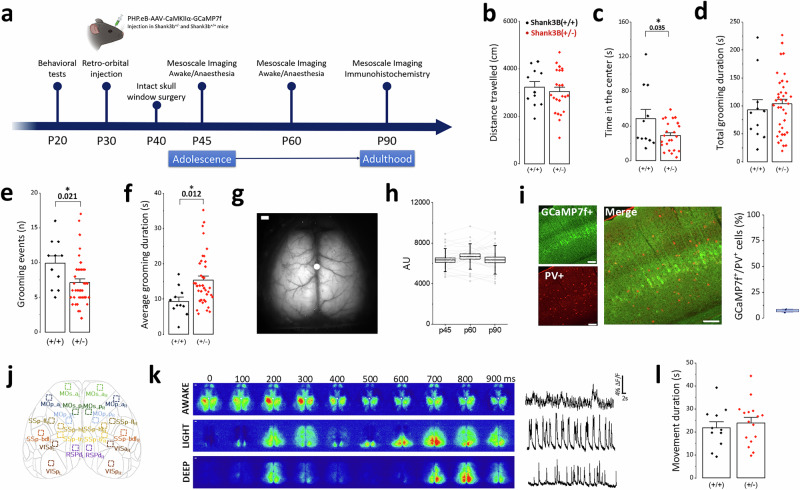
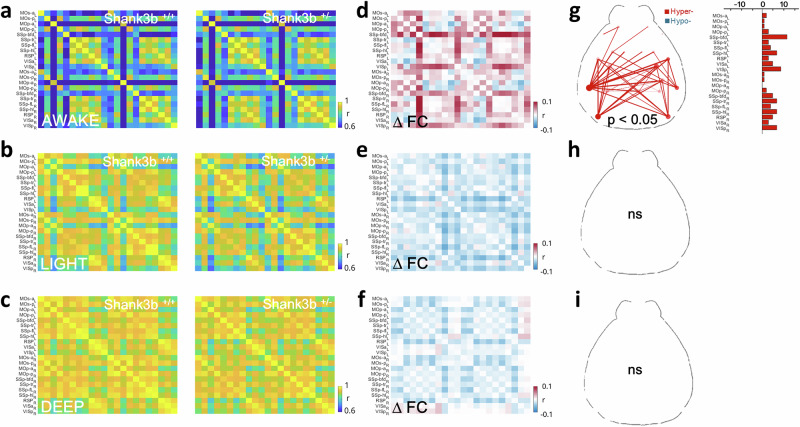
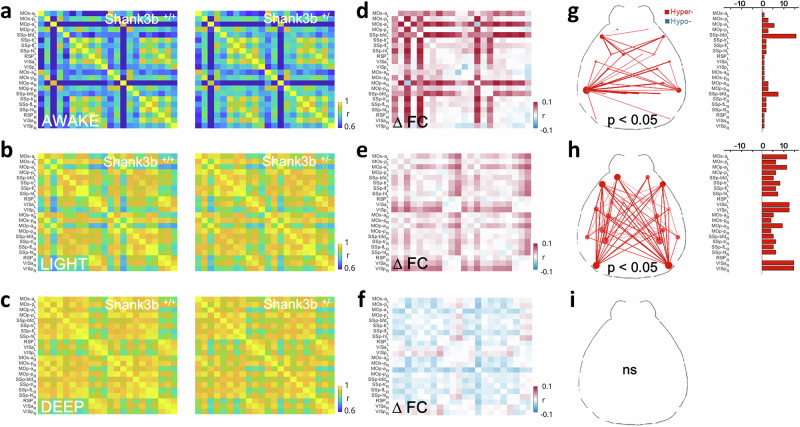
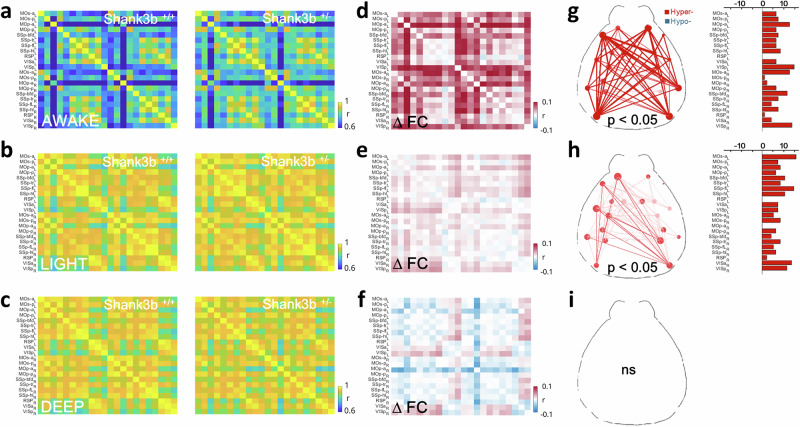
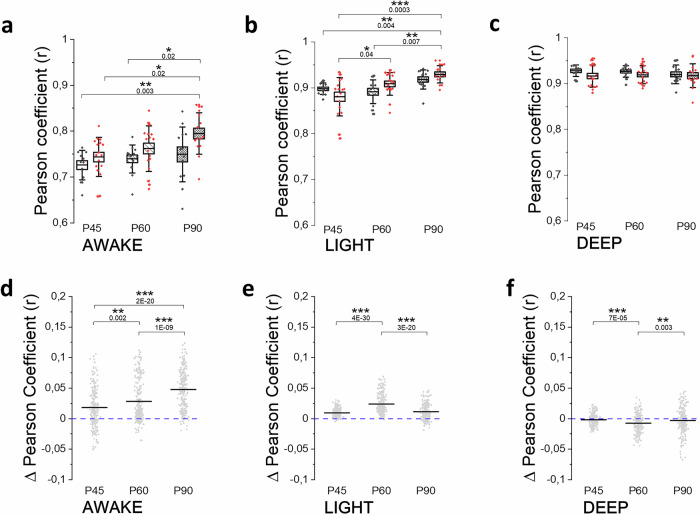
Growing evidence points to brain network dysfunction as a central neurobiological basis for autism spectrum disorders (ASDs). As a result, studies on Functional Connectivity (FC) have become pivotal for understanding the large-scale network alterations associated with ASD. Despite ASD being a neurodevelopmental disorder, and FC being significantly influenced by the brain state, existing FC studies in mouse models predominantly focus on adult subjects under anesthesia. The differential impact of anesthesia and age on cortical functional networks in ASD subjects remains unexplored. To fill this gap, we conducted a longitudinal evaluation of FC across three brain states and three ages in the Shank3b mouse model of autism. We utilized wide-field calcium imaging to monitor cortical activity in Shank3b+/- and Shank3b+/+ mice from late development (P45) through adulthood (P90), and isoflurane anesthesia to manipulate the brain state. Our findings reveal that network hyperconnectivity, emerging from the barrel-field cortices during the juvenile stage, progressively expands to encompass the entire dorsal cortex in adult Shank3b+/- mice. Notably, the severity of FC imbalance is highly dependent on the brain state: global network alterations are more pronounced in the awake state and are strongly reduced under anesthesia. These results underscore the crucial role of anesthesia in detecting autism-related FC alterations and identify a significant network of early cortical dysfunction associated with autism. This network represents a potential target for non-invasive translational treatments.


Conflict of interest statement

Competing interests: The authors declare no competing interests.

Figures

Fig. 1
Fig. 1. Experimental design for cortical mesoscopic calcium imaging, immunohistochemical analysis and behavioral characterization of Shank3b+/− mice.
a Experimental timeline, with behavioral test at P20 followed by retro-orbital injection of AAV-PHP.eB GCaMP7f at P30, optical window implantation at P40 and longitudinal imaging timepoints at P45, P60 and P90. At the end of in vivo experiments, immunohistochemical analysis was performed. bf Quantification of open field performance of Shank3b+/+ and Shank3b+/− mice, b Total distance travelled (3220 ± 240 cm n = 11 Shank3b+/+; 3034 ± 188 cm n = 23 Shank3b+/−, two-sample t-test), c Time spent in the center of the arena (48 ± 10 s n = 11 Shank3b+/+, 29 ± 3 s n = 23 Shank3b+/−, *p < 0.05, two-sample t-test), d quantification of the total amount of self-grooming grooming (93 ± 18 s n = 11 Shank3b+/+, 103 ± 8 s n = 38 Shank3b+/−, two-sample t-test), e quantification of the number of self-grooming events (n) performed (9.9 ± 1.0 n = 11 Shank3b+/+, 7.1 ± 0.5 n = 38 Shank3b+/−, *p < 0.05, two-sample t-test). f Averaged duration of a single self-grooming event (9 ± 1 s n = 11 Shank3b+/+, 15 ± 1 s n = 38 Shank3b+/−, *p < 0.05, two-sample t-test). g Representative image of the field of view. White dots represent bregma, scalebar: 1 mm. h In vivo quantification of GCaMP7f expression across timepoints (6326 ± 223 AU - P45, 6679 ± 245 AU - P60, 6354 ± 277 AU - P90, n = 27, one-way repeated measure ANOVA). i Left, representative immunohistochemistry images showing the neuronal expression of GCaMP7f (green) and PV (red) in the whole cortical layers, scalebar: 100 µm. Right, Quantification of the colocalization ratio GCaMP7f+/PV+ (7.4 ± 1.0%, n = 3 mice). j Cortical parcellation map with 10 × 10 ROI based on Allen Mouse Brain Atlas (see Methods). k Left, representative image sequences showing cortical activity in three different brain states (awake, light anesthesia and deep anesthesia). White dots represent bregma, scale bar: 1 mm. Right, representative single-trail time series showing averaged cortical activity in the same brain states. l Quantification of forepaw movement during imaging session at P45. Shank3b+/+ (black) and Shank3b+/− (red) mice spent the same time doing movement (21.8 ± 2.6 s, n = 11 Shank3b+/+; 23.9 ± 2.3 s, n = 16 Shank3b+/−, two-sample t-test). Data represents mean ± SEM, each dot represents one animal.
Fig. 2
Fig. 2. Awake state hyperconnectivity of barrel field and visual cortices in adolescent Shank3b+/- mice (P45).
ac Pairwise Pearson’s correlation coefficients of cortical activity in a 3 min window were visualized as averaged correlation matrices for genotype (Shank3b+/+ left, Shank3b+/− right) in the awake state (a), light anesthesia (b) and deep anesthesia (c). df Matrix of difference, produced by subtracting the average FC of Shank3b+/+ from that of Shank3b+/− mice in the awake state d, light anesthesia (e) and deep anesthesia (f). Red and blue squares indicate Shank3b+/− hyper- or hypo-connectivity respectively. gi Network diagrams (left) of statistically significant FC alterations in the awake state (g), light anesthesia (h) and deep anesthesia (i). The bar plot (right) indicates the number of significant FC alterations for each cortical area. (n = 11 Shank3b+/+ and 17 Shank3b+/−). Statistical test: NBS. p < 0.05.
Fig. 3
Fig. 3. Hyperconnectivity becomes more prominent and spreads to motor regions at P60.
ac Pairwise Pearson’s correlation coefficients of cortical activity in a 3 min window were visualized as averaged correlation matrices for genotype (Shank3b+/+ left, Shank3b+/− right) in the awake state a, light anesthesia (b) and deep anesthesia (c). df Matrix of difference, produced by subtracting the average FC of Shank3b+/+ from that of Shank3b+/− mice in the awake state d, light anesthesia (e) and deep anesthesia (f). Red and blue squares indicate Shank3b+/− hyper- or hypo-connectivity respectively. gi Network diagrams (left) of statistically significant FC alterations in the awake state (g), light anesthesia (h) and deep anesthesia (i). The bar plot (right) indicates the number of significant FC alterations for each cortical area. (n = 13 Shank3b+/+ and 17 Shank3b+/−). Statistical test: NBS. p < 0.05.
Fig. 4
Fig. 4. Alterations in functional connectivity persist at P90.
a–c Pairwise Pearson’s correlation coefficients of cortical activity in a 3 min window were visualized as averaged correlation matrices for genotype (Shank3b+/+ left, Shank3b+/− right) in the awake state (a), light anesthesia (b) and deep anesthesia (c). df Matrix of difference, produced by subtracting the average FC of Shank3b+/+ from that of Shank3b+/− mice in the awake state (d), light anesthesia (e) and deep anesthesia (f). Red and blue squares indicate Shank3b+/− hyper- or hypo-connectivity respectively. gi Network diagrams (left) of statistically significant FC alterations in the awake state (g), light anesthesia (h) and deep anesthesia i. The bar plot (right) indicates the number of significant FC alterations for each cortical area. (n = 13 Shank3b+/+ and 14 Shank3b+/−). Statistical test: NBS. p < 0.05.
Fig. 5
Fig. 5. Network alterations are stronger in the awake state and increase over time.
ac Box plots of global functional connectivity across time for both the genotypes (Shank3b+/+ black, Shank3b+/− red) in the awake state (a) light anesthesia (b) and deep anesthesia (c) (*p < 0.05; **p < 0.01; ***p < 0.001, two-way ANOVA). df Longitudinal monitoring of difference in person coefficient between Shank3b+/− and Shank3b−/− in awake (d), light (e) and deep anesthesia (f). *p < 0.05; **p < 0.01; ***p < 0.001, one-way ANOVA.
Fig. 6
Fig. 6. Characterization of layer V pyramidal neurons of SSp-bfd.
a Passive properties such as membrane capacitance (left, 74.28 ± 5.65 pF, n = 7 Shank3b+/+ mice, N = 22 cells; 70.53 ± 4.76 pF, n = 8 Shank3b+/− mice, N = 31 cells), membrane resistance (middle, 125.6 ± 5.32 mΩ, n = 7 Shank3b+/+ mice, N = 22 cells; Shank3b+/−, 152.3 ± 7.45 mΩ, n = 8 mice, N = 31 cells), and resting membrane potential (right, −64.2 ± 2.067 mV, n = 7 mice Shank3b+/+, N = 22 cells; −67.06 ± 1.58 mV, n = 8 Shank3b+/− mice, N = 31 cells) in Shank3b+/+ (black) and Shank3b+/− mice (red). b Action potential threshold (−47.89 ± 1.67 mV, n = 7 Shank3b+/+ mice, N = 21 cells; −47.24 ± 1.57 mV, n = 8 Shank3b+/− mice, N = 31 cells). c Representative current clamp traces obtained by 500 ms steps of increasing depolarizing current ranging from −90 to +210 in 20pA increments. Bold traces show the action potential firing at 210 pA current input in Shank3b+/+ (grey) and Shank3b+/− (red). d Current-AP curves obtained by plotting the mean number of AP evoked against current input amplitude (n = 7 Shank3b+/+ mice, N = 20 cells; n = 8 Shank3b+/− mice, N = 26 cells). e Representative whole-cell recordings of sEPSCs from Shank3b+/+ (grey) and Shank3b+/− (red) mice. f Bars graph of absolute (dots) and average (bars) measure of sEPSCs frequency (left, 2.32 ± 0.33 Hz, n = 7 Shank3b+/+ mice, N = 18 cells; 2.764 ± 0.24 Hz, n = 8 Shank3b+/− mice, N = 24 cells) and amplitude (right, −10.32 ± 0.42 pA, n = 7 Shank3b+/+ mice, N = 18 cells; −11.88 ± 0.38 pA, n = 8 Shank3b+/− mice, N = 24 cells) in both genotypes. Data are presented as mean ± SEM, each dot represents one animal. p-values were obtained from the LMM, and significance was defined as *p < 0.05.

Similar articles

References

    1. Balasco L, Pagani M, Pangrazzi L, Chelini G, Ciancone Chama AG, Shlosman E, et al. Abnormal whisker-dependent behaviors and altered cortico-hippocampal connectivity in Shank3b−/− mice. Cereb Cortex. 2022;32:3042–56. - PMC - PubMed
    1. Hull JV, Dokovna LB, Jacokes ZJ, Torgerson CM, Irimia A, Van Horn JD, et al. Corrigendum: resting-state functional connectivity in autism spectrum disorders: a review. Front Psychiatry. 2018;9:268. - PMC - PubMed
    1. Zerbi V, Pagani M, Markicevic M, Matteoli M, Pozzi D, Fagiolini M, et al. Correction: brain mapping across 16 autism mouse models reveals a spectrum of functional connectivity subtypes. Mol Psychiatry. 2022;27:3920–21. - PMC - PubMed
    1. Nakai N, Sato M, Yamashita O, Sekine Y, Fu X, Nakai J, et al. Virtual reality-based real-time imaging reveals abnormal cortical dynamics during behavioral transitions in a mouse model of autism. Cell Rep. 2023;42:112258. - PubMed
    1. Peixoto RT, Chantranupong L, Hakim R, Levasseur J, Wang W, Merchant T, et al. Abnormal striatal development underlies the early onset of behavioral deficits in Shank3B mice. Cell Rep. 2019;29:2016–27.e4. - PMC - PubMed