. 2025 Apr 19;16(1):3718.
doi: 10.1038/s41467-025-58982-1.

A vasculature-resident innate lymphoid cell population in mouse lungs

Affiliations

A vasculature-resident innate lymphoid cell population in mouse lungs

Simon Shirley et al. Nat Commun. .

Abstract

Tissue-resident immune cells such as innate lymphoid cells (ILC) are known to reside in the parenchymal compartments of tissues and modulate local immune protection. Here we use intravascular cell labeling, parabiosis and multiplex 3D imaging to identify a population of group 3 ILCs in mice that are present within the intravascular space of lung blood vessels (vILC3). vILC3s are distributed broadly in alveolar capillary beds from which inhaled pathogens enter the lung parenchyma. By contrast, conventional ILC3s in tissue parenchyma are enriched in lymphoid clusters in proximity to large veins. In a mouse model of pneumonia, Pseudomonas aeruginosa infection results in rapid vILC3 expansion and production of chemokines including CCL4. Blocking CCL4 in vivo attenuates neutrophil recruitment to the lung at the early stage of infection, resulting in prolonged inflammation and delayed bacterial clearance. Our findings thus define the intravascular space as a site of ILC residence in mice, and reveal a unique immune cell population that interfaces with tissue alarmins and the circulating immune system for timely host defense.


Conflict of interest statement

Competing interests: The authors declare no competing interests.

Figures
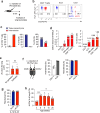
Fig. 1
Fig. 1. Identification of intravascular ILC3s in mouse lung.
a Lung intravascular leukocytes were in vivo stained via intravenous (i.v.) injection of fluorescently labeled anti-CD45 antibody (ivCD45). Mice were euthanized 5 min later for flow cytometry analysis of lung leukocytes. b Representative FACS plots and c quantification of the percentage of intravascular-resident (ivCD45+) and tissue parenchyma-resident (ivCD45) Lin+ NK1.1 CD4+ T cells, Lin Thy1+ RORγt NK1.1 KLRG1+/low ST2+ ILC2s, and Lin Thy1+ NK1.1 ST2 RORγt+ ILC3s in the lung of C57BL/6 (B6) mice as in (a). d FACS analysis of cell number and frequency of ILC3s, Lin RORγt NK1.1+ ILC1s, Lin+ CD4 NK1.1+ conventional NK (cNK), and CD4+ T cells in the peripheral blood of B6 mice. e Cell numbers of vILC3s in the lungs of B6 mice that were perfused or not perfused following ivCD45 labeling. ns, not significant, P = 0.8793. f B6.SJL (CD45.1+) and B6 (CD45.2+) mice were surgically connected to generate parabiotic pairs. One month after surgery, both parabionts were given an i.v. injection of fluorescently labeled anti-Thy1 antibody for 5 min to stain intravascular lymphocytes in the lungs. The percentage of cells expressing CD45.1 or CD45.2 was determined by FACS for indicated populations, to determine exchange between each parabiont. g One month after surgery, both parabionts were treated by intraperitoneal (i.p.) injection with IL-1β and IL-23 daily for 7 days. ivThy1 labeling and FACS analysis of host-derived tILC3s and vILC3s were performed as in (f). h FACS quantification of vILC3 percentage of total lung ILC3s in B6 mice at different ages; ****P < 0.0001; **P = 0.0059. Data in (ch) were shown as mean ± SD and represent findings from at least two independent experiments. n = 8 or 11 in (c), 5 in (d), 6 in (e), 4 in (f) and (g); in (h), n = 6 (3 weeks), 5 (6 weeks), 4 (9 weeks), 6 (16 weeks), or 9 (20 weeks). The statistics were obtained in (e) by unpaired two-tailed t test and in (h) by one-way analysis of variance with Tukey’s multiple comparisons test.
Fig. 2
Fig. 2. vILC3s are widely distributed in the capillary beds of the lung.
a Representative clearing-enhanced 3D (Ce3D) imaging of the lung from RORγt-GFP reporter mice that received ivCD45 labeling. tILC3s and vILC3s were identified based on indicated marker expression. The vessels that are coated by the irregularly formed αSMA+ smooth muscle cells are veins. b Three representative images of ivCD45+ CD3 RORγt-GFP+ vILC3s (white arrows) in capillary beds. Lyve-1 labels blood vessel and lymphatic endothelial cells. c x-y (top left), y-z (top right), and x-z (bottom) views of vILC3s that were localized within the intravascular space of capillary vessels. CD31 is blood vessel endothelial cell marker. d Three representative images of ivCD45 CD3 RORγt-GFP+ tILC3s (white arrows) in the lymphoid clusters in tissue and in proximity to the veins. e Quantification of the shortest distance among cells within each group, and shortest distance to the airways or αSMA+ vessels from vILC3s or tILC3s. n = 386 for tILC3 and 579 for vILC3 in (e). Data in (e) shown as mean ± SD and two-tailed non-parametric Mann-Whitney U test was used to calculate P-values. Data in (ae) were representative of two independent experiments.
Fig. 3
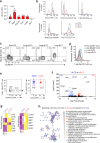
Fig. 3. vILC3s and tILC3s are phenotypically and transcriptionally distinct.
a Lung intravascular leukocytes were in vivo stained via i.v. injection of fluorescently labeled anti-CD45 antibody (ivCD45). Mice were euthanized 5 min later for flow cytometry analysis of lung leukocytes. Cell numbers of vILC3s in the lungs of B6 (WT), Rag1–/–, Gata3fl/fl Klrg1Cre, Tcrβ–/–, muMt–/– and Rorc–/– mouse lines determined by flow cytometry; ****P < 0.0001. b Histograms of CD127, CCR7, CD4, MHC-II and Sca-1 expression in vILC3s, tILC3s and ILC2s from the lungs of B6 mice determined by flow cytometry. c FACS analysis of NKp46 and CCR6 expression in gut ILC3s, lung tILC3s, vILC3s and ILC1s. d Histograms of T-bet expression in gut ILC3s, lung tILC3s and vILC3s. e vILC3s and tILC3s were FACS sorted from RORγt-GFP reporter mice and subjected to a bulk RNA-Seq analysis. f Volcano plot of differentially expressed genes in tILC3s (blue) and vILC3s (red). X axis represents log2 transformed fold change. Y axis represents negative log10 fold of adjusted P-value. In the volcano plots colored dots represented significant genes with adjusted P-value < 0.01. g Heatmaps of the expression of secreted factors (left) and cell adhesion molecules (right) between tILC3s and vILC3s. h Metascape analysis of signaling networks enriched in vILC3s compared to tILC3s. Each node represents a functional term. The size of the node is proportional to the number of genes that fall into the corresponding term and the color reflects its cluster identity. n = 3, 4, 5 or 11 in (a). The data are shown as mean ± SD. Data in (ad) were represent results from at least two independent experiments. The statistics in (a) were obtained by one-way analysis of variance with Dunnett’s multiple comparisons test.
Fig. 4
Fig. 4. vILC3s rapidly respond to cytokine stimulation.
a Lung intravascular leukocytes were in vivo stained via i.v. injection of fluorescently labeled anti-CD45 antibody. Mice were euthanized 5 min later for flow cytometry analysis of lung leukocytes. B6 mice were i.p. treated with IL-1β and IL-23 daily for up to 7 days, and the numbers of total lung ILC3s were analyzed by flow cytometry; ns, not significant, P = 0.6526; **P = 0.007; ****P < 0.0001. b Numbers of tILC3s and vILC3s in the lungs of B6 mice that were i.p. treated with IL-1β and IL-23 daily for 7 days; ****P < 0.0001 (left); **P = 0.0041 (right). c Percentage of Ki67+ tILC3s and vILC3s as in (a); ***P = 0.0006. d Representative FACS plots and (e) quantification of the percentage of IL-17A+ and IL-22+ tILC3s and vILC3s from Rag1–/– mice stimulated with PMA and ionomycin (in the presence of IL-2, IL-6, IL-1β and IL-23) ex vivo for 4 hours; ****P < 0.0001 (left); ns, P = 0.0546 (right). n = 4 or 6 in (ac), 7 in (e). The data are shown as mean ± SD. Data in (ac) and (e) are representative results from at least two independent experiments. The statistics for comparison of two variables in (b) and (e) were obtained by unpaired two-tailed t test; for more than two variables statistics in (a) and (c) were obtained by one-way analysis of variance with Dunnett’s multiple comparisons test or two-way ANOVA with Bonferroni’s multiple comparisons test.
Fig. 5
Fig. 5. vILC3s rapidly respond to P. aeruginosa infection and produce a unique set of chemokines.
a B6 mice were given a single dose (8 × 105 CFU) of P. aeruginosa via intranasal administration, and total ILC3s in the lungs were determined by flow cytometry on day 3, 5, 7, and 30 post infection; *P = 0.0423; ***P = 0.0004; **P = 0.0029. b Percentage of Ki67+ tILC3s and vILC3s as in (a); day 3, ***P = 0.0001; day 7, **P = 0.009. c, d Cell numbers of tILC3s and vILC3s on day 7 (in c: ***P = 0.001 (left); **P = 0.0092 (right)) or day 30 (in d: ***P = 0.0002 (left); ***P = 0.0004 (right)) post infection as in (a). e vILC3s and tILC3s were sorted from the lungs of RORγt-GFP mice on day 3 post P.a. infection, and subjected to bulk RNA-seq analysis. Volcano plot of differentially expressed genes in tILC3s (blue) and vILC3s (red). X axis represents log2 transformed fold change. Y axis represents negative log10 fold of adjusted P-value. In the volcano plots colored dots represented significant genes with adjusted P-value < 0.01. f Real-time qPCR analysis of Ccl4 mRNA expression in tILC3s and vILC3s sorted from the RORγt-GFP mice on day 3 post P.a. infection. Ccl4 level was relative to Gapdh mRNA; **P = 0.0077. g The read counts of scRNA-seq were extracted from the published datasets (GSE192890) and applied together with bulk RNA-seq in I to a modified R script based on the DotPlot function in Seurat. Both the size and color of the dots indicate the average expression scale of the gene. n = 5, 6 or 9 in (ad), 5 in (f). The data in (ad) and (f) were shown as mean ± SD and representative data from at least two independent experiments. The statistics for comparison of two variables (c), (d) and (f) were obtained by unpaired two-tailed t test; for more than two variables (a) and (b) statistics were obtained by one-way analysis of variance with Dunnett’s multiple comparisons test or two-way ANOVA with Bonferroni’s multiple comparisons test.
Fig. 6
Fig. 6. vILC3-derived CCL4 promotes the recruitment of neutrophils for host defense against bacterial infection.
a P.a.-infected mice were intravenously treated with normal IgG or an anti-CCL4 neutralizing antibody at 24 and 48 hours post infection. b Bodyweight loss of Rag1–/– mice as in (a); ns, not significant, P = 0.8514; *P = 0.0101; ***P = 0.0001. c Bodyweight loss of Rorc–/– mice as in (a); ns. d The numbers of neutrophils (CD11c CD11b+ Ly6G+ Siglec-F+); ***P = 0.0001 (NT vs. Pa + αIgG); *P = 0.0188 (NT vs. Pa + αCCL4); *P = 0.0117 (Pa + αIgG vs. Pa + αCCL4), macrophages (CD11c+ F4/80+); **P = 0.0042 (NT vs. Pa + αIgG); *P = 0.0374 (NT vs. Pa + αCCL4); ns, P = 0.5294 (Pa + αIgG vs. Pa + αCCL4), and cNK cells; ns, P = 0.2948 (NT vs. Pa + αIgG); ns, P = 0.3733 (NT vs. Pa + αCCL4); ns, P = 0.8688 (Pa + αIgG vs. Pa + αCCL4), in the lungs of Rag1–/– mice at 72 hours post infection. e The numbers of neutrophils; *P = 0.0242 (NT vs. Pa + αIgG); **P = 0.0032 (NT vs. Pa + αCCL4); ns, P = 0.336 (Pa + αIgG vs. Pa + αCCL4), macrophages; ns, P = 0.7645 (NT vs. Pa + αIgG); ns, P = 0.5164 (NT vs. Pa + αCCL4); ns, P = 0.9094 (Pa + αIgG vs. Pa + αCCL4), and CD4+ T cells; ns, P = 0.4859 (NT vs. Pa + αIgG); ns, P = 0.969 (NT vs. Pa + αCCL4); ns, P = 0.466 (Pa + αIgG vs. Pa + αCCL4) in the lungs of Rorc–/– mice at 72 hours post infection. f Leukocytes isolated from bone marrow or blood of B6 mice were subjected to a Transwell system with added recombinant CCL4 in the lower chamber. The percentage of transmigrated neutrophils was determined by flow cytometry; ***P = 0.0008 (left); ****P < 0.0001 (right). g Sorted vILC3s from P.a.-infected mice were added (5 × 103 cells/chamber) into the lower chamber with αCCL4 neutralizing antibody or isotype control (both at 100 ng/ml), and leukocytes isolated from blood were subjected to the insert of Transwell plate. Control had no vILC3s present in the lower chamber. The percentage of transmigrated neutrophils was determined by flow cytometry; **P = 0.0034. h Bacterial burden of P.a. in the lungs of Rag1–/– mice at 72 h post infection; ****P < 0.0001. i Three representative H&E staining of paraffin-embedded lung sections in (h). j Lung injury score (LIS) in (i); *, P = 0.036. k Static compliance of the lungs of Rag1–/– mice measured by flexiVent system at 72 hours post infection; *P = 0.0306. n = 9 in (b), 6 in (c), 6, 7, 8 or 11 in (d), 4, 6 or 8 in (e), 3, 6 or 9 in (f), 4 in (g), 7 or 8 in (h), 6 in (j), and 10 in (k). Data in (bh), (j) and (k) was shown as mean ± SD and represent data from at least two independent experiments. The statistics for comparison of two variables in (fh), (j) and (k) were obtained by unpaired two-tailed t test; for more than two variables in (be) the statistics were obtained by one-way analysis of variance with Tukey’s multiple comparisons test.

Similar articles

References

    1. Artis, D. & Spits, H. The biology of innate lymphoid cells. Nature517, 293–301 (2015). - PubMed
    1. Klose, C. S. & Artis, D. Innate lymphoid cells as regulators of immunity, inflammation and tissue homeostasis. Nat. Immunol.17, 765–774 (2016). - PubMed
    1. Constantinides, M. G., McDonald, B. D., Verhoef, P. A. & Bendelac, A. A committed precursor to innate lymphoid cells. Nature508, 397–401 (2014). - PMC - PubMed
    1. Juelke, K. & Romagnani, C. Differentiation of human innate lymphoid cells (ILCs). Curr. Opin. Immunol.38, 75–85 (2016). - PubMed
    1. Gasteiger, G., Fan, X., Dikiy, S., Lee, S. Y. & Rudensky, A. Y. Tissue residency of innate lymphoid cells in lymphoid and nonlymphoid organs. Science350, 981–985 (2015). - PMC - PubMed

LinkOut - more resources