. 2025 Apr 19;16(1):3729.
doi: 10.1038/s41467-025-59134-1.

A host-pathogen metabolic synchrony that facilitates disease tolerance

Affiliations

A host-pathogen metabolic synchrony that facilitates disease tolerance

Ying-Tsun Chen et al. Nat Commun. .

Abstract

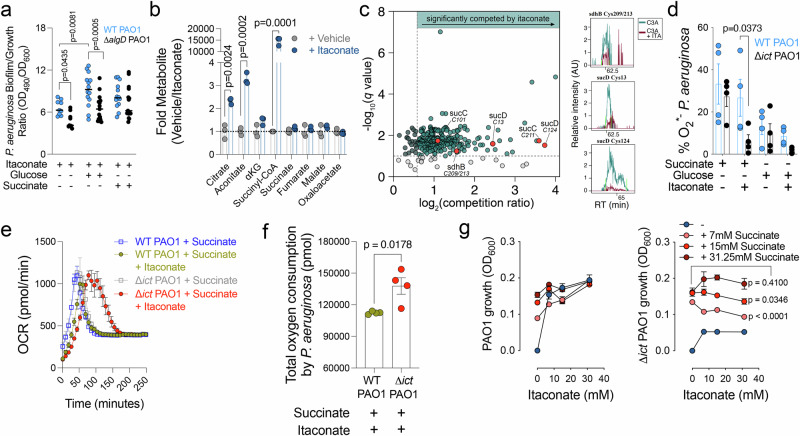
Disease tolerance mitigates organ damage from non-resolving inflammation during persistent infections, yet its underlying mechanisms remain unclear. Here we show, in a Pseudomonas aeruginosa pneumonia mouse model, that disease tolerance depends on the mitochondrial metabolite itaconate, which mediates cooperative host-pathogen interactions. In P. aeruginosa, itaconate modifies key cysteine residues in TCA cycle enzymes critical for succinate metabolism, inducing bioenergetic stress and promoting the formation biofilms that are less immunostimulatory and allow the bacteria to integrate into the local microbiome. Itaconate incorporates into the central metabolism of the biofilm, driving exopolysaccharide production-particularly alginate-which amplifies airway itaconate signaling. This itaconate-alginate interplay limits host immunopathology by enabling pulmonary glutamine assimilation, activating glutaminolysis, and thereby restrain detrimental inflammation caused by the inflammasome. Clinical sample analysis reveals that P. aeruginosa adapts to this metabolic environment through compensatory mutations in the anti-sigma-factor mucA, which restore the succinate-driven bioenergetics and disrupt the metabolic synchrony essential for sustaining disease tolerance.


Conflict of interest statement

Competing interests: The authors declare no competing interests.

Figures

Fig. 1
Fig. 1. P. aeruginosa strains tailored for disease tolerance synchronize itaconate signaling with impaired succinate metabolism.
Mice were exposed to either PBS, WT PAO1, or ΔalgD PAO1 (n = 3, total of 9–10 mice per group). Measures outcomes included: a BAL cytokines; b BAL albumin; c host survival. d Bacterial energy production (Biolog Technology) (n = 3). e, f Bacterial oxygen consumption rate (Seahorse) (e) and total oxygen consumption (AUC: arbitrary unit count) (f) (n = 5). g Caloric expenditure (μW/OD600). Right graph: total heat along growth (n = 4). h Growth curves (OD600) (n = 3). i Biofilm quantification (n = 12). j BAL succinate (n = 3, total of 6–10 mice per group); k bacterial burden (n = 3, total of 12 mice per group); l BAL itaconate (n = 3, total of 6–9 mice per group). WT and Irg1−/− mice were exposed to either PBS or WT PAO1 (n = 3, total of 8–10 mice per group). The following were measured: m BAL cytokines; n bacterial burden. Data are shown as average +/− SEM. d, fg, i: t-Student test. a, b, jn One-Way ANOVA (Tukey multiple comparison test). e, g, h Two-Ways ANOVA; C: Kaplan-Meier test. All statistical tests are two-sided. Source data are provided as a Source Data file.
Fig. 2
Fig. 2. Itaconate compromises P. aeruginosa succinate bioenergetics.
a Biofilm specialization by WT and ΔalgD PAO1 (OD540/OD600) (n = 3, 3-5 replicates per assay). WT PAO1 was exposed or not to itaconate in nutrient-rich media (LB). The following were measured: b intracellular TCA cycle metabolite abundance (n = 3); c Global chemoproteomic profiling of S-itaconation of the WT PAO1 proteome (n = 3). d Succinate oxidation (generation of anion superoxide (O2*−)) in WT PAO1 and Δict PAO1, which cannot degrade itaconate (n = 4). e oxygen consumption rates (OCR) by Seahorse technology (n = 4); f total oxygen consumed along time (n = 4); g growth (OD600) (n = 3). Data are shown as average +/− SEM. a: One-Way ANOVA (Tukey multiple comparison test). g Two-Way ANOVA. bd, f t-Student test. All statistical tests are two-sided. Source data are provided as a Source Data file.
Fig. 3
Fig. 3. Itaconate fuels P. aeruginosa anabolic remodeling.
a P. aeruginosa central metabolism; bf Intracellular metabolite abundance in WT PAO1 exposed or not to itaconate (n = 3); gk Isotope carbon tracing in WT PAO1 exposed or not to 13C-itaconate. Different isotopologues per metabolite are coded with numbers-colors (n = 3). Data are shown as average +/− SEM. bf: t-Student test. All statistical tests are two-sided. Source data are provided as a Source Data file.
Fig. 4
Fig. 4. The itaconate-alginate axis promotes tolerance to P. aeruginosa lung infection via glutaminolysis.
a Glutamine metabolism in AMs. Lungs from Irg1+/+ and Irg1−/− mice exposed to either PBS or WT PAO1 were studied by scRNA-Seq: b cell subsets; c glutamine metabolism genes in AMs; d Glutaminolysis score in AMs (n = 1, pool of two mice per group, total of 12-48 cells); e BAL metabolite enrichment (n = 3, total of 6-9 mice per group); f lung tissue metabolite levels (DESI-2D). Mice were exposed or not to WT PAO1 and administered or not with BPTES (n = 3, total of 3–5 mice per group). The following were measured: g BAL cytokines; h bacterial burden. i Bacterial energy production with glutamine (Biolog Technology) (n = 3). j Bacterial growth in glutamine (n = 3). k BAL metabolite enrichment (n = 3, total of 6–9 mice per group). l Bacterial energy production with glutamate (Biolog Technology) (n = 3). m Bacteria growth in glutamate (n = 3). Data are shown as average +/− SEM. e, i, k, l t-Student test. d, g, h One-Way ANOVA (Tukey multiple comparison test); j, m Two-Way ANOVA. All statistical tests are two-sided. Source data are provided as a Source Data file.
Fig. 5
Fig. 5. P. aeruginosa adapts to disease tolerance by disabling mucA.
a mucA mRNA levels (n = 3, 8-12 technical replicates). Number of P. aeruginosa genomes studied: ICU: 182; CF: 532; COPD: 90; COPD: 210. In these genomes, the following was evaluated: b Frequency of mucA mutations in P. aeruginosa isolates genomes. c Frequency of different mucA mutations in isolates; d, e Unbiased pathway enrichment analyzes between WT and mucA22 PAO1 (n = 3). Top 5 significantly changed pathways are shown. f, g Bacterial oxygen consumption rate (Seahorse) (f) and total oxygen consumption (area under the curve) (g) (AUC: arbitrary unit count) (n = 4). h Bacterial energy production (Biolog Technology) (n = 3). i growth curves (OD600) (n = 3). Data are shown as average +/− SEM. d, e t-Student test; a, g, h One-Way ANOVA (Tukey multiple comparison test); f, i Two-Ways ANOVA. All statistical tests are two-sided. Source data are provided as a Source Data file.
Fig. 6
Fig. 6. MucA22 worsens TNFα signaling during tolerance to P. aeruginosa lung infection.
a Mice were exposed to either PBS, WT PAO1, mucA22 PAO1 or mucA22ΔalgD PAO1 (n = 3, total of 8-11 mice per group). The following were analyzed: a, c BAL cytokines; b bacterial burden; d BAL albumin; e host survival. Mice were exposed to either PBS, WT PAO1, or mucA22 PAO1 (n = 2, total of 4–9 mice per group). The following were analyzed: f, g numbers and viability of type 1 pneumocyte in BAL; h, i, k lung cell numbers; j BAL VEGF. Data are shown as average +/− SEM. ad, fk: One-Way ANOVA (Tukey multiple comparison test). e: Kaplan-Meier test. All statistical tests are two-sided. Source data are provided as a Source Data file.
Fig. 7
Fig. 7. P. aeruginosa isolate FRD1 harbors signature of evolution in the tolerant lung.
a Number of non-synonymous mutations (# NSM) and gene expression level (logFC) for loci involved in EPS synthesis in FRD; control: WT PAO1. Mice were exposed to either PBS, WT PAO1, FRD1 or ΔalgD FRD1 (n = 2, total of 11-12 mice per group). The following were analyzed: b pathogen burden; c BAL cytokines; d BAL albumin; e body temperature; f Animal survival. Data are shown as average +/− SEM. B-E: One-Way ANOVA (Tukey multiple comparison test); f Kaplan-Meier. All statistical tests are two-sided. Source data are provided as a Source Data file.
Fig. 8
Fig. 8. P. aeruginosa isolate FRD1 increases succinate bioenergetics.
a Number of non-synonymous mutations (# NSM) and gene expression level (logFC) in FRD1 for TCA cycle clusters; control: WT PAO1. b, c oxygen consumption rates (OCR) by Seahorse technology (b) and total oxygen consumed along time (c) (AUC: arbitrary unit count) (n = 4). d bacterial energy production (Biolog Technology) (n = 3). e growth curves (OD600) (n = 3). Data are shown as average +/− SEM. cd: One-Way ANOVA (Tukey multiple comparison test); e Two-Ways ANOVA. All statistical tests are two-sided. Source data are provided as a Source Data file.

References

    1. Auger, J. P. et al. Metabolic rewiring promotes anti-inflammatory effects of glucocorticoids. Nature629, 184–192 (2024). - PubMed
    1. Mills, E. L. et al. Succinate dehydrogenase supports metabolic repurposing of mitochondria to drive inflammatory macrophages. Cell167, 457–470.e413 (2016). - PMC - PubMed
    1. O’Neill, L. A. J. & Artyomov, M. N. Itaconate: the poster child of metabolic reprogramming in macrophage function. Nat. Rev. Immunol.19, 273–281 (2019). - PubMed
    1. Kelly, B. & O’Neill, L. A. Metabolic reprogramming in macrophages and dendritic cells in innate immunity. Cell Res25, 771–784 (2015). - PMC - PubMed
    1. Ogger, P. P. & Byrne, A. J. Macrophage metabolic reprogramming during chronic lung disease. Mucosal Immunol.14, 282–295 (2021). - PMC - PubMed

MeSH terms

LinkOut - more resources