. 2025 Apr 19;16(1):3719.
doi: 10.1038/s41467-025-58924-x.

Anion intercalation enables efficient and stable carboxylate upgrading via aqueous non-Kolbe electrolysis

Affiliations

Anion intercalation enables efficient and stable carboxylate upgrading via aqueous non-Kolbe electrolysis

Xinyan Zhang et al. Nat Commun. .

Abstract

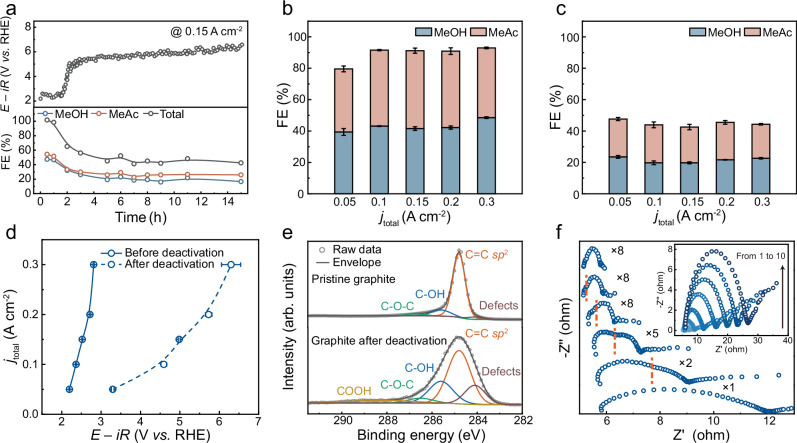
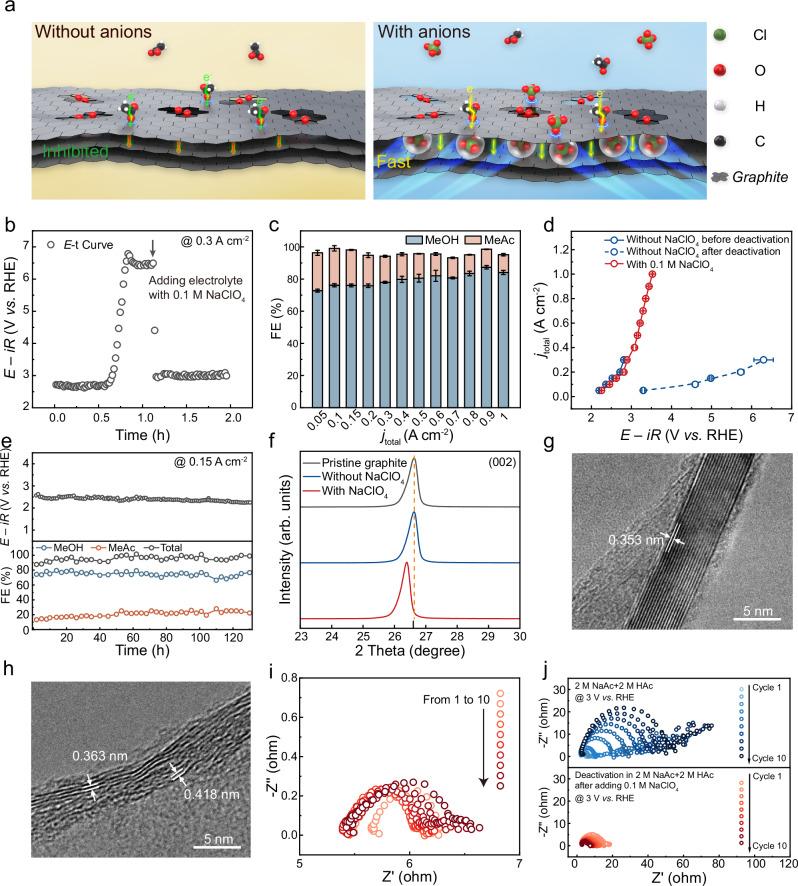
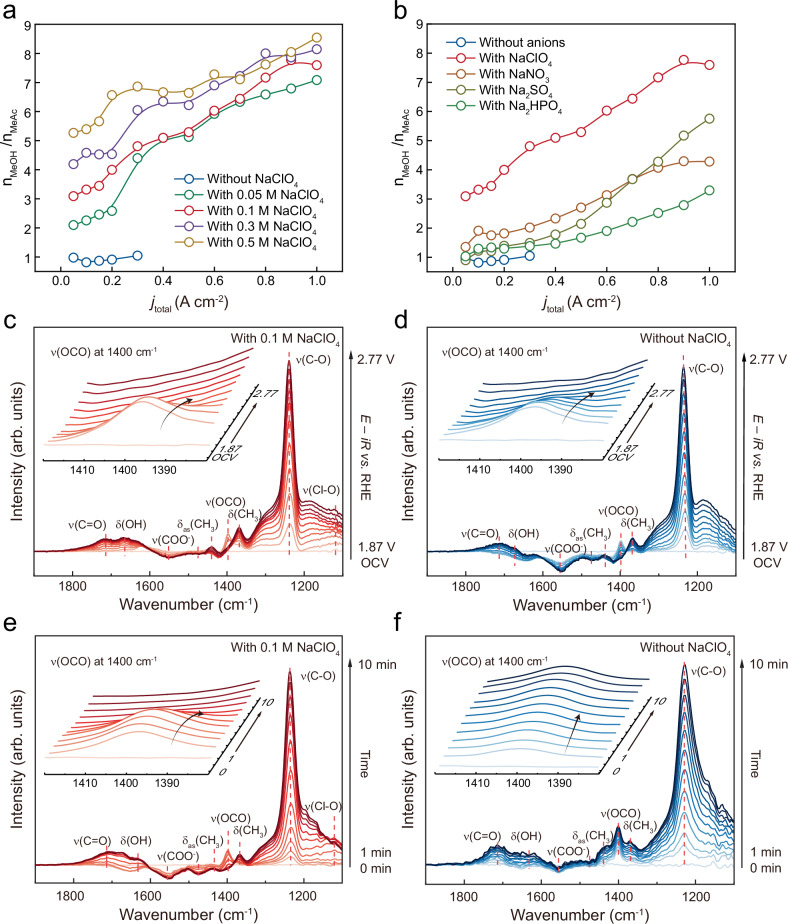
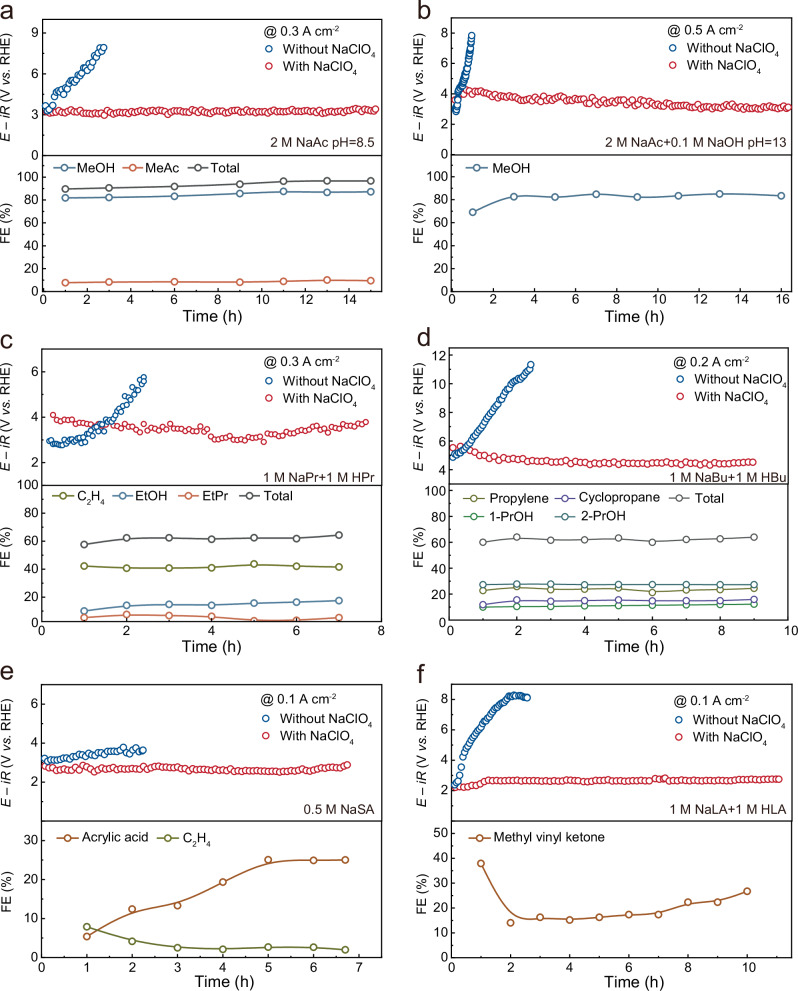
Next-generation techniques for sustainable carboxylate production generate carboxylate salts as the primary outcome. To circumvent the costly conversion of carboxylate salts to acids, we demonstrate the aqueous (non-)Kolbe electrolysis process as an alternative strategy to generate downstream value-added chemicals. Upon revealing the irreversible oxidation-induced charge transfer inhibition on the graphite anode, we propose an anion intercalation strategy to mitigate the stability problem induced by the ever-increasing overpotential. In acetate decarboxylation, we observe a high Faradaic efficiency of ~95% for non-Kolbe products (methanol and methyl acetate) at wide current densities ranging from 0.05 to 1 A cm-2 and long-term stability at current densities of 0.15 and 0.6 A cm-2 for 130 and 35 h, respectively. We also extended this strategy for the upgrading of long-chain carboxylates such as propionate, butyrate, and succinate. Our work provides valuable guidance for carboxylate upgrading and extendable strategy for overcoming passivation challenges in catalysis.


Conflict of interest statement

Competing interests: A China provisional patent application (202510190131.9) based on the technology described in this work was filed on Mar. 2025 by C.X., X.Z., X.L., X.F., Q.J., and T.Z. at the University of Electronic Science and Technology of China. The other authors declare no competing interests.

Figures

Fig. 1
Fig. 1. Investigation of the deactivation process involving a graphite electrode over an electrochemical decarboxylation reaction.
a Potential and catalytic performance versus time profile for graphite at 0.15 A cm−2 in an electrolyte containing 2 M NaAc and 2 M HAc (pH=4.75 ± 0.15). Catalytic performance of graphite at different current densities (b) pre-deactivation (c) post-deactivation. d The corresponding j-V curves of graphite before and after deactivation. e C 1 s XPS spectra of pristine graphite and post-deactivated graphite. f. Nyquist plots for the graphite reaction in 2 M NaAc and 2 M HAc at 2.47 V vs. RHE. The curves were ascribed to cycles 1 to 6 from top to bottom, respectively, and each cycle was scanned in the range from 1 MHz to 0.1 Hz. The inset shows the curves of the scanning cycles from 1 to 10. The solution resistance (R) for (a) is around 20.1 Ω. The solution resistance (R) and the corresponding potential without iR correction for (d) can be found in the figure caption of Supplementary Fig. 17. The error bars correspond to the standard deviation of three independent measurements. Source data for this figure are provided in the Source Data file.
Fig. 2
Fig. 2. Strategy for reactivating a graphite electrode.
a Schematic illustration of the reactivation strategy through the introduction of NaClO4 into the electrolyte. b Potential vs. time curve at 0.3 A cm−2 for deactivated graphite reacting in the electrolyte before and after the addition of 0.1 M NaClO4. c FEs for non-Kolbe products at different current densities for graphite reacting in the electrolyte with 0.1 M NaClO4. d The corresponding j-V curve of graphite reacting in the electrolyte with or without the addition of NaClO4. e Stability test at 0.15 A cm−2 in a flow cell system over 130 h. f XRD patterns of the graphite before and after reaction in the electrolyte with or without perchlorate. HR-TEM images of graphite after reaction (g) without or (h) with NaClO4. i Nyquist plots for the graphite reaction in 2 M NaAc + 2 M HAc with 0.1 M NaClO4 at 2.47 V vs. RHE. The curves were ascribed to scanning cycles 1 to 10, and each cycle was scanned in the range from 1 MHz to 0.1 Hz. j Nyquist plots for the graphite reaction in 2 M NaAc + 2 M HAc and the subsequent addition of 0.1 M NaClO4 at 3 V vs. RHE. The curves were ascribed to scanning cycles 1 to 10, and each cycle was scanned in the range from 1 MHz to 0.1 Hz. The solution resistance (R) for (b) is around 15.3 Ω. The solution resistance (R) and the corresponding potential without iR correction for (d) can be found in the figure caption of Supplementary Fig. 17. The solution resistance (R) for (e) is around 17.0 Ω. The error bars correspond to the standard deviation of three independent measurements. Source data for this figure are provided in the Source Data file.
Fig. 3
Fig. 3. Influence of the addition of perchlorate on the distribution of non-Kolbe products.
a The ratio of the non-Kolbe products with the addition of different concentrations of perchlorate. b The ratio of the non-Kolbe products with the addition of different anions. In-situ ATR-SEIRAS spectra of graphite reacting in the electrolyte (c) with or (d) without perchlorate with a change in potential. In-situ ATR-SEIRAS spectra of graphite reacting in the electrolyte (e) with or (f) without perchlorate over time at 2.27 V vs. RHE. Changes in the intensity of the νsOCO species are shown in the inset, which represents the adsorbed acetate. The solution resistance (R) for panels (c) and (e) is around 32.8 Ω. The solution resistance (R) for (d) and (f) is around 34.3 Ω. Source data for this figure are provided in the Source Data file.
Fig. 4
Fig. 4. Feasibility of the reactivating strategy under different conditions.
a Stability test of graphite reacting in an electrolyte containing 2 M NaAc (pH= 8.50 ± 0.25) with or without the addition of NaClO4 at 0.3 A cm−2. The solution resistance (R) is around 15.6 Ω and 16.7 Ω for the measurement with and without NaClO4, respectively. b Stability test of graphite reacting in an electrolyte containing 2 M NaAc and 0.1 M NaOH (pH= 12.9 ± 0.20) with or without the addition of NaClO4 at 0.5 A cm−2. The solution resistance (R) is around 9.71 Ω and 9.5 Ω for the measurement with and without NaClO4, respectively. c Stability test of graphite in an electrolyte containing 1 M propionic acid (HPr) and 1 M sodium propionate (NaPr) (pH= 4.88 ± 0.10) with or without the addition of NaClO4 at 0.3 A cm−2. The solution resistance (R) is around 24.9 Ω and 31.0 Ω for the measurement with and without NaClO4, respectively. d Stability test of graphite in electrolyte containing 1 M butyric acid (HBu) and 1 M sodium butyrate (NaBu) (pH= 4.82 ± 0.25) with or without the addition of NaClO4 at 0.2 A cm−2. The solution resistance (R) is around 30.9 Ω and 38.5 Ω for the measurement with and without NaClO4, respectively. e Stability test of graphite in an electrolyte containing 0.5 M monosodium succinate (NaSA) (pH= 6.50 ± 0.33) with or without the addition of NaClO4 at 0.1 A cm−2. The solution resistance (R) is around 36 Ω and 40.4 Ω for the measurement with and without NaClO4, respectively. f Stability test of graphite in an electrolyte containing 1 M levulinic acid (HLA) and 1 M sodium levulinate (NaLA) (pH= 4.65 ± 0.13) with or without the addition of NaClO4 at 0.1 A cm−2. The solution resistance (R) is around 25.9 Ω and 28.1 Ω for the measurement with and without NaClO4, respectively. The concentration ratio of carboxylate to NaClO4 was maintained at 20:1 for all the tests.

Similar articles

References

    1. Zheng, T. et al. Copper-catalysed exclusive CO2 to pure formic acid conversion via single-atom alloying. Nat. Nanotechnol.16, 1386–1393 (2021). - PubMed
    1. Overa, S. et al. Enhancing acetate selectivity by coupling anodic oxidation to carbon monoxide electroreduction. Nat. Catal.5, 738–745 (2022).
    1. Sullivan, K. P. et al. Mixed plastics waste valorization through tandem chemical oxidation and biological funneling. Science378, 207–211 (2022). - PubMed
    1. Pichler, C. M., Bhattacharjee, S., Rahaman, M., Uekert, T. & Reisner, E. Conversion of polyethylene waste into gaseous hydrocarbons via integrated tandem chemical-photo/electrocatalytic processes. ACS Catal.11, 9159–9167 (2021). - PMC - PubMed
    1. Zhou, H. et al. Selectively upgrading lignin derivatives to carboxylates through electrochemical oxidative C(OH)−C bond cleavage by a Mn-doped cobalt oxyhydroxide catalyst. Angew. Chem. Int. Ed.60, 8976 (2021). - PubMed

LinkOut - more resources