. 2025 Apr 19;10(1):19.
doi: 10.1038/s41536-025-00407-0.

Allogeneic RPE cell suspension manufactured at scale demonstrating preclinical safety and efficacy led to IND approval

Affiliations

Allogeneic RPE cell suspension manufactured at scale demonstrating preclinical safety and efficacy led to IND approval

Lalitha Soundararajan et al. NPJ Regen Med. .

Abstract

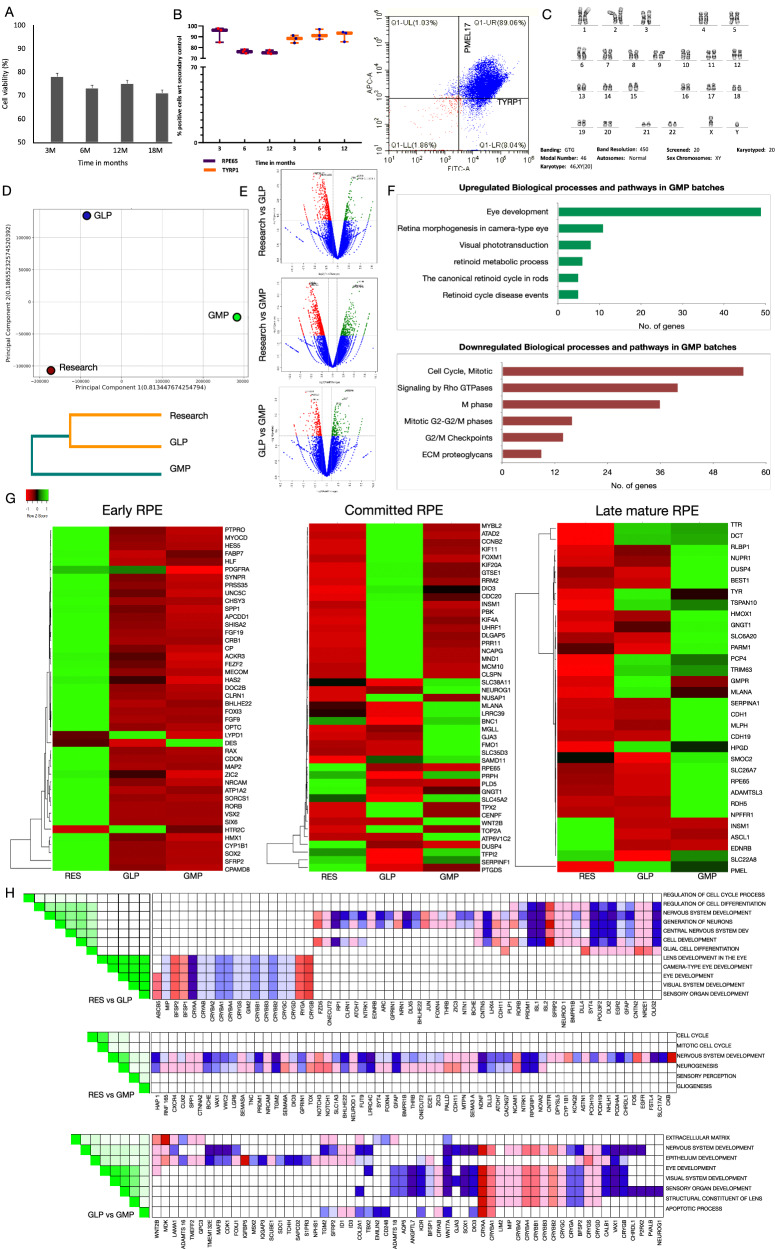
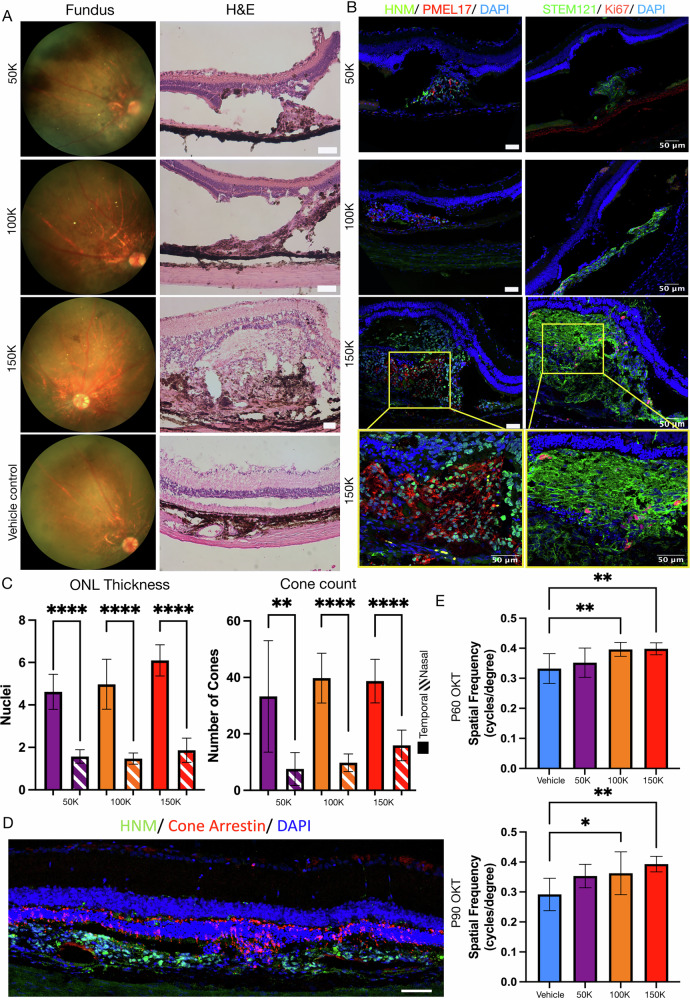
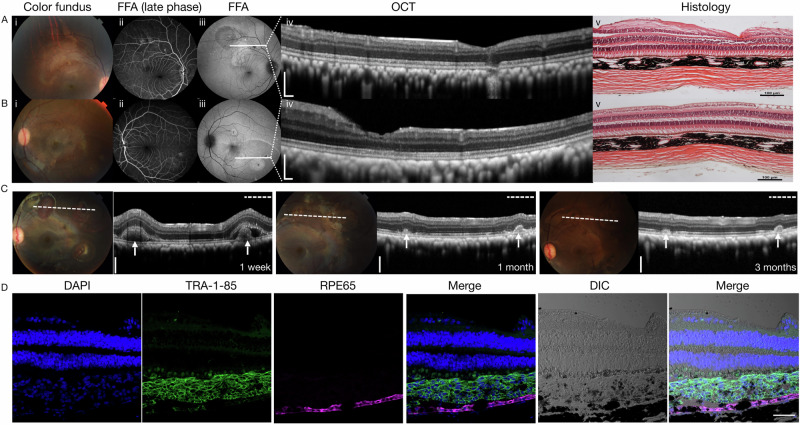
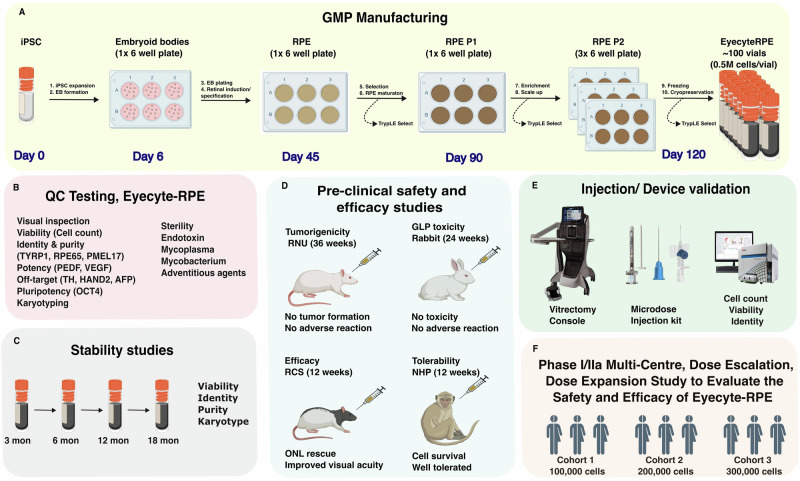
Cell replacement therapy is a promising therapeutic option for dry age-related macular degeneration (AMD). In this study, we outline our design for scalable manufacture with appropriate quality gates and present in vivo data for establishing preclinical safety and efficacy of an induced pluripotent stem cell (iPSC)-derived retinal pigment epithelium (RPE) product, thus laying the foundation for Phase 1/2a trial approval in India (ClinicalTrials.gov ID: NCT06394232; date of registration: 23rd September 2024). Escalating doses of RPE cell suspension in immunocompromised animals demonstrated absence of tumor formation up to 9 months post-injection. Good Laboratory Practices (GLP) toxicology and tolerability studies in rabbits and non-human primates (NHP) respectively showed no major adverse events. RPE transplanted into immune suppressed RCS rats showed integration, neuroprotection and rescue of visual function. In addition, we provide a detailed description of the modifications in GMP manufacturing protocol to create a final product with a unique composition and Chemistry, Manufacturing and Controls (CMC) studies performed during product development.


Conflict of interest statement

Competing interests: The authors declare no competing interests.

Figures

Fig. 1
Fig. 1. Differentiation of hiPSC to RPE using different protocols and their in-depth characterization.
A Comparison of the three protocols used over years of product development. B Representative images of RPE cultures showing different levels of pigmentation based on the protocol used. GMP protocol shows the highest level of pigmentation. C Comparison of markers involved in melanin production by FACS analysis demonstrating the purity of RPE cell population. Cells generated by GMP protocol have the highest percentage of TYRP1 and PMEL17 positive cells with 90 ± 5% cells expressing the markers. D Comparison of expression of RPE specific markers by qPCR analysis. 20–40 fold increase in expression of the markers is seen in GMP protocol. E Quantification of PEDF by ELISA in RPE cells generated using the three protocols. Secreted PEDF level is 100 times more in GMP protocol compared to research and GLP protocol cells. FN Characterization of RPE generated using GMP protocol. F Representative phase contrast images depicting the hexagonal morphology of RPE cells generated using GMP protocol. GJ Representative fluorescence microscopy images of markers specific to melanin production (PMEL17, TYRP1), RPE cells (CRALBP, RPE65), and primary cilia (acetyated tubulin). K PEDF and VEGF levels produced from basal and apical sides of polarized RPE cells. PEDF level is elevated in apical side and VEGF level is elevated in basal side. L Higher fold expression of RPE specific markers in GMP protocol, as analyzed by qPCR. M Scanning electron microscopy image showing cilia on RPE cells. N Transmission electron microscopy image showing the presence of cilia and abundance of stage III/IV melanosomes on the apical side. Scale bars indicate 100 μm, unless specified. p-value < 0.05 is considered statistically significant (* indicates p < 0.05; ** indicates p < 0.01; *** indicates p < 0.001; **** indicates p < 0.0001).
Fig. 2
Fig. 2. Molecular profiling of RPE cells.
AC Stability testing of RPE cells. A Viability assessment (PI staining) of RPE cells at different time points show that viability is >70% across time points. B Expression of RPE65 and TYRP1 markers ( > 70%) at different day points analyzed by FACS showing the stability of product after cryopreservation. C Karyotype analysis of Eyecyte-RPE (18 months post cryopreservation) showing 46XY and no cytogenetic abnormalities. D Principal component analysis (PCA) of RPE samples generated using GMP, GLP and Research protocols. E Volcano plots of differentially expressed RPE genes across different protocols. A significant number of genes are differentially regulated across batches. F Gene ontology analysis of up-regulated and down-regulated genes. Eye development genes are the most up-regulated and cell cycle genes are the most down-regulated. G RPE markers are clustered and plotted as heatmaps to visualize gene expression of early, committed and late stage markers between protocols. Research protocol has higher expression of early RPE markers while GMP protocol expresses most of the mature RPE markers. H Leading edge analysis results highlight differentially expressed gene sets that play a critical role in eye development and visual system development across all batches. A p-value < 0.05 is considered statistically significant.
Fig. 3
Fig. 3. Establishing purity of Eyecyte-RPE.
A Cell proliferation status examined through FACS analysis indicates proliferation is decreased w.r.t. increased pigmentation across batches. Results show low or negligible levels of Ki67 (<5%) and pHH3 (<3%) in GMP protocol. Cell count post staining for Ki67 and pHH3 markers w.r.t DAPI indicate similar results. B Heatmaps created for cell cycle and proliferation related genes showing lower expression in GMP protocol compared to research and GLP protocols. CE Gene expression of OCT4 across different protocols by qPCR ( < 0.01), and FACS analyses ( < 1%) indicate absence of undifferentiated pluripotent cells as an impurity in Eyecyte-RPE. RNA seq analysis confirms absence of expression of pluripotent genes across all batches. F-G qPCR and FACS analysis of OCT4 level in RPE cultures spiked with 1% and 10% iPSC (0 hr and 15 day). Absence of OCT4 points out that iPSCs did not survive in RPE cultures. H-I qPCR analyses of trilineage markers (TH, AFP, HAND2) in RPE cultures alone and when spiked with iPSC, demonstrate absence of non-RPE lineage (off-target) markers. J Heatmaps created to compare differentially expressed genes involved in EMT and neural lineage across the three protocols. Significant down-regulation is seen in GMP protocol compared to GLP and research protocols. Scale bars indicate 100 μm. A p-value < 0.05 is considered statistically significant. (* indicates p < 0.05; ** indicates p < 0.01; *** indicates p < 0.001; **** indicates p < 0.0001).
Fig. 4
Fig. 4. In vivo safety and tumorigenicity studies of RPE cells in the RNU rat model.
A Representative images of H&E staining of retinal cross-sections from RNU rats injected with iPSC to demonstrate tumor formation in 2 months (positive control). Formation of cell/tissue types representing ectoderm, endoderm, and mesoderm are evident. B Images of fundus, H&E staining, and corresponding HNM/DAPI staining of retinal cross-sections from RNU rats injected with Eyecyte-RPE generated using the different protocols (4 and 9 months post transplantation). Cells survived upto 9 months without any growth or tumor formation. Scale bars indicate 1000 μm and 100 μm respectively.
Fig. 5
Fig. 5. In vivo efficacy studies of RPE cells in RCS rat model.
A, B Representative fundus, H&E, and immunofluorescence images of retinal cross-sections from RCS rats transplanted with 50 k, 100 k and 150 k doses of Eyecyte-RPE and vehicle control demonstrate cell survival and engraftment (HNM/PMEL17) at P90 post transplantation. Surviving cells showed minimal proliferation (STEM121/Ki67) as evident from enlarged images. C ONL thickness, and cone counts data show ONL preservation. D Retinal cross-section from RCS rat post-transplantation stained with HNM, Cone Arrestin, and DAPI is a representative image of photoreceptor protection at P90. E Behavioral analysis by OKT at P60 and P90 indicated rescue of visual acuity as a result of RPE transplantation. Scale bars indicate 50 μm. A p-value < 0.05 is considered statistically significant. (* indicates p < 0.05; ** indicates p < 0.01; *** indicates p < 0.001; **** indicates p < 0.0001).
Fig. 6
Fig. 6. In vivo live imaging of NHPs implanted with RPE cell suspensions.
Cases #1-OD and #1-OS, color fundus pictures show clear view of the posterior chamber (Ai–Bi), and optically clear in the vitreous cavity. Optic disc and retinal vascular architecture appear normal (Aii–Bii). The white lines (Aiii–Biii) indicate the position at which SD-OCT images (Aiv–Biv) taken. ERM was observed on the retinal surface under H&E staining (Av–Bv). C Case #2-OS, the white arrows indicating the ‘cells lump’ at 1 week, 1 month and 3 months. The white doted lines indicate the position of OCT line scan. D Immunohistochemical analysis within injection sites of case #2-OS. Multi-layer transplanted cells were observed at all three locations (positive for Tra-1-85, negative for RPE65, with pigmentation) on top of the host RPE cells (negative for Tra-1-85, positive for RPE65). Scale bars indicate 200 μm in A(iv), B(iv) and (C); 100 μm in A(v) and B(v), 50 μm in (D).
Fig. 7
Fig. 7. Schematic representation of Eyecyte-RPE manufacturing and pre-clinical studies.
A Workflow of GMP grade manufacturing of Eyecyte-RPE. B List of QC tests done on Eyecyte-RPE product. C Stability studies performed at various time points. D Summary of pre-clinical safety and efficacy studies done in different animal models starting from rats to rabbits to NHP. E Validation of injection device for optimal delivery of Eyecyte-RPE in sub-retinal space. F Study design of the Phase 1/2a clinical trial of Eyecyte-RPE product submitted as IND application to the Indian regulatory authority. Created with BioRender.com.

References

    1. Ambati, J., Ambati, B. K., Yoo, S. H., Ianchulev, S. & Adamis, A. P. Age-related macular degeneration: etiology, pathogenesis, and therapeutic strategies. Surv. Ophthalmol.48, 257–293 (2003). - PubMed
    1. Chen, Y., Bedell, M. & Zhang, K. Age-related macular degeneration: genetic and environmental factors of disease. Mol. Interventions10, 271–281 (2010). - PMC - PubMed
    1. Bhutto, I. & Lutty, G. Understanding age-related macular degeneration (AMD): relationships between the photoreceptor/retinal pigment epithelium/Bruch’s membrane/choriocapillaris complex. Mol. Asp. Med.33, 295–317 (2012). - PMC - PubMed
    1. Bird, A. C., Phillips, R. L. & Hageman, G. S. Geographic Atrophy: a histopathological assessment. JAMA Ophthalmol.132, 338–345 (2014). - PMC - PubMed
    1. Kaiser, S. M., Arepalli, S. & Ehlers, J. P. <p>Current and future anti-VEGF agents for neovascular age-related macular degeneration</p>. J. Exp. Pharmacol.13, 905–912 (2021). - PMC - PubMed

Associated data

LinkOut - more resources