

Integrative analysis of signaling and metabolic pathways, immune infiltration patterns, and machine learning-based diagnostic model construction in major depressive disorder
- PMID: 40253457
- PMCID: PMC12009401
- DOI: 10.1038/s41598-025-97623-x
Integrative analysis of signaling and metabolic pathways, immune infiltration patterns, and machine learning-based diagnostic model construction in major depressive disorder
Abstract
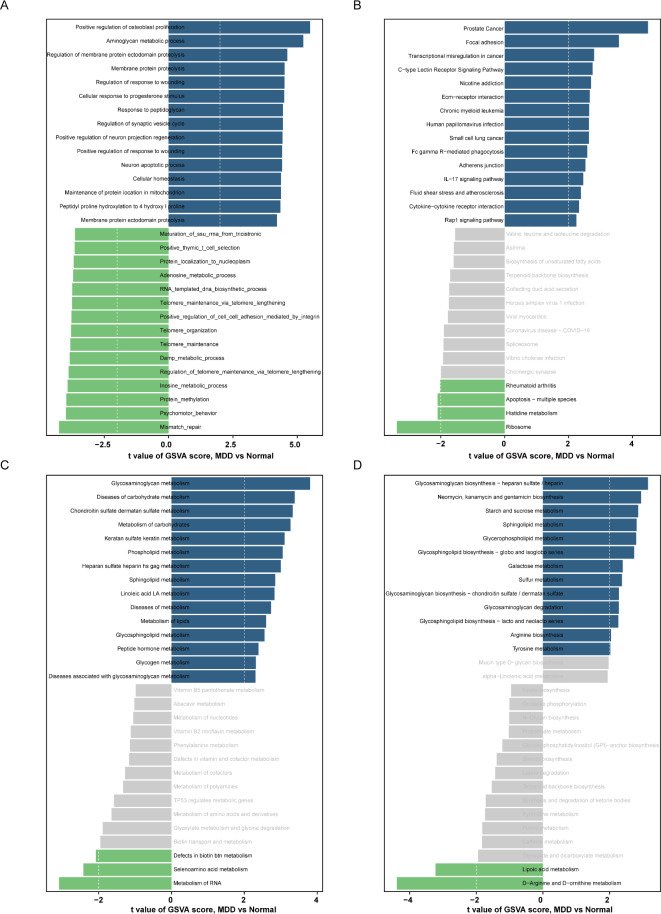
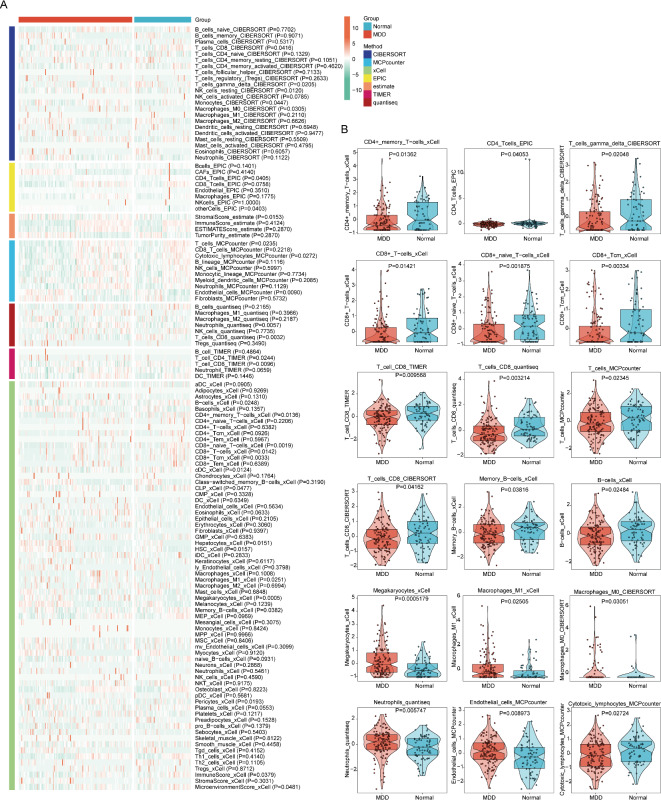
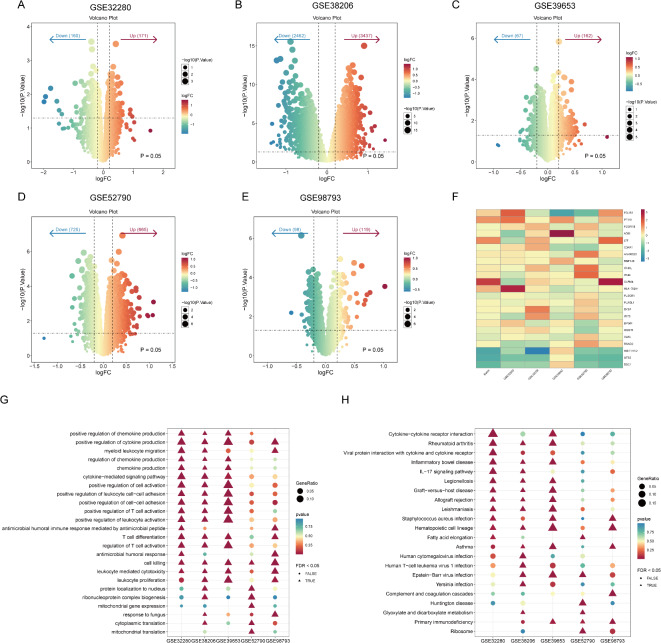
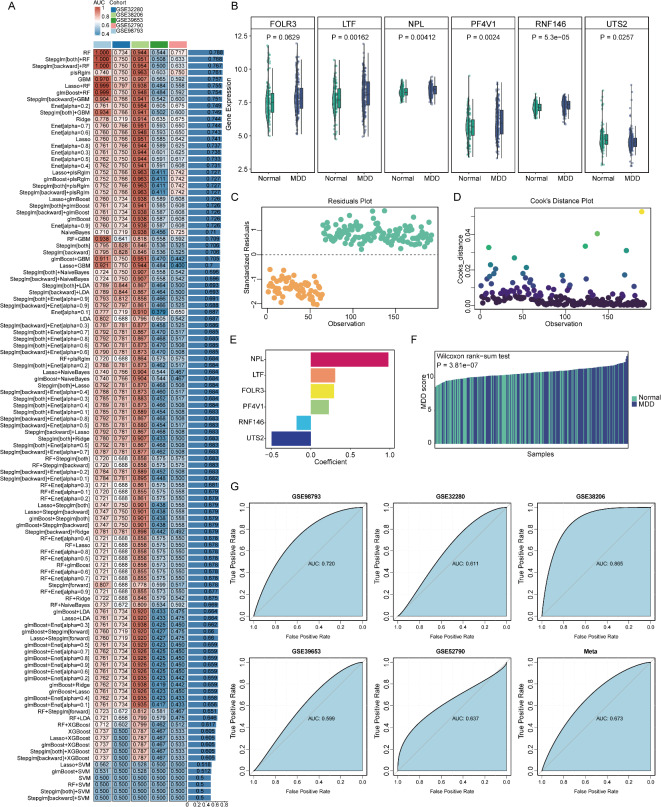
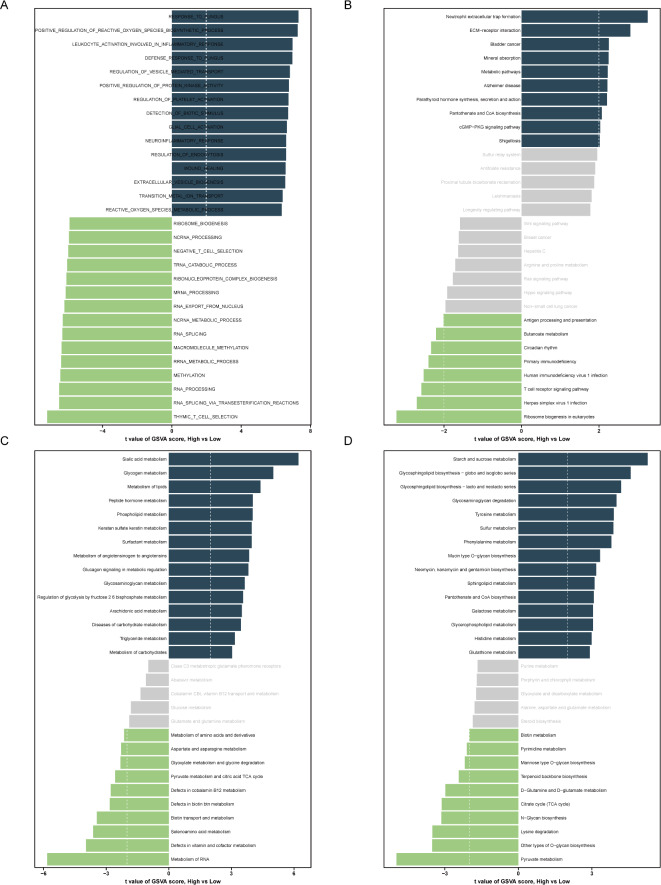
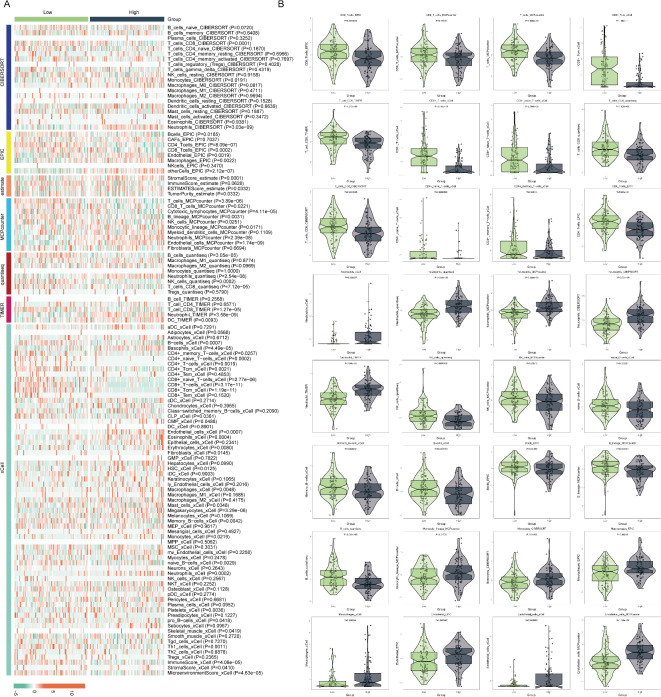
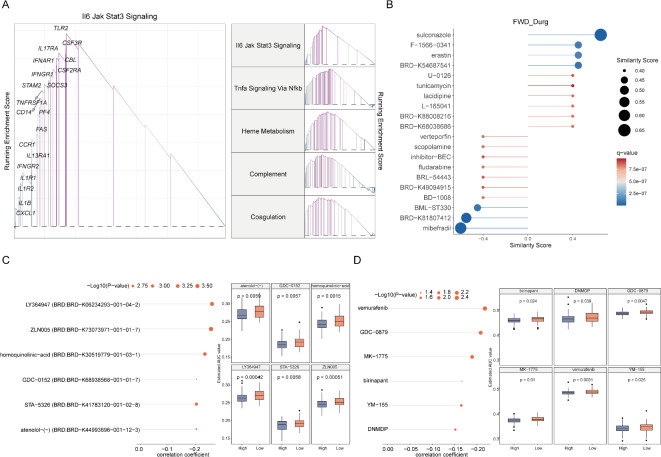
Major depressive disorder (MDD) is a multifactorial disorder involving genetic and environmental factors, with unclear pathogenesis. This study aims to explore the pathogenic pathway of MDD and its relationship with immune responses and to discover its potential targets by bioinformatics methods. We first applied gene set variation analysis (GSVA) and seven different immune infiltration algorithms to the GSE98793 dataset to determine the differences in signaling pathways, metabolic pathways, and immune cell infiltration between MDD patients and healthy controls. Differentially expressed genes between MDD patients and controls were obtained from five datasets (GSE98793, GSE32280, GSE38206, GSE39653, and GSE52790), and 113 machine learning methods were employed to construct MDD diagnostic models. Based on the constructed MDD diagnostic models, MDD patients were divided into high-risk and low-risk groups. GSVA and immune microenvironment analyses were conducted to investigate the differences between the two groups. Furthermore, potential drugs and therapeutic targets for the high-risk MDD group were explored to provide new insights and directions for the precise treatment of MDD. GSVA and immune infiltration results indicate that patients with MDD exhibit differences from normal individuals in various aspects, including biological processes, signaling pathways, metabolic processes, and immune cells. To investigate the functions and biological significance of differentially expressed genes in MDD patients, we performed GO and KEGG enrichment analyses on the differentially expressed genes from five databases (GSE98793, GSE32280, GSE38206, GSE39653, and GSE52790). By comparing the enrichment results across the five datasets, we found that the cell-killing signaling pathway was consistently present in the enriched signaling pathways of all datasets, suggesting that this pathway may play a crucial role in the pathogenesis of MDD. The random forest algorithm (AUC = 0.788) was selected as the optimal algorithm from 113 machine learning algorithms, leading to the development of a robust and predictive MDD algorithm, highlighting the important role of NPL in MDD. By dividing MDD into high and low-risk subgroups based on diagnostic model scores, enrichment pathways, and immunological results further demonstrated that high-risk MDD is associated with increased levels of reactive oxygen species, inflammation, and numbers of T cells and B cells. Through GSEA scoring, five upregulated pathways in the high-risk MDD group were identified, and multiple potential drugs such as Mibefradil, LY364947, ZLN005, STA- 5326, and vemurafenib were screened. Patients with MDD show differences in signaling pathways, metabolic pathways, and immune mechanisms. By constructing an MDD diagnostic model, we predicted the key genes of MDD and the characteristic pathways associated with a higher risk of MDD. This provides new insights for risk stratification identification and offers new perspectives for the clinical application of precision immunotherapy and drug development.
Keywords: Biomarker; Gene set variation analysis (GSVA); Immune infiltration; Machine learning; Major depression disorder (MDD).
© 2025. The Author(s).
Conflict of interest statement
Declarations. Competing interests: The authors declare no competing interests. Ethics & inclusion statement: This study was conducted in accordance with the principles set out in the Global Code of Conduct for Research in Resource-Poor Settings. All data used in this research were obtained from publicly available databases. We ensured that our research objectives aligned with local and global health priorities. In our analysis and interpretation of the data, we were mindful of potential biases and strived to avoid generalizations that could perpetuate stereotypes. We have made efforts to ensure that our findings are accessible to the scientific community and, where applicable, to stakeholders in resource-poor settings who may benefit from this research. All authors contributed to and approved the final manuscript, and we have appropriately acknowledged the contributions of all collaborators and data sources. We are committed to the fair and equitable sharing of benefits that may arise from this research.
Figures
Similar articles
-
Association of aging related genes and immune microenvironment with major depressive disorder.J Affect Disord. 2025 Jan 15;369:706-717. doi: 10.1016/j.jad.2024.10.053. Epub 2024 Oct 16. J Affect Disord. 2025. PMID: 39419187
-
An association study of clock genes with major depressive disorder.J Affect Disord. 2023 Nov 15;341:147-153. doi: 10.1016/j.jad.2023.08.113. Epub 2023 Aug 24. J Affect Disord. 2023. PMID: 37633529
-
Immune-related gene characterization and biological mechanisms in major depressive disorder revealed based on transcriptomics and network pharmacology.Front Psychiatry. 2024 Dec 6;15:1485957. doi: 10.3389/fpsyt.2024.1485957. eCollection 2024. Front Psychiatry. 2024. PMID: 39713769 Free PMC article.
-
Bioinformatics and machine learning approaches reveal key genes and underlying molecular mechanisms of atherosclerosis: A review.Medicine (Baltimore). 2024 Aug 2;103(31):e38744. doi: 10.1097/MD.0000000000038744. Medicine (Baltimore). 2024. PMID: 39093811 Free PMC article. Review.
-
Machine learning approaches for classifying major depressive disorder using biological and neuropsychological markers: A meta-analysis.Neurosci Biobehav Rev. 2025 Jul;174:106201. doi: 10.1016/j.neubiorev.2025.106201. Epub 2025 May 10. Neurosci Biobehav Rev. 2025. PMID: 40354957 Review.
References
-
- Dean, J. & Keshavan, M. The neurobiology of depression: an integrated view. Asian J. Psychiatry. 27, 101–111 (2017). - PubMed
-
- Su, Y., Ye, C., Xin, Q. & Si, T. Major depressive disorder with suicidal ideation or behavior in Chinese population: A scoping review of current evidence on disease assessment, burden, treatment and risk factors. J. Affect. Disord.340, 732–742 (2023). - PubMed
-
- Barnett, R. & Depression Lancet (London England)393(10186), 2113 (2019). - PubMed
-
- Malhi, G. S., Mann, J. J. & Depression Lancet (London England)392(10161), 2299–2312 (2018). - PubMed
-
- Lu, J. et al. Prevalence of depressive disorders and treatment in China: a cross-sectional epidemiological study. Lancet Psychiatry. 8 (11), 981–990 (2021). - PubMed
MeSH terms
Grants and funding
- SCU-HM-202307001/Opening Project of Functional and Molecular Imaging Key Laboratory of Sichuan Province
- 2024ZYD0272/Sichuan Provincial Science and Technology Support Program
- 2024NSFSC2017/Sichuan Provincial Science and Technology Support Program
- CBY24-QDA11/Natural Science Foundation of North Sichuan Medical College
LinkOut - more resources
Full Text Sources
