Analysis of preoperative serum cytokine levels in patients with oral squamous cell carcinoma
- PMID: 40253468
- PMCID: PMC12009433
- DOI: 10.1038/s41598-025-89816-1
Analysis of preoperative serum cytokine levels in patients with oral squamous cell carcinoma
Abstract
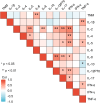
This study investigates preoperative serum cytokine levels in patients with oral squamous cell carcinoma (OSCC). The study included 51 patients with OSCC and 42 healthy controls (HCs). Serum samples of 12 cytokines were analyzed using a multiplex bead-based flow cytometry immunoassay. Mann-Whitney U test and binary logistic regression analysis were performed to identify significant indicators of OSCC. Receiver operating characteristic (ROC) curves evaluated the diagnostic performance.Spearman analysis was assessed the correlation between cytokines and tumor-node-metastasis staging of OSCC. Serum levels of interleukin (IL)-2, IL-5, IL-6, IL-8, IL-12P70, IL-17, and interferon gamma (IFN-γ) were significantly higher (P < 0.05) in patients with OSCC than in HCs. IL-5, IL-6, IL-8, IL-12P70, IL-17, IFN-γ, combination 1 (IL-6 and IL-8), and combination 2 (IL-6 and IL-12P70) had area under the curve (AUC) values > 0.7, with combination 2 exhibited the highest AUC of 0.995. Serum cytokine profiles were significantly different (P < 0.05) between the patients with OSCC and HCs. IL-5, IL-6, IL-8, IL-12P70, IL-17, IFN-γ, combination 1, and combination 2 effectively distinguished between HCs and patients with OSCC. Cytokine combinations enhanced OSCC diagnostic accuracy, with significantly elevated IL-6 levels (P < 0.05) in advanced-stage compared to early-stage OSCC, indicating its potential impact on disease progression and prognosis.
Keywords: Cytokines; Inflammatory; Oral squamous cell carcinoma; Serum.
© 2025. The Author(s).
Conflict of interest statement
Declarations. Competing interests: The authors declare no competing interests. Institutional review board statement: The study was conducted in accordance with the Declaration of Helsinki and approved by the Biomedical Ethics Committee of Peking University School and Hospital of Stomatology (Approval No. PKUSSIRB-202060212). Informed consent: Informed consent was obtained from all subjects involved in the study.
Figures


Similar articles
-
Evaluation of saliva and plasma cytokine biomarkers in patients with oral squamous cell carcinoma.Int J Oral Maxillofac Surg. 2018 Jun;47(6):699-707. doi: 10.1016/j.ijom.2017.09.016. Epub 2017 Nov 27. Int J Oral Maxillofac Surg. 2018. PMID: 29174861
-
Proinflammatory cytokines as serum biomarker in oral carcinoma-A prospective multi-biomarker approach.J Oral Pathol Med. 2018 Mar;47(3):268-274. doi: 10.1111/jop.12670. Epub 2018 Jan 22. J Oral Pathol Med. 2018. PMID: 29272054
-
The balance of serum IL-18/IL-37 levels is disrupted during the development of oral squamous cell carcinoma.Surg Oncol. 2020 Mar;32:99-107. doi: 10.1016/j.suronc.2019.12.001. Epub 2019 Dec 7. Surg Oncol. 2020. PMID: 31983439
-
Circulating Anti-Matrix Metalloproteinase-7 Antibodies May Be a Potential Biomarker for Oral Squamous Cell Carcinoma.J Oral Maxillofac Surg. 2016 Mar;74(3):650-7. doi: 10.1016/j.joms.2015.09.016. Epub 2015 Sep 26. J Oral Maxillofac Surg. 2016. PMID: 26454036
-
Role of selected salivary inflammatory cytokines in the diagnosis and prognosis of oral squamous cell carcinoma. A Systematic Review and Meta-analysis.Med Oral Patol Oral Cir Bucal. 2023 Sep 1;28(5):e474-e486. doi: 10.4317/medoral.25889. Med Oral Patol Oral Cir Bucal. 2023. PMID: 37099710 Free PMC article.
References
-
- Gholizadeh, P. et al. Role of oral microbiome on oral cancers, a review. Biomed. Pharmacother. 84, 552–558 (2016). - PubMed
-
- Sung, H. et al. Global cancer statistics 2020: GLOBOCAN estimates of incidence and mortality worldwide for 36 cancers in 185 countries. CA Cancer J. Clin.71, 209–249 (2021). - PubMed
MeSH terms
Substances
Grants and funding
LinkOut - more resources
Full Text Sources
Medical

