. 2025 Apr 19;16(1):3731.
doi: 10.1038/s41467-025-59088-4.

Structural characterization of antibody-responses following Zolgensma treatment for AAV capsid engineering to expand patient cohorts

Affiliations

Structural characterization of antibody-responses following Zolgensma treatment for AAV capsid engineering to expand patient cohorts

Mario Mietzsch et al. Nat Commun. .

Abstract

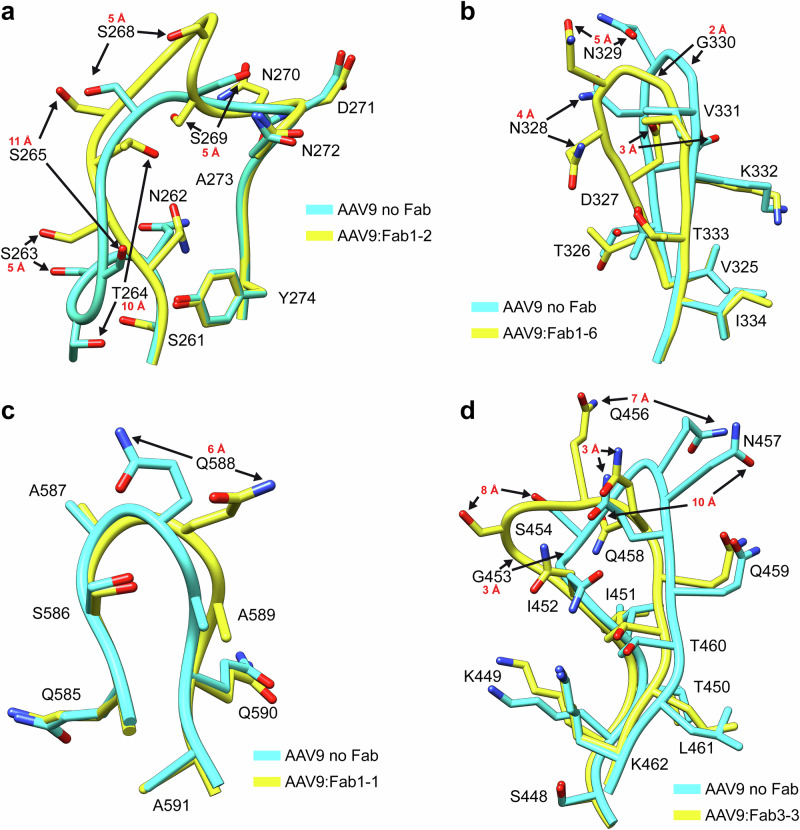
Monoclonal antibodies are useful tools to dissect the neutralizing antibody response against the adeno-associated virus (AAV) capsids that are used as gene therapy delivery vectors. The presence of pre-existing neutralizing antibodies in large portions of the human population poses a significant challenge for AAV-mediated gene therapy, primarily targeting the capsid leading to vector inactivation and loss of treatment efficacy. This study structurally characterizes the interactions of 21 human-derived neutralizing antibodies from three patients treated with the AAV9 vector, Zolgensma®, utilizing high-resolution cryo-electron microscopy. The antibodies bound to the 2-fold depression or the 3-fold protrusions do not conform to the icosahedral symmetry of the capsid, thus requiring localized reconstructions. These complex structures provide unprecedented details of the mAbs binding interfaces, with many antibodies inducing structural perturbations of the capsid upon binding. Key surface capsid amino acid residues were identified facilitating the design of capsid variants with antibody escape phenotypes. These AAV9 capsid variants have the potential to expand the patient cohort to include those that were previously excluded due to their pre-existing neutralizing antibodies against the wtAAV9 capsid, and the possibly of further treatment to those requiring redosing.


Conflict of interest statement

Competing interests: IAE and GJL are in advanced discussion with a biotechnology company regarding the commercial manufacture and distribution of the monoclonal antibodies (mAbs) described in this manuscript. These negotiations may result in financial compensation for IAE and GJL and their affiliated organizations. JTH is co-founder and CEO of Nanometria, a limited liability company. The University of Florida Research Foundation, Inc. has filed a patent application (PCT/US2024/015006 [ https://patents.google.com/patent/WO2024168153A2/en?oq=PCT%2fUS2024%2f015006 ]) on behalf of MM, JH, ARN, and RM based on the capsid variants described in this study. The remaining authors declare no competing interests.

Figures

Fig. 1
Fig. 1. Icosahedral reconstruction of the AAV9-Fab complexes.
a Surface density map of the cryo-reconstructed AAV9-Fab1-2 complex. The view is down the icosahedral 2-fold axis, the map is contoured at a sigma (σ) threshold level of 2.0. The map is colored according to radial distance from the particle center (blue to red), as indicated by the scale bar. The icosahedral 2-, 3-, and 5-fold axes are indicated. The estimated resolution, determined at an FSC threshold value of 0.143, is shown below the map. The binding of the Fab on top of the 2/5-fold wall is shown as a close-up image in the center panel, with the variable heavy (VH) and variable light (VL) chains labeled. To the right, a representative stretch of amino acid residues modeled for the heavy chain of the Fab are shown inside the cryo-EM density map. The amino acid residues are labeled and shown as stick representations and colored according to atom type: C = yellow, O = red, N = blue, S = green. b Depiction of the AAV9-Fab2-7 complex as in (a) with the Fab binding around the 5-fold symmetry axis. c Surface density map of the AAV9-Fab3-4 complex as in (a). The Fab binds to the center of the 3-fold symmetry axis. Due to the imposed symmetry during the reconstruction process the density of the Fab is blurred and cannot be used to generate an atomic model. The illustration on the right gives a rationale for the blurring of a non-icosahedral Fab (H: heavy chain [purple], L: light chain [pink]) bound to an icosahedral capsid during icosahedral averaging. d Depiction of the AAV9-Fab3-2 complex as in (c) with the Fab binding to the center of the 2-fold symmetry axis. The 3-fold protrusions are indicated by small black triangles. All density map images were generated using UCSF-Chimera.
Fig. 2
Fig. 2. Localized reconstruction of the AAV9-Fab complexes.
a Surface density map of the icosahedral-reconstructed AAV9-Fab2-1 complex. The map is colored according to radial distance from the particle center (blue to red), as indicated by the scale bar in Fig. 1. To the right, a density map of the 2-fold region is shown, derived from localized reconstruction with C2 symmetry relaxation. The variable/constant heavy (VH/CH) and variable/constant light (VL/CL) chains are labeled. A representative stretch of amino acid residues modeled for the heavy chain of the Fab is shown inside the localized reconstructed map. The amino acid residues are labeled and shown as stick representations and colored according to atom type: C =  yellow, O = red, N = blue, S = green. b Depiction of the AAV9-Fab1-1 and (c) Fab1-6 complex as in (a). For the localized reconstruction of the 3-fold region C3 symmetry relaxation and the 5-fold region C5 symmetry relaxation were applied, respectively. The maps are colored according to radial distance from the particle center (blue to red), as in Fig. 1. The icosahedral 2-, 3-, and 5-fold axes are indicated as ovals, triangles, and pentagons, respectively. The estimated resolution is shown below the map. The 3-fold protrusions and the positions of the VR-II loops around the 5-fold axis are indicated as black triangles and blue arrowheads, respectively.
Fig. 3
Fig. 3. Binding mode of the Fabs to the AAV9 capsid. Radial-colored surface representations of the AAV9 capsid are shown.
a For double-trimers with the 2-fold symmetry axis in the center, b for trimers with the 3-fold symmetry axis in the center, c for pentamers with the 5-fold symmetry axis in the center, and d for double-trimers as in (a). The surface representations are colored according to radial distance from the capsid’s center (blue to red), as indicated by the scale bar. The structures of the VH (purple) and VL (pink) chains of the Fabs are shown as ribbon diagrams. The 2-fold binding Fabs are classified into 4 groups (A, B, C, and D) based on their interaction with the AAV9 capsid. The Fabs belonging to the groups are listed below each surface representation.
Fig. 4
Fig. 4. Determination of the contacts of Fab2-1 to the AAV9 capsid.
a The fit of the AAV9 capsid (yellow) and Fab2-1 (purple) models inside the cryo-EM map is shown. For further detail, the modeled CDR1-3 of the b heavy chain and c light chain inside the cryo-EM map are displayed. d Exemplary interactions of the Fab to the AAV9 capsid are shown.
Fig. 5
Fig. 5. Contact frequency of the 2-fold (2f) binding Fabs to the AAV9 capsid.
a The percentages of contacted capsid residues within variable region (VR)-III, -IV, -V, (b) -VI, -VII, and (c) VR-IX are shown for all 2-fold binding Fabs. d An AAV9 capsid surface representation with the binding frequency for any 2-fold binding Fabs is displayed which is colored according to the bar on the right.
Fig. 6
Fig. 6. Fab induced structural rearrangement of the AAV9 capsid.
a Binding of Fab1-2 to the AAV9 capsid leads to an alternative conformation of VR-I. The conformation in the absence of the antibody (cyan) and in the presence of Fab1-2 (yellow) are shown as ribbon diagrams with amino acid side chains. The amino acid residues are labeled and shown as stick representations with oxygen colored red and nitrogen blue. Movements of ≥3 Å measured in Coot between the atoms of the same amino acids for the two models are indicated. b Depiction as in (A) for VR-II upon binding of Fab1-6, c VR-IV upon binding of Fab3-3, and d VR-VIII upon binding of Fab1-1.
Fig. 7
Fig. 7. Generation of an antibody escape variant.
a Schematic showing the amino acid substitutions of hAEV5 (blue) and hAEV6 (blue and orange). b Native dot blots are shown using mAb B1 as a loading control and the 21 human mAbs against the capsids of AAV9, hAEV5, and AAV5. The hAEV5 capsid variant escapes 17 of the 21 human antibodies, except for mAb1-1, 1-2, 1-6, and 2-7. c Transduction analysis of AAV2, AAV9, hAEV5, hAEV6-Q588R, and hAEV6-Q588Y vectors in HEK293 cells. The individual data points are indicated by a red circle. d Analysis of the transduction efficiency of the AAV vectors in absence (+PBS) and presence of 2 mg/ml heparin (+Hep). The efficiency is normalized to the transduction in absence of heparin. e Transduction of hAEV5 and hAEV6-Q588R is maintained in the presence of pooled mAb solutions, which contain equal amounts of the mAbs that the aa substitutions of the hAEV are targeted against (square data points) or equal amounts of all 21 mAbs (triangle data points). AAV9 vectors are analyzed in parallel. The x-axis represents the average molar ratio of mAbs added to the capsids. All experiments have been performed in biological triplicate to verify reproducibility (n = 3), and the data (ce) are presented as mean values ± standard deviation (SD). Statistical significance is calculated by a two-sided t-test for hAEV5 or hAEV6-Q588R compared to AAV9 at the same antibody condition. Asterisk indicates p < 0.01. f Sera from Zolgensma-treated infants (n = 6) were analyzed to determine the anti-AAV9, anti-hAEV5, and anti-hAEV6-Q588Y IgG endpoint titers. The individual patients (Pt) are represented by different shapes, and the average reduction of the endpoint titer from AAV9 to hAEV5 and hAEV6-Q588R is calculated. g Relative biodistribution compared to liver transduction of AAV9 and hAEV5 vectors in eight tissues following i.v. injection of 1.1 × 1014 vg/kg in C57BL/6 mice. Fully colored and open-colored circles represent male mice and female mice. The average of the data (n = 6 for AAV9 and n = 4 for hAEV5) is indicated by the horizontal line. Source data are provided as a Source Data file.

Update of

Similar articles

References

    1. Mendell, J. R. et al. Current clinical applications of in vivo gene therapy with AAVs. Mol. Ther.29, 464–488 (2021). - PMC - PubMed
    1. Rittié, L. et al. The landscape of early clinical gene therapies outside of oncology. Mol. Ther.27, 1706–1717 (2019). - PMC - PubMed
    1. Wang, D., Tai, P. W. L. & Gao, G. Adeno-associated virus vector as a platform for gene therapy delivery. Nat. Rev. Drug Discov.18, 358–378 (2019). - PMC - PubMed
    1. Keeler, A. M. & Flotte, T. R. Recombinant adeno-associated virus gene therapy in light of Luxturna (and Zolgensma and Glybera): where are we, and how did we get here? Annu. Rev. Virol.6, 601–621 (2019). - PMC - PubMed
    1. Keam, S. J. Eladocagene exuparvovec: first approval. Drugs82, 1427–1432 (2022). - PubMed

MeSH terms

LinkOut - more resources