. 2025 Apr 19;5(1):129.
doi: 10.1038/s43856-025-00847-1.

Drug and siRNA screens identify ROCK2 as a therapeutic target for ciliopathies

Affiliations

Drug and siRNA screens identify ROCK2 as a therapeutic target for ciliopathies

Claire E L Smith et al. Commun Med (Lond). .

Abstract

Background: Primary cilia mediate vertebrate development and growth factor signalling. Defects in primary cilia cause inherited developmental conditions termed ciliopathies. Ciliopathies often present with cystic kidney disease, a major cause of early renal failure. Currently, only one drug, Tolvaptan, is licensed to slow the decline of renal function for the ciliopathy polycystic kidney disease. Novel therapeutic interventions are needed.

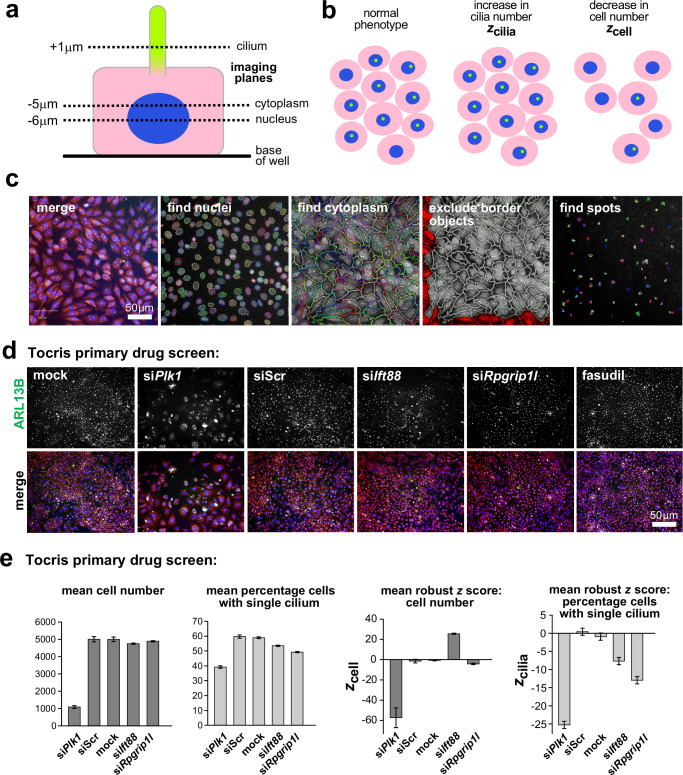
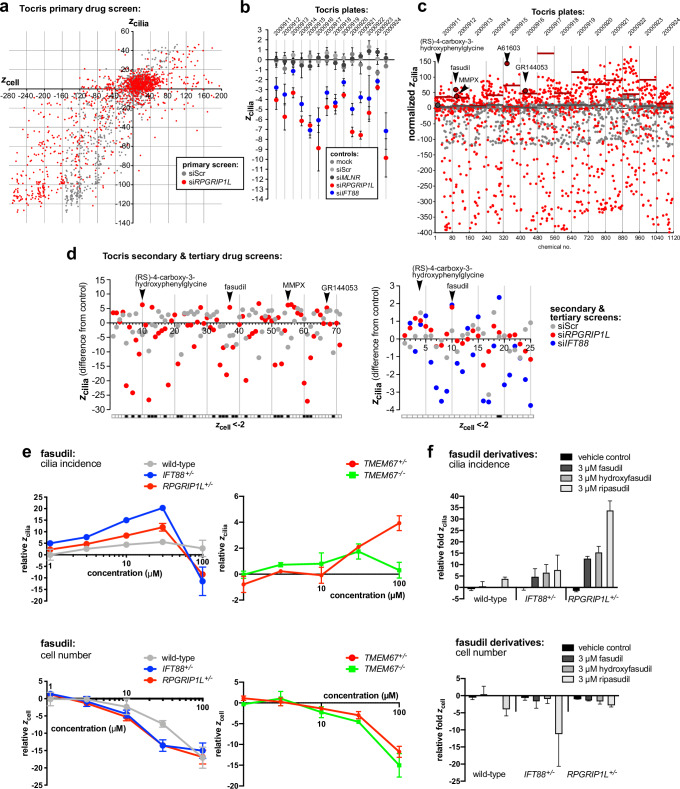
Methods: We screened clinical development compounds to identify those that reversed cilia loss due to siRNA knockdown. In parallel, we undertook a whole genome siRNA-based reverse genetics phenotypic screen to identify positive modulators of cilia formation.

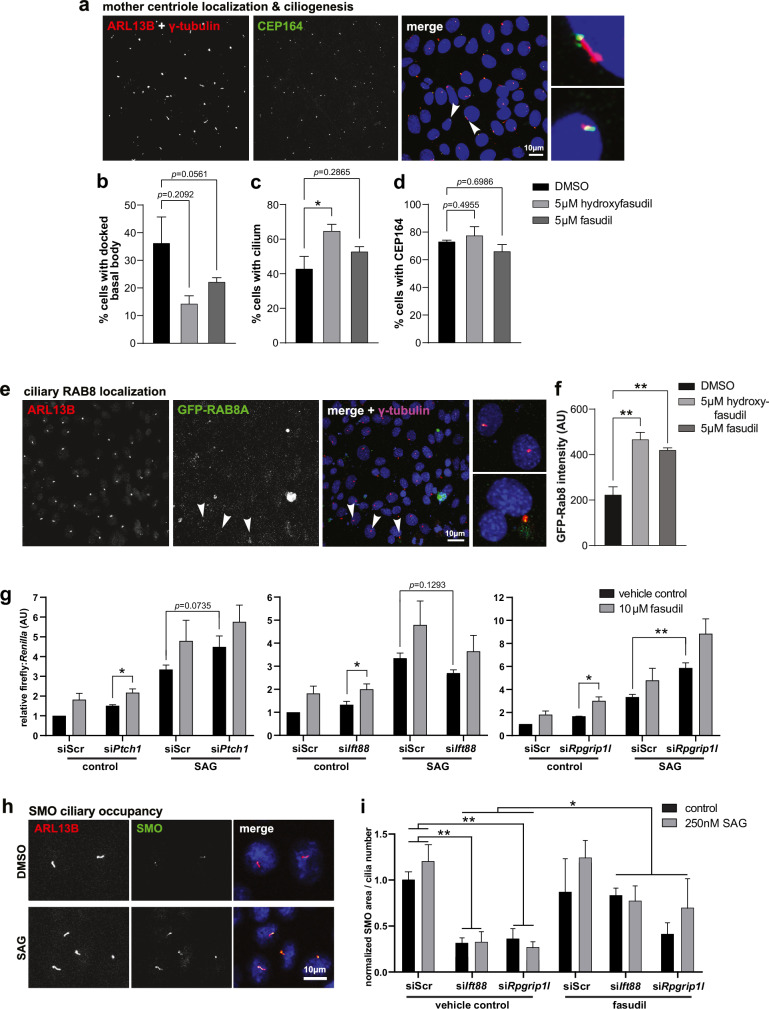
Results: Using a clinical development compound screen, we identify fasudil hydrochloride. Fasudil is a generic, off-patent drug that is a potent, broadly selective Rho-associated coiled-coil-containing protein kinase (ROCK) inhibitor. In parallel, the siRNA screen identifies ROCK2 and we demonstrate that ROCK2 is a key mediator of cilium formation and function through its possible effects on actin cytoskeleton remodelling.

Conclusions: Our results indicate that specific ROCK2 inhibitors (e.g. belumosudil) could be repurposed for cystic kidney disease treatment. We propose that ROCK2 inhibition represents a novel, disease-modifying therapeutic approach for heterogeneous ciliopathies.

Plain language summary

Primary cilia are antennae-like structures on cells that are important for early development and healthy cell function. Defects in primary cilia can cause inherited diseases called ciliopathies. Ciliopathies often cause fluid-filled sacs, called cysts, that are a major cause of kidney disease and failure. There is currently one drug licensed to slow kidney disease progression, but it is poorly tolerated in patients. Therefore, new drugs are needed. In this study, we used screening assays to identify potential drugs and their targets that are effective in promoting the formation of primary cilia. Our results identified ROCK2 (Rho-associated coiled-coil-containing protein kinase 2), an inhibitor of protein signalling, as a key mediator of cilium function. These findings suggest that drugs that specifically target ROCK2 could be a potential treatment option for cystic kidney disease.


Conflict of interest statement

Competing interests: The authors declare no competing interests.

Figures

Fig. 1
Fig. 1. High-content imaging protocol for high-throughput ciliogenesis screening.
a Schematic of a polarised mIMCD3 cell showing the focal planes used to image nuclei (blue), cytoplasm (pink) and ciliary axonemes (green). b Robust z scores were calculated to identify significant changes in cilia incidence (zcilia) or in cell number (zcell). c mIMCD3 cells imaged using an Operetta high-content imaging system. Merge images show staining for cilia marker ARL13B (green), nuclei (DAPI; blue) and cellular RNA (TOTO-3; pink). Representative images shown from Harmony/Columbus software of cell segregation and cilia recognition (“find spots”) protocols. Scale bar = 50 µm. d Representative immunofluorescence high-content images from the Tocris primary drug screen showing decrease of cilia incidence following reverse transfection with siRNA pool against Plk1 (a positive control for transfection since efficient transfection results in cell death), Ift88 and Rpgrip1l (positive controls targeting essential ciliary gene transcripts that abrogate ciliogenesis) compared to the non-targeting scrambled siRNA (siScr). Following knockdown with siRpgrip1l, cilia incidence was rescued with 10 µM fasudil, which was one of the top hits from the primary screen (see Fig. 2). Scale bar = 50 µm. e Left: bar graphs quantitate the effect on cell number and ciliogenesis (mean % cells with a single cilium) for positive controls (Plk1, Ift88 and Rpgrip1l siRNAs) and negative controls (siScr and mock transfections). Right: bar graphs showing mean robust z scores for cell number (zcell) and mean robust z score for cilia incidence (zcilia) for positive and negative siRNA controls. Error bars indicate s.e.m. for a total of n = 14 replicates (n = 2 passages, each comprising 2 technical replicates per plate and 2 knockdown conditions).
Fig. 2
Fig. 2. High-throughput screens of cilia incidence using the Tocriscreen Total library of active clinical development compounds and dose response for candidate hit fasudil and derivatives.
a Primary drug screen summarising mean zcell and zcilia values (n = 2 experimental replicates) for mouse mIMCD3 cells treated with each chemical and reverse transfected with either siRpgrip1l (red) or siScr (grey). b Summary of negative (grey) and positive (red & blue) control zcilia values for each Tocris plate. Error bars indicate s.e.m. for n = 2 experimental replicates, each with 4 technical replicates. All plates passed the quality control criteria of zcilia ≤ −2 for positive controls (siIft88 and siRpgrip1l) and −2 ≤ zcilia ≤ +2 for negative controls (mock, siScr, siMLNR). c Normalised zcilia values for cells treated with each chemical and reverse transfected with either siRpgrip1l (red) or siScr (grey). Tocris plate numbers are indicated along the x-axis. Normalised zcilia cut-off values (coloured bars) for each plate are indicated (coloured bars). Hits are defined as chemicals with normalised zcilia greater than cut-off values. Selected hits are indicated (n = 2 experimental replicates). d Left: secondary screen (n = 2 biological replicates in cells treated with siScr, one biological replicate in cells treated with siRpgrip1l) of 71 chemicals in mIMCD3 cells. Hits are defined as chemicals with zcilia difference from relevant control of ≥+2. Hits were excluded if zcell ≤ −2 (black filled squares in the grid). Right: tertiary screen (n = 2 biological replicates, with three experimental replicates for each knockdown condition) of 25 chemicals in human hTERT RPE-1 cells. Hits are defined as chemicals with zcilia difference from relevant control of ≥1.5. Hits were excluded if zcell ≤ −2 (black filled squares in the grid). e Dose response assays in ciliopathy crispant hTERT RPE-1 cells (wild-type parental line, heterozygous IFT88+/, RPGRIP1L+/ and TMEM67+/, and biallelic TMEM67/ knockout line) for concentration range of 1–100 µM fasudil. Graphs show mean robust z scores (n = 2 experimental replicates, each with n = 3 technical replicates) for cilia incidence (zcilia; upper panels) and cell number (zcell); lower panels. Values are normalised to vehicle control (DMSO) treated cells. Error bars represent the range. f Dose response assays in cells of the indicated genotype for 3 µM fasudil and derivatives hydroxyfasudil and ripasudil. Bar graphs show the fold-change in zcilia (top) and zcell (bottom) relative to vehicle control (n = 2 experimental replicates, each with n = 3 technical replicates). Error bars represent the range.
Fig. 3
Fig. 3. Inhibition of ROCK increases ciliary vesicle trafficking and restores ciliary-mediated Shh signalling.
a Representative mIMCD3 cells stained for primary cilia markers ARL13B and γ tubulin (left; both red), and CEP164 (middle; green) to show the subdistal appendages and mother centriole. Smaller panels (right) show magnified examples of cilia. Scale bar = 10 µm. b Bar graph quantifies the percentage of mIMCD3 cells with a basal body docked at the apical membrane but with no ciliary axoneme, as measured by staining of CEP164 but not ARL13B. One-way ANOVA with Dunnett’s multiple comparisons test: DMSO vs 5 µM hydroxyfasudil: ns p = 0.0561, DMSO vs 5 µM fasudil: ns p = 0.2092, both F = 3.947 df = 6. c Percentage of cells with a cilium stained for both ARL13B and γ tubulin. DMSO vs 5 µM hydroxyfasudil: *p = 0.0260, DMSO vs 5 µM fasudil: ns p = 0.2865, both F = 5.751, df = 6. d Percentage of cells positive for CEP164 foci. DMSO vs 5 µM hydroxyfasudil: ns p = 0.6986, F = 1.660, df = 6. DMSO vs 5 µM fasudil: ns p = 0.4955, F = 5.751, df = 2. e Representative mIMCD3 cells stained for ARL13B (red), γ tubulin (magenta) and expressing GFP-RAB8A (green). Smaller panels (right) show marker colocalisation, indicative of cilia vesicle trafficking during ciliogenesis in magnified images of cells indicated by arrowheads. Scale bar = 10 µm. f Mean intensity of ciliary GFP-RAB8A (>98 cilia per FOV). DMSO vs 5 µM hydroxyfasudil **p = 0.0029, DMSO vs 5 µM fasudil **p = 0.0083, F = 16.59, df = 6. For (cf), all assays performed with n = 3 biological replicates, 2 technical replicates, and error bars indicate s.e.m. g Bar graphs of dual (firefly & Renilla) luciferase Gli reporter assays showing the effects of siPtch1, siIft88 and siRpgrip1l knockdown compared to siScr in mouse Shh-Light II NIH3T3 cells. Cells were treated with 250 nM Smoothened agonist (SAG) and/or 10 µM hydroxyfasudil and compared with vehicle (DMSO) controls, with data normalised to controls transfected with siScr. SAG significantly increased the relative firefly:Renilla luciferase ratios following all knockdown treatments (not marked on the graph for reasons of clarity): siPtch1 (*p = 0.01132, t = 4.078) siIft88 (*p = 0.01830, t = 3.968) and siRpgrip1l knockdowns (**p = 0.007303, t = 4.156, all unpaired two-tailed Student’s t-test, n = 3 biological replicates, 3 technical replicates, 4 treatments, df = 4). In the presence of SAG, siIft88 decreased whereas siPtch1 increased Shh signalling (n.s. p = 0.07351, t = 3.442 and ns p = 0.12934, t = 3.085, respectively; n = 3 biological replicates, with 3 technical replicates, df = 4). Knockdown with siRpgrip1l in the presence of SAG significantly increased Shh signalling (**p = 0.007224, t = 4.158; n = 3, total of n = 6 technical replicates, df = 4), consistent with previous studies in the Rpgrip1l/ knockout mouse. ROCK inhibition significantly increased the luciferase ratio in two knockdown conditions when compared to the vehicle control, even without SAG stimulation (siPtch1 *p = 0.02834, t = 3.8472, siIft88 ns p = 0.07092, t = 3.4608, siRpgrip1l *p = 0.01843, t = 3.8425; n = 3, with 3 technical replicates, df = 4). Error bars represent s.e.m. h Representative mIMCD3 cells treated with SAG or vehicle control, stained for ARL13B (red) and Smoothened (SMO; green). SAG treatment increased SMO levels within cilia. Scale bar = 10 µm. i Normalised area of SMO localisation per cilium for mIMCD3 cells knocked down with siScr, siIft88 or siRpgrip1l. Knockdown with siIft88 or siRpgrip1l significantly reduced SMO localised to each cilium when treated with vehicle control (**p = 0.001333, t = 4.8533 and **p = 0.002788, t = 4.7277, respectively, unpaired two-tailed Student’s t-tests; n = 2 biological replicates, n = 2 technical replicates, 2 conditions, df = 2). Treatment with 10 µM fasudil increased ciliary SMO (*p = 0.01940, t = 4.4659; n = 2 biological replicates, 2 technical replicates, 4 conditions, df = 2). A minimum of 19 cilia were analysed per replicate. Error bars represent s.e.m.
Fig. 4
Fig. 4. Whole genome siRNA-reverse genetics screen of cilia incidence identifies ROCK2 as a negative modulator of ciliogenesis.
a Whole genome siRNA primary reverse genetics screen summarising mean zcilia values (n = 2) for mouse mIMCD3 cells; 8907 data points are outside of the y-axis limit of −2.0. Dark grey points indicate hits zcilia ≥ +2 (cut-off indicated by grey dashed line), and pink points indicate hits with no significant effect on cell number (−2 ≤ zcell ≤ +2). Red points indicate 83 hits taken forward for secondary screening that have human orthologues and siRNAs targeting all transcripts of the gene. b Secondary screen (n = 2 biological replicates) of 83 primary screen hits in mIMCD3 cells, validating 8/83 hits (red points) with mean zcilia ≥ +2. The top four hits are indicated with zcilia values as follows: Rock2 + 3.80, Stx19 + 3.46, Fancd2os + 2.83, Bcl10 + 2.49. c Bar graphs showing mean zcell (left) and zcilia (right) for positive controls (Plk1, Ift88 and Rpgrip1l siRNAs) and negative control siRNAs (siScr and mock transfections) for the secondary screen (n = 2 biological replicates, 3 plates each, with 2 technical replicates for siPlk1, siMks1, siRpgrip1l, siIft88, siMLNR, mock (transfection reagent only) and 4 technical replicates for siScr). d Representative high-content images from the primary screen for top hits (siRock2, siStx19, siFancd2os and siBcl10 knockdowns) showing an increase in cilia incidence compared to scrambled siRNA (siScr) negative control; siIft88 is included as a positive control for cilia loss. Merge images show staining for cilia marker acetylated α-tubulin (green), nuclei (DAPI; blue) and cellular RNA (TOTO-3; pink). Scale bar = 50 µm. Validation of siRNA knockdowns for murine (e) and human (f) ROCK2 as a top candidate hit in mIMCD3 and hTERT RPE-1 cells compared to scrambled siRNA (siScr) negative control. Bar graphs quantify western blot densitometry measures (n = 3) for each cell line, normalised against β-actin levels, error bars represent s.d. Statistical significance of pairwise comparisons are indicated (*p = 0.0111, t = 4.472 and **p = 0.0025, t = 6.737, respectively, both unpaired, two-tailed Student’s t-tests, n = 3 biological replicates, df = 4). g Left: hTERT RPE-1 cells, stained for cilia marker ARL13B (green) after knockdown with siROCK2, showing an increase in cilia length. Arrowheads indicate cilia displayed in magnified insets, shown with their measured lengths. Right: There was no significant difference in cilia incidence (n.s. p = 0.531, t = 0.6850; n = 3 biological replicates, df = 4). Mean cilium length after siScr treatment was 2.91 µm, compared to siROCK2 knockdown of 3.92 µm (n = 3 biological replicates, ≥40 cilia measured per replicate, specifically 121 and 132 cilia total for siScr and siROCK2 treated cells, respectively). ****p < 0.0001; t = 5.794, df = 251. Scale bar = 20 µm. h Left: hTERT RPE-1 cells transiently transfected with either untagged GFP or GFP-mRock2 constructs (green) and stained for ARL13B (red). Arrowheads indicate cells displayed in magnified insets. Right: cells transfected with GFP-mRock2 had a significantly lower cilia incidence (**p = 0.0049, t = 5.630; n = 3 biological replicates, df = 4) and shorter cilia (*p = 0.0120, Mann–Whitney U-test, n = 3 biological replicates (6 for untransfected) with a total of 188, 49 and 31 cilia measured for untransfected, GFP transfected (median length 2.362 µm) and GFP-mRock2 transfected (median 1.708 µm) cells, respectively, U = 506.5) compared to cells expressing untagged GFP. Scale bar = 20 µm.
Fig. 5
Fig. 5. ROCK2 inhibition disrupts acto-myosin contraction and increases ciliogenesis.
a Belumosudil treatment of hTERT RPE-1 cells for 48 h significantly increased cilia incidence across all concentrations (0.5–5 µM) ****p < 0.0001 for all comparisons (one-way ANOVA with Dunnett’s test for multiple corrections, n = 14 biological replicates, F = 14.49, df = 65) and had no effect on cilia length at lower concentrations, ns p > 0.9999 for both 0.5 µM and 1 µM belumosudil but increased cilia length for concentrations ≥2.5 µM compared to vehicle (DMSO) control, **p = 0.0087 and **0.0095, respectively for 2.5 µM and 5 µM belumosudil compared with DMSO vehicle control (Kruskal–Wallis test with Dunn’s multiple comparisons test, n = 3 biological replicates, ≥39 cilia measured per replicate, total cilia DMSO n = 212, 0.5 µM n = 280, 1 µM n = 271, 2.5 µM n = 167, 5 µM n = 119, Kruskal–Wallis statistic 20.12). The mean cilia length for the control treatment was 2.5 µm, compared to 2.9 µm and 3.0 µm at 2.5 µM and 5 µM belumosudil, respectively. b hTERT RPE-1 cells were transfected with GFP-tagged active mouse MLCII or constitutively inactive MLCIIAA constructs (green) and stained for ARL13B (red). Arrowheads indicate cells displayed in magnified insets. Cells that over-expressed active MLCII had a moderate but non-significant (ns) decrease in cilia incidence (ns p = 0.0866, t = 2.261, unpaired, two-tailed Student’s t-test, n = 3 biological replicates, df = 4), MLCIIAA expression significantly increased cilia incidence compared to untagged GFP control (*p = 0.0174, t = 3.908). There were no significant changes in cilia length when comparing transfection of GFP vs GFP-MLCII constructs (ns p = 0.8702, t = 0.1641, total cilia measured: control n = 97, GFP transfected n = 31, GFP-MLCII transfected n = 30, df = 59), nor when comparing GFP vs GFP-MLCIIAA (n.s. p = 0.6464, t = 0.4609, total cilia measured: GFP-MLCIIAA transfected n = 39, df = 68). c Belumosudil inhibits the kinase activity of ROCK2 and changes non-muscle myosin IIA organisation, visualised by MLCII staining and the presence of MLCII-associated acto-myosin structures in both hTERT RPE-1 (upper panels) and mIMCD3 (lower panels) cell lines. Cells were treated with increasing concentrations of belumosudil for either 2 h or 48 h (n = 3 for both time points). Antibodies marked MLCII, p-MLCII (monophosphorylated MLCII) and pp-MLCII (biphosphorylated MLCII at Thr18 & Ser19), with representative images shown with 2.5 µM belumosudil for 2 h treatments. p-MLCII and pp-MLCII visualise acto-myosin fibre-like structures in both hTERT RPE-1 (upper panels) and mIMCD3 (lower panels), visible in cells indicated by arrowheads and displayed in magnified insets. Automated high-content image analysis of image structure quantified both p-MLCII and pp-MLCII fibre-like structures, with bar graphs showing significant decreases in both hTERT RPE-1 (top) and mIMCD3 (bottom) cells when treated with 5 µM belumosudil for 48 h (For hTERT RPE cells: p-MLCII DMSO vs 5 µM belumosudil **p = 0.0087, pp-MLCII DMSO vs 5 µM belumosudil *p = 0.0127, both F = 6.607, df = 30. For mIMCD3 cells: MLCII DMSO vs 2.5 µM belumosudil ***p = 0.0003, DMSO vs 5 µM belumosudil **p = 0.0010, p-MLCII DMSO vs 2.5 µM belumosudil *p = 0.0280, DMSO vs 5 µM belumosudil **p = 0.0061, pp-MLCII DMSO vs 2.5 µM belumosudil *p = 0.0296, DMSO vs 5 µM belumosudil **p = 0.0077, all F = 14.56, df = 30, n = 3 biological replicates, two-way ANOVA with Dunnett’s multiple comparisons test). Scale bar = 50 µm.
Fig. 6
Fig. 6. Hydroxyfasudil and belumosudil rescue normal renal tubule sizes for kidney organoids modelling severe ciliopathy and for an in vivo early-onset model of polycystic kidney disease.
a Brightfield images of wild-type isogenic control (left) and RPGRIP1L/ mutant line 1 (right) kidney organoids at day 19 of differentiation. Arrowheads indicate cysts. Scale bar = 500 µm. The scatter graph shows the quantification of organoid area at day 19, based on automatic quantification of brightfield images. Triangles indicate the median values, error bars represent SD; unpaired two-tailed Student’s t-test n.s. p = 0.0771, t = 4.4248, df = 4, for n = 3 biological replicates, with 31, 32, 32 and 32, 32, 32 technical replicates, respectively (one set of technical replicates was for organoids grown from the same original well of stem cells). b Top: wild-type (left) and RPGRIP1L/ mutant line 1 kidney organoids (right) stained for LTL (proximal tubules; green), NPHS1 (nephron and podocytes; red) and CDH1 (distal tubules; magenta). Arrows indicate cysts. Scale bar = 200 µm. Bottom: kidney organoid sections stained for LTL (proximal tubules; green), ZO-1 (tight junctions; grey) and ezrin (apical cell surface; red). Scale bar = 50 µm. The inset indicates dimensions a and b used to calculate tubule area using the formula πab. c Scatter graph showing cyst number observed in day 23 drug treated wild-type (left) and RPGRIP1L/ mutant line 1 (right) kidney organoids. The mean number of cysts before drug treatment at day 19 was 0.0538 for isogenic wild-type control and 1.846 for RPGRIP1L/ mutants. Significantly fewer cysts in mutant RPGRIP1L/ organoids were observed for DMSO vs 5 µM hydroxyfasudil (HF; unpaired two-tailed Student’s t-test: *p = 0.01059, t = 5.0499, df = 33, n = 21 and 14 for respective groups) and DMSO vs 2.5 µM fasudil (F; *p = 0.03711, t = 4.1848, df = 34, n = 21 and 15 for respective groups). d Tubule areas (median values) in sections of day 23 wild-type and RPGRIP1L/ mutant line 1 kidney organoids following drug treatments. Error bars indicate SD. Unpaired two-tailed Student’s t-tests for wild-type RPGRIP1L+/+ organoids: DMSO vs 5 µM hydroxyfasudil (HF) **p = 0.00512, t = 6.1384, df = 175, n = 126, 51, respectively; DMSO vs 2.5 µM fasudil (F) not significant (n.s.) p = 0.0530, t = 4.2866, df = 174, n = 126, 50, respectively; DMSO vs 0.3 µM belumosudil (B) ***p = 0.000858, t = 5.2481, df = 223, n = 126, 109, respectively; DMSO vs 1 µM belumosudil **p = 0.00302, df = 229, t = 5.9188, n = 126, 105, respectively; DMSO vs 8-bromo-cAMP **p = 0.00849, t = 6.8629, df = 155, n = 126, 31, respectively. For RPGRIP1L/ mutant line 1: DMSO vs 5 µM hydroxyfasudil (H) ****p = 0.0000383, t = 8.3237, df = 509, n = 208, 303, respectively; DMSO vs 2.5 µM fasudil (F) ****p = 0.0000256, t = 8.3519, df = 429, n = 208, 223, respectively; DMSO vs 0.3 µM belumosudil (B) n.s. p = 0.269, t = 2.3125, df = 320, n = 208, 114, respectively; DMSO vs 1 µM belumosudil (B) *p = 0.0132, t = 5.1269, df = 327, n = 208, 121, respectively; DMSO vs 8-bromo-cAMP **p = 0.00592, t = 5.6543 df = 301, n = 208, 95, respectively. e The ROCK2 inhibitor belumosudil reduced cyst growth in a patient-derived PKD1 cystic cell line (OX161/c1) in 3D Matrigel cyst assays. Representative images of cysts after 12 days of treatment. The average cyst area was reduced at all concentrations tested (n = 3, n = 50, 44, 48, 48 cysts per treatment, respectively). Significance was determined by one-way ANOVA (Control vs DMSO: ns p = 0.9879, DMSO vs 1 µM belumosudil: ****p < 0.0001, DMSO vs 10 µM belumosudil: ****p < 0.0001, all df = 218, F = 71.71). f Left: kidney sections from Pax8rtTA-TetO-Cre-Pkd1fl/fl mice stained for LTL (proximal tubules; green), ZO-1 (tight junctions; red) and ezrin (apical cell surface; red) following drug treatments with vehicle or belumosudil at either 5 mg/kg/day or 10 mg/kg/day (representative images from an experiment with n = 5 animals for each treatment, n = 15 animals total). Scale bar = 50 µm. The inset indicates the tubule area, delimited by ezrin and ZO-1 staining for LTL+ tubules, used in calculations. Right: Violin plot of individual renal tubule area per kidney for 25 mg/kg/day drug treatment (n = 5 or 4 animals, as indicated (n = 9 animals total), with n = 620 and 422 tubules total, respectively), showing increase in tubule cytosol areas (unpaired two-tailed Student’s t-tests for tubules from vehicle vs 25 mg/kg/day belumosudil animal groups, ***p = 0.0002243. t = 8.4978, df = 1040).

References

    1. Malicki, J. J. & Johnson, C. A. The cilium: cellular antenna and central processing unit. Trends Cell. Biol.27, 126–140 (2017). - PMC - PubMed
    1. Reiter, J. F. & Leroux, M. R. Genes and molecular pathways underpinning ciliopathies. Nat. Rev. Mol. Cell Biol.18, 533–547 (2017). - PMC - PubMed
    1. Goetz, S. C. & Anderson, K. V. The primary cilium: a signalling centre during vertebrate development. Nat. Rev. Genet.11, 331–344 (2010). - PMC - PubMed
    1. Lancaster, M. A. & Gleeson, J. G. The primary cilium as a cellular signaling center: lessons from disease. Curr. Opin. Genet. Dev.19, 220–229 (2009). - PMC - PubMed
    1. Lu, Q. et al. Early steps in primary cilium assembly require EHD1/EHD3-dependent ciliary vesicle formation. Nat. Cell Biol.17, 228–240 (2015). - PMC - PubMed