. 2025 Apr 20;16(1):577.
doi: 10.1007/s12672-025-02266-z.

Machine learning-based prognostic modelling of NK cells in PAAD for immunotherapy guidance

Affiliations

Machine learning-based prognostic modelling of NK cells in PAAD for immunotherapy guidance

Li Li et al. Discov Oncol. .

Abstract

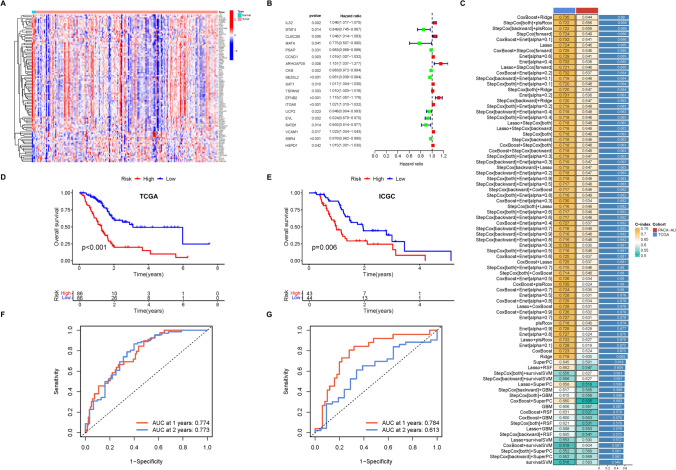
Pancreatic cancer's high incidence and mortality rates are underscored by ineffective treatments, particularly immunotherapy's poor performance. This could stem from an unclear immune microenvironment, where NK cells may play a unique role. Analyzing the NK cell-differentially expressed genes (NKDEGs) from the PAAD_GSE162708 single-cell dataset and utilizing the TCGA-PAAD and ICGC-PACA-AU datasets, we identified 11 NKDEGs linked to pancreatic adenocarcinoma (PAAD) prognosis and developed a prognostic model. This model's risk scores significantly outperformed traditional grading and TNM staging systems, validated through clinical and pathological analyses. Functional enrichment analysis pointed to the Neuroactive ligand-receptor interaction and MAPK signaling pathways, suggesting NK cells' distinctive role in PAAD. High-risk groups showed decreased overall NK cells but increased activated NK cells, which may mediate adverse inflammatory responses. NK cells exhibit synergistic interactions with plasma cells and macrophages and negative regulation by monocytes and naive B cells. Our model accurately predicts immunotherapy responses, indicating potential for targeted drugs to enhance treatment. Additionally, we introduced an NKDEGs-based immunotyping approach for personalized medicine and clinical decision-making in PAAD. This study emphasizes NK cells' potential in PAAD treatment, offering precise patient stratification and therapeutic targets for immunotherapy.

Keywords: Immunotherapy; Machine learning; Molecular subtype; NK cell; Pancreatic cancer; Prognostic model.


Conflict of interest statement

Declarations. Ethics approval and consent to participate : Not applicable. Consent for publication: Not applicable. Competing interests : The authors declare that the research was conducted in the absence of any commercial or financial relationships that could be construed as a potential conflict of interest.

Figures

Fig. 1
Fig. 1
NK cell-related immune microenvironmental crosstalk in PAAD. A A detailed flowchart outlines the process for identifying and validating the prognostic model associated with NKDEGs. B The cellular map depicts the distribution and abundance of different cell subgroups (B, CD8 T, Endothelial, Fibroblasts, Malignat, Mast, Mono/Macro, Myofibroblasts, NK cells) within PAAD. C The pie chart shows the precise counts of each cell subgroup (B, CD8 T, Endothelial, Fibroblasts, Malignat, Mast, Mono/Macro, Myofibroblasts, NK cells) in PAAD. D The bar graph illustrates the proportional distribution of each cell subgroup (B, CD8 T, Endothelial, Fibroblasts, Malignat, Mast, Mono/Macro, Myofibroblasts, NK cells) among individual PAAD patients. E The heatmap presents the HALLMARK gene sets regulated by each cell subgroup (B, CD8 T, Endothelial, Fibroblasts, Malignat, Mast, Mono/Macro, Myofibroblasts, NK cells). F The heatmap displays the KEGG gene sets regulated by each cell subgroup (B, CD8 T, Endothelial, Fibroblasts, Malignat, Mast, Mono/Macro, Myofibroblasts, NK cells). G The heatmap highlights key transcription factors that are differentially expressed across various cells within PAAD. H The dot plot reveals significantly expressed transcription factors in NK cells of PAAD, including KMT2 A, MED1, BRD4, ERGE2 F6, MAF, HEY1H2 AFZ, STAT1, and CDK9. I Using CellChat, the interaction probability between specific cell groups and other cell groups is visualized. J Using CellChat, the interaction probability between NK cells as donors and specific gene pairs in other cells is illustrated. K Using CellChat, the interaction probability between NK cells as recipients and specific gene pairs in other cells is depicted
Fig. 2
Fig. 2
Establishment of prognostic model of NKDEGs in PAAD. A The heatmap illustrates the expression levels of NKDEGs associated with PAAD prognosis in both PAAD samples and paired adjacent non-tumor samples. B The univariate Cox regression analysis highlights the NKDEGs related to PAAD prognosis. C The NKDEGs prognostic model was developed using 101 machine learning models (training set: TCGA, validation set: ICGC). D The survival curves for the TCGA cohort are shown based on risk scores derived from the NKDEGs prognostic model. Based on patient risk scores assessed by the model, the graphs indicate that the survival prognosis for the high-risk group (red line) is significantly worse than that for the low-risk (blue line). E The survival curves for the ICGC cohort are depicted based on risk scores derived from the NKDEGs prognostic model. Based on patient risk scores assessed by the model, the graphs indicate that the survival prognosis for the high-risk group (red line) is significantly worse than that for the low-risk (blue line). F The ROC curve for the NKDEGs prognostic model risk scores in the TCGA cohort is presented. G The ROC curve for the NKDEGs prognostic model risk scores in the ICGC cohort is shown
Fig. 3
Fig. 3
Clinical correlation analysis of NKDEGs prognostic model in PAAD. A Single-factor Cox regression analysis examines the relationship between individual variables(age, gender, tumor grade, cancer stage, and risk scores) and overall survival (OS) in PAAD patients. B Multi-factor Cox regression analysis assesses whether risk scores and other clinicopathological factors can serve as independent prognostic factors for PAAD. C The C-index curve compares the concordance index (C-index) of risk scores with other clinical variables (age, gender, tumor grade, and stage). Risk scores demonstrate the highest predictive power for PAAD prognosis over time. D The nomogram integrates age and risk scores to predict individual probabilities of 1-, 3-, and 5-year survival. E Displays the agreement between predicted and observed survival rates for 1, 3, and 5 years, validating the model’s predictive accuracy with a high C-index (0.708). F The heatmap visualizes the distribution of clinical (age, gender) and pathological (tumor grade, stage, T, M, N categories) features across low- and high-risk score groups. Notable clustering patterns emerge, showing differences in clinical characteristics based on risk levels. G The bubble plot highlights the proportions and correlations between risk score groups (high vs. low) and clinical variables such as age, gender, grade, and tumor-node-metastasis (TNM) classification. H Kaplan–Meier survival curve stratifies PAAD patients younger than 65 and older than 65, showing significantly worse OS in the high-risk group for both age categories (p < 0.001 and p = 0.006, respectively). I Kaplan–Meier survival curve separates patients by gender (male and female), demonstrating that high-risk patients consistently have poorer OS across both groups (p < 0.001 and p = 0.002). J Kaplan–Meier survival curve analyzes tumor grade (G1 - 2 vs. G3 - 4), with high-risk scores predicting worse OS in both categories (p < 0.001 and p = 0.036). K Kaplan–Meier survival curve examines tumor stage (Stage I–II vs. Stage III–IV), indicating that high-risk patients have worse OS, with significant differences in both early- and late-stage disease (p < 0.001 and p = 0.023). *p < 0.05, **p < 0.01, ***p < 0.001
Fig. 4
Fig. 4
Characteristics of NKDEGs prognostic model genes. A A comprehensive reanalysis of the single-cell dataset GSE162708 showcases the expression patterns of NKDEGs prognostic model genes in various cell clusters. B Survival analysis curves visually represent the significant influence of NKDEGs prognostic model genes on the outcomes for PAAD patients. C The gene correlation analysis reveals the interrelationships among the NKDEGs prognostic model genes. D Insights derived from the Genemania database analysis illustrate the functional regulation of NKDEGs prognostic model genes within the context of PAAD. *p < 0.05, **p < 0.01, ***p < 0.001
Fig. 5
Fig. 5
Functional enrichment analysis of different risk score groups. A The volcano plot displays the genes with differential expression across high and low risk patients. Genes highlighted in red have a fold change greater than 2 and an FDR less than 0.05, while those in green have a fold change less than − 2 and an FDR below 0.05. B The heatmap illustrates the expression levels of the top fifty differentially expressed genes among different risk score groups in PAAD samples. C The bubble plot highlights the pathways from the GO enrichment analysis, showing their proportions across different risk score groups. Key pathways include those involved in immune response regulation, extracellular matrix organization, and cellular metabolic processes. D The circular diagram provides a comprehensive view of GO enrichment analysis, categorizing pathways into three domains: Biological Processes (BP), Cellular Components (CC), and Molecular Functions (MF). Each section indicates the number of associated genes, with statistical significance (adjusted p values) represented by a color gradient. This visualization emphasizes the interconnected roles of pathways, including those involved in immune system processes, signal transduction, and tumor microenvironment remodeling. E The bubble plot summarizes the results of KEGG pathway enrichment analysis for different risk score groups. Notable pathways include the MAPK signaling pathway, neuroactive ligand-receptor interaction, and insulin secretion, which are closely linked to tumor growth, metastasis, and metabolic dysregulation in PAAD. F GSEA analysis identifies the key pathways enriched, including epithelial-mesenchymal transition (EMT) and immune-related processes in PAAD patients. G The box plot compares the tumor mutation burden (TMB) between high- and low-risk groups. High-risk patients exhibit a significantly elevated TMB (p = 0.033), suggesting that genetic instability correlates with higher risk scores. H Pearson correlation analysis reveals the relationship between risk scores and tumor mutation burden in PAAD patients. The positive correlation (R = 0.18, p = 0.007) indicates that higher risk scores are associated with increased TMB, suggesting a potential link between genetic mutations and risk stratification. I Analysis of somatic mutation data highlights the mutation rates of key genes in PAAD patients. The color-coded mutations (e.g., missense mutations, frameshift deletions) highlight the mutation frequencies, with high-risk patients exhibiting higher overall mutation rates. J The Kaplan–Meier survival curve evaluates the prognostic impact of TMB alone. Patients are divided into high- and low-TMB groups, with high TMB associated with worse overall survival (p = 0.009). K The Kaplan–Meier curve combines TMB and risk score groups to assess their joint impact on survival. Four subgroups are defined: TMB-high/risk-high, TMB-low/risk-high, TMB-high/risk-low, and TMB-low/risk-low. Patients in the TMB-high/risk-high group exhibit the poorest survival, while the TMB-low/risk-low group has the best prognosis (p < 0.001). *p < 0.05, **p < 0.01, ***p < 0.001
Fig. 6
Fig. 6
Assessment of the immune microenvironment in different risk score groups. A The violin plot illustrates the StromalScore, ImmuneScore, and ESTIMATE scores across different risk score groups. B The heatmap shows the distribution and proportions of immune cells across various risk score groups, as determined by the CIBERSORT algorithm. C The bubble plot reveals the correlation between risk scores and immune cell infiltration in PAAD samples. D The box plot displays the abundance of immune cells across different risk score groups, as calculated using the CIBERSORT algorithm. E The heatmap highlights the correlations between various immune cells and functions in PAAD. F The heatmap illustrates the regulatory interactions of NKDEGs prognostic model genes with different immune cells and functions in PAAD. G The box plot presents the expression levels of immune checkpoint genes across different risk score groups. H Survival analysis evaluates the response and efficacy of immune therapy across different risk score groups within the IMvigor210 immune therapy cohort. I The box plot shows the variation in risk scores among different immune therapy response cohorts. J The association between TCGA immune subtypes and NKDEGs prognostic subtypes is examined. *p < 0.05, **p < 0.01, ***p < 0.001
Fig. 7
Fig. 7
Novel molecular subtyping for identification of PAAD based on NKDEGs. A Delta area curves for varying numbers of classifications. B Cumulative Distribution Function (CDF) curves for different classification numbers, where each curve represents the model stability at different K values. C The heatmap displays the distribution of PAAD patients across different K values. D The consistency clustering plot shows the clustering results when K equals 4. E Survival curves illustrate the prognosis of PAAD patients with different molecular subtypes. F The Sankey diagram illustrates the correspondence between different molecular subtypes of PAAD patients and various risk score groups. G PCA analysis reveals the distribution of samples across different PAAD molecular subtypes. H t-SNE analysis shows the distribution of samples across different PAAD molecular subtypes. I The box plot demonstrates the ESTIMATE score, StromalScore, ImmuneScore, and tumor purity across different PAAD molecular subtypes. J The heatmap displays immune cell infiltration status across different PAAD molecular subtypes, based on various algorithms. K The box plot shows the expression levels of immune checkpoint genes across different PAAD molecular subtypes. *p < 0.05, **p < 0.01, ***p < 0.001

Similar articles

References

    1. Kolbeinsson HM, et al. Pancreatic cancer: a review of current treatment and novel therapies. J Invest Surg. 2023;36(1):2129884. - PubMed
    1. Rahib L, et al. Projecting cancer incidence and deaths to 2030: the unexpected burden of thyroid, liver, and pancreas cancers in the United States. Cancer Res. 2014;74(11):2913–21. - PubMed
    1. Conroy T, et al. FOLFIRINOX or gemcitabine as adjuvant therapy for pancreatic cancer. N Engl J Med. 2018;379(25):2395–406. - PubMed
    1. Mukherji R, et al. The role of immunotherapy in pancreatic cancer. Curr Oncol. 2022;29(10):6864–92. - PMC - PubMed
    1. Bear AS, Vonderheide RH, O’Hara MH. Challenges and opportunities for pancreatic cancer immunotherapy. Cancer Cell. 2020;38(6):788–802. - PMC - PubMed

LinkOut - more resources