

What can we learn from 68 000 clinical frailty scale scores? Evaluating the utility of frailty assessment in emergency departments
- PMID: 40253684
- PMCID: PMC12009543
- DOI: 10.1093/ageing/afaf093
What can we learn from 68 000 clinical frailty scale scores? Evaluating the utility of frailty assessment in emergency departments
Abstract
Background: Emergency departments (EDs) in England are under significant strain, with increasing attendances and extended wait times, affecting frail older adults. The clinical frailty scale (CFS) has been implemented as a tool to assess frailty in ED settings, but its reliability and predictive accuracy as a screening tool remain debated.
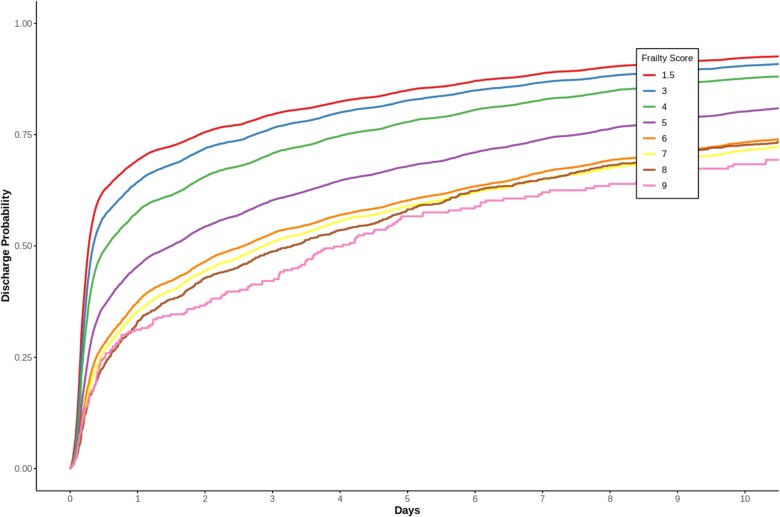
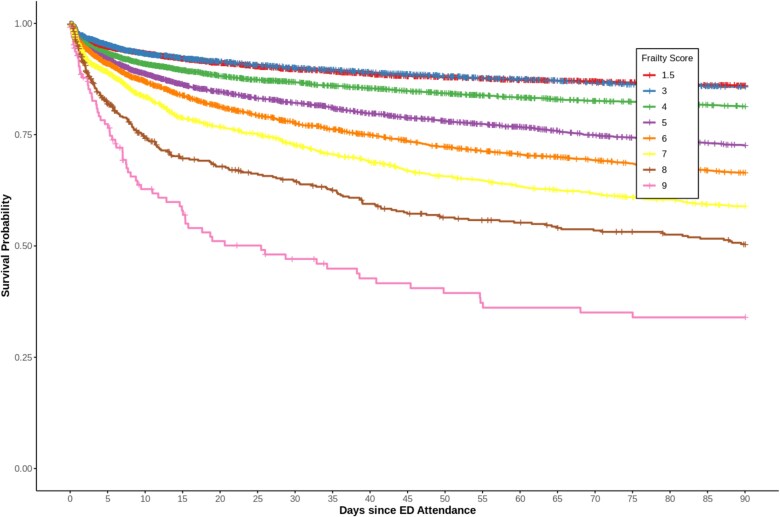
Objective: To evaluate the use and variability of the CFS in EDs and its association with patient outcomes, including discharge rates, length of stay, readmission and mortality.
Methods: A retrospective cohort study of ED attendances at two London (UK) hospitals from 2017 to 2021. Data included CFS scores, demographics, clinical observations and outcomes. Comparative statistics, logistic regression, Cox proportional hazards models and competing risk regression were applied to examine CFS predictive validity.
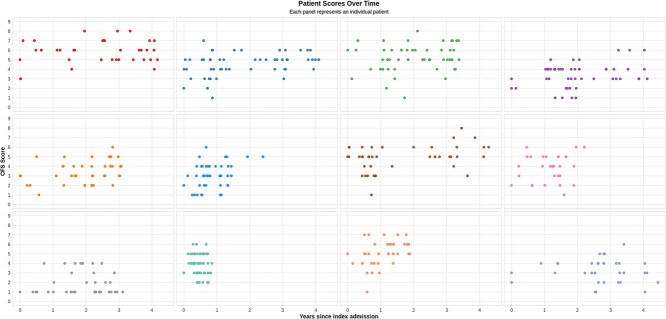
Results: In a sample of 123 324 ED visits, CFS scores strongly correlated with adverse outcomes: e.g. for long-term mortality (n = 33 475, events = 8871), each CFS single-point increase was associated with a 25% increase in mortality risk (95% CI 1.23-1.26). CFS scores varied significantly between raters and across visits, median difference two levels (interquartile range 1-3). Intraclass correlation coefficient analysis showed that 33.1% of CFS score differences was attributable to between-patient differences, 15.4% to inter-rater differences, with 51.5% residual variance from non-frailty factors, such as acute illness severity.
Conclusion: The CFS is associated with crucial patient outcomes in the ED. Inter-rater variability and potentially confounding factors can limit its consistency. Automation to enhance CFS score reliability should be explored as a means to support proactive management.
Keywords: clinical frailty scale (CFS); electronic health records (EHRs); emergency department (ED); frailty assessment; older people.
© The Author(s) 2025. Published by Oxford University Press on behalf of the British Geriatrics Society.
Conflict of interest statement
H.L.E. is supported by a Dalhousie Department of Medicine Research Fellowship and KCL Centre for Doctoral Studies PhD stipend. His PhD research focuses on developing data-driven measures of health status including frailty, which could potentially compete with or complement existing frailty measurement tools.
Dr. Rockwood reports grants from Nova Scotia Health Research Fund, during the conduct of the study; personal fees from Ardea Outcomes, the Chinese Medical Association, Wake Forest University Medical School Centre, the University of Nebraska—Omaha, the Australia New Zealand Society of Geriatric Medicine, the Atria Institute, Fraser Health Authority, McMaster University and EpiPharma Inc., outside the submitted work. In addition, Dr. Rockwood has licenced the Clinical Frailty Scale (CFS) to Enanta Pharmaceuticals, Inc., Synairgen Research Ltd, Faraday Pharmaceuticals, Inc., KCR S.A., Icosavax, Inc., BioAge Labs Inc., Biotest AG, Qu Biologics Inc., AstraZeneca UK Ltd., Cellcolabs AB, Pfizer Inc., W.L. Gore Associates Inc., pending to Cook Research Incorporated and Rebibus Therapeutics Inc.; has licenced the Pictorial Fit-Frail Scale (PFFS) to Congenica; and as part of Ardea Outcomes Inc., has a pending patent for Electronic Goal Attainment Scaling. Use of both the CFS and PFFS is free for education, research and non-profit health care with completion of a permission agreement stipulating users will not change, charge for or commercialise the scales. For-profit entities (including pharma) pay a licencing fee, 15% of which is retained by the Dalhousie University Office of Commercialization and Innovation Engagement. The remainder of the licence fees are donated to the Dalhousie Medical Research Foundation and the QEII Health Sciences Centre Research Foundation. In addition to academic and hospital appointments, K.R. is co-founder of Ardea Outcomes (DGI Clinical until 2021), which in the past 3 years has had contracts with pharma and device manufacturers (INmune, Novartis, Takeda) on individualised outcome measurement.
J.T.T. has received research grant funding from National Institutes for Health Research (NIHR), Health Data Research UK (HDR), Innovate UK, Office of Life Sciences, Epilepsy Research Institute, British Heart Foundation, Responsible AI Adoption Unit, OneLondon Secure Data Environment, Kings Health Partners and Engineering & Physical Sciences Research Council (ESPRC). J.T.T. has also received research equipment support from Nvidia, Elastic and Scan Computing. J.T.T. is director and shareholder of CogStack Ltd. None of the funders had any controlling say on the project.
Figures
Similar articles
-
Clinical Frailty Scale score is a predictor of short-, mid- and long-term mortality in critically ill older adults (≥ 70 years) admitted to the emergency department: an observational study.BMC Geriatr. 2024 Oct 21;24(1):852. doi: 10.1186/s12877-024-05463-7. BMC Geriatr. 2024. PMID: 39434029 Free PMC article.
-
Inter-rater reliability of the Clinical Frailty Scale by staff members in a Swedish emergency department setting.Acad Emerg Med. 2022 Dec;29(12):1431-1437. doi: 10.1111/acem.14603. Epub 2022 Oct 19. Acad Emerg Med. 2022. PMID: 36200372 Free PMC article.
-
Frailty is associated with 30-day mortality: a multicentre study of Swedish emergency departments.Emerg Med J. 2024 Aug 21;41(9):514-519. doi: 10.1136/emermed-2023-213444. Emerg Med J. 2024. PMID: 39053972 Free PMC article.
-
Frailty assessment in emergency medicine using the Clinical Frailty Scale: a scoping review.Intern Emerg Med. 2022 Nov;17(8):2407-2418. doi: 10.1007/s11739-022-03042-5. Epub 2022 Jul 21. Intern Emerg Med. 2022. PMID: 35864373 Free PMC article.
-
A scoping review of the Clinical Frailty Scale.BMC Geriatr. 2020 Oct 7;20(1):393. doi: 10.1186/s12877-020-01801-7. BMC Geriatr. 2020. PMID: 33028215 Free PMC article.
Cited by
-
Can laboratory test-based frailty indices contribute to frailty screening in emergency departments?Age Ageing. 2025 Jul 1;54(7):afaf192. doi: 10.1093/ageing/afaf192. Age Ageing. 2025. PMID: 40665734 Free PMC article.
References
-
- Statistics A&E Attendances and Emergency Admissions. https://www.england.nhs.uk/statistics/statistical-work-areas/ae-waiting-....
-
- Conroy S, Dowsing T. The ability of frailty to predict outcomes in older people attending an acute medical unit. Acute Med. 2013;12:74–6. - PubMed
Publication types
MeSH terms
LinkOut - more resources
Full Text Sources
