. 2025 May 27;44(5):115596.
doi: 10.1016/j.celrep.2025.115596. Epub 2025 Apr 19.

Combined inhibition of de novo glutathione and nucleotide biosynthesis is synthetically lethal in glioblastoma

Affiliations

Combined inhibition of de novo glutathione and nucleotide biosynthesis is synthetically lethal in glioblastoma

Suresh Udutha et al. Cell Rep. .

Abstract

Understanding the mechanisms by which oncogenic events alter metabolism will help identify metabolic weaknesses that can be targeted for therapy. Telomerase reverse transcriptase (TERT) is essential for telomere maintenance in most cancers. Here, we show that TERT acts via the transcription factor forkhead box O1 (FOXO1) to upregulate glutamate-cysteine ligase (GCLC), the rate-limiting enzyme for de novo biosynthesis of glutathione (GSH, reduced) in multiple cancer models, including glioblastoma (GBM). Genetic ablation of GCLC or pharmacological inhibition using buthionine sulfoximine (BSO) reduces GSH synthesis from [U-13C]-glutamine in GBMs. However, GCLC inhibition drives de novo pyrimidine nucleotide biosynthesis by upregulating the glutamine-utilizing enzymes glutaminase (GLS) and carbamoyl-phosphate synthetase 2, aspartate transcarbamoylase, and dihydroorotatase (CAD) in an MYC-driven manner. Combining BSO with the glutamine antagonist JHU-083 is synthetically lethal in vitro and in vivo and significantly extends the survival of mice bearing intracranial GBM xenografts. Collectively, our studies advance our understanding of oncogene-induced metabolic vulnerabilities in GBMs.

Keywords: CP: Cancer; CP: Metabolism; TERT; brain tumors; cancer; glioblastoma; glutamine metabolism; glutathione; in vivo stable isotope tracing; metabolic synthetic lethality; metabolomics; nucleotide biosynthesis; telomerase reverse transcriptase.


Conflict of interest statement

Declaration of interests T.G.G. has consulting and equity agreements with Auron Therapeutics, Boundless Bio, Coherus BioSciences, and Trethera Corporation.

Figures
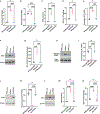
Figure 1.
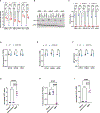
Figure 1.. TERT acts via FOXO1 to upregulate GCLC in isogenic models
(A–E) TERT mRNA (A), ATRX mRNA (B), GSH pool size (C), percentage of 13C labeling of GSH from [U-13C]-glutamine (D), and GCLC mRNA (E) in NHACONTROL, NHATERT, and NHAATRX-KO cells. (F) Western blots for GCLC in NHACONTROL, NHATERT, and NHAATRX-KO cells. β-actin was used as the loading control. (G) GCL activity in NHACONTROL, NHATERT, and NHAATRX-KO cells. (H) Western blots for phosphorylated and total FOXO1 in NHACONTROL, NHATERT, and NHAATRX-KO cells. (I) FOXO1 binding to the GCLC promoter as measured by ChIP-qPCR in NHACONTROL, NHATERT, and NHAATRX-KO cells. (J) Western blots for the FLAG tag in NHACONTROL, NHATERT, and NHATERT cells expressing a FLAG-tagged constitutively active form of FOXO1 (CA-FOXO1). β-actin was used as the loading control. (K) FOXO1 binding to the GCLC promoter measured by ChIP-qPCR in NHACONTROL, NHATERT, and NHATERT cells expressing CA-FOXO1. (L–N) GCLC protein expression (L), GSH pool size (M), and percentage of 13C labeling of GSH from [U-13C]-glutamine (N) in NHACONTROL, NHATERT, and NHATERT cells expressing a FLAG-tagged CA-FOXO1. Data are presented as mean ± standard deviation. **p < 0.01, ***p < 0.001, and ****p < 0.0001; ns indicates lack of statistical significance. See also Figure S1.
Figure 2.
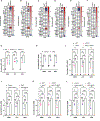
Figure 2.. TERT upregulates GCLC in patient-derived models and patient biopsies
(A–C) FOXO1 binding to the GCLC promoter (A), GCLC protein expression (B), and GSH pool size (C) in GBM6, U251, SB28, SF10417, A375, and HepG2 cells transfected with non-targeting control small interfering RNA (siRNA; siNT) or two non-overlapping siRNA sequences against TERT (siTERT-1 and siTERT-2). (D–F) FOXO1 binding to the GCLC promoter (D), GCLC mRNA (E), and GSH pool size (F) in BT142, KNS42, and U2OS cells transfected with an empty vector or with a plasmid expressing ATRX. (G–I) TERT mRNA (G), FOXO1 binding to the GCLC promoter (H), and GCLC mRNA (I) in GBM, astrocytoma, or gliosis biopsies. Data are presented as mean ± standard deviation. **p < 0.01, ***p < 0.001, and ****p < 0.0001; ns indicates lack of statistical significance.
Figure 3.
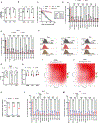
Figure 3.. Targeting GCLC depletes GSH, induces oxidative DNA damage, and inhibits the viability of TERT-dependent cancer cells
(A and B) Effect of GCLC silencing (A) or BSO (B) on GSH pool size in tumor cells. (C and D) Effect of GCLC silencing (C) or BSO (D) on levels of ROS in tumor cells. (E) Effect of GCLC silencing on live cell viability in the GBM6, U251, SB28, SF10417, A375, and HepG2 models. (F) Dose-response curves for BSO in the GBM6, U251, SB28, SF10417, A375, and HepG2 models. ReN human neural stem cells or primary human astrocytes were used as controls. Cells were treated with the indicated concentrations of BSO and IC50 measured via the percentage of inhibition of viability using the RealTime-Glo assay. (G) Left: representative flow cytometric histograms of live GBM6 cells stained with Vybrant DyeCycle green showing DNA content distribution. Cells were transfected with non-targeted control siRNA (siNT) or siRNA against GCLC (siGCLC-1). siGCLC-1-transfected cells were incubated with GSH ethyl ester to rescue the effect of GCLC silencing (rescue). Right: quantification of the percentage of cells in the G1, S, and G2/M phases in siNT, siGCLC-1, and rescue GBM6 cells. (H) Left: representative histograms of live GBM6 cells stained with Vybrant DyeCycle green showing DNA content distribution. Cells were treated with vehicle (control), 10 μM BSO (BSO), or 10 μM BSO + 100 μM GSH ethyl ester (rescue). Right: effect of BSO on the percentage of cells in the G1, S, and G2/M phases in GBM6 cells. (I and J) Effect of GCLC silencing (I) or BSO (J) on levels of 8-OHdG in GBM6 cells. 100 μM GSH ethyl ester was used to rescue the effect of GCLC silencing or BSO. (K and L) Effect of GCLC silencing on caspase activity (K) or levels of malondialdehyde (L) in GBM6, U251, or SB28 cells. Data are presented as mean ± standard deviation. **p < 0.01, ***p < 0.001, and ****p < 0.0001; ns indicates lack of statistical significance. See also Figures S2 and S3.
Figure 4.
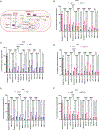
Figure 4.. GCLC silencing or inhibition rewires [U-13C]-glutamine metabolism in GBM cells
(A) Schematic illustration of [U-13C]-glutamine metabolism in cancer cells. [U-13C]-glutamine (m+5 glutamine) is catabolized by GLS to m+5 glutamate, which can then be converted by GCLC to m+5 γ-glutamyl cysteine and then to m+5 GSH. Glutamate m+5 can also be transaminated to m+5 α-KG by transaminases such as GLUD1, GLUD2, BCAT1, and GPT1. α-KG m+5 is oxidized via the TCA cycle to m+4 succinate, m+4 malate, and m+4 oxaloacetate. Oxaloacetate m+4 is conjugated with acetyl-coenzyme A (acetyl-CoA) derived from glucose to form m+4 citrate. In addition to oxidative metabolism, m+5 α-KG can be reductively carboxylated by IDH1 to m+5 isocitrate and then m+5 citrate. Alternately, m+4 oxaloacetate is converted by GOT1 to m+4 aspartate. CAD combines aspartate, glutamine, and bicarbonate to produce m+4 dihydroorotate (DHO), which is subsequently metabolized by DHODH and UMPS to the pyrimidine nucleotides m+3 UTP and m+3 CTP. Aspartate m+4, along with glutamine and glycine, also produces the purine nucleotides m+3 AMP and m+3 GMP. (B and C) Effect of silencing GCLC (B) or pharmacological inhibition using BSO (C) on [U-13C]-glutamine metabolism in GBM6 cells. (D and E) Effect of silencing GCLC (D) or BSO (E) on [U-13C]-glutamine metabolism in U251 cells. (F) Effect of silencing GCLC on [U-13C]-glutamine metabolism in SB28 cells. Data are presented as mean ± standard deviation. **p < 0.01, ***p < 0.001, and ****p < 0.0001; ns indicates lack of statistical significance. See also Figure S4.
Figure 5.
Figure 5.. Targeting GCLC upregulates GLS and CAD in an MYC-dependent manner in GBM cells
(A and B) Effect of silencing GCLC (A) or BSO (B) on mRNA levels of enzymes involved in glutamine metabolism in GBM6 cells. (C and D) Effect of GCLC silencing (C) or BSO (D) on mRNA levels of enzymes involved in glutamine metabolism in U251 cells. (E and F) Effect of GCLC silencing (E) or BSO (F) on mRNA levels of enzymes involved in glutamine metabolism in SB28 cells. (G and H) Effect of GCLC silencing (G) or BSO (H) on mRNA levels of MYC in GBM6, U251, and SB28 cells. (I) GLS mRNA in GBM6, U251, or SB28 cells transfected with non-targeted siRNA (siNT), siRNA against GCLC (siGCLC), siRNA against MYC (siMYC), or siRNA against both MYC and GCLC (siGCLC siMYC). (J) GLS mRNA in GBM6, U251, or SB28 cells treated with vehicle (DMSO) or 10 μM BSO, either alone or transfected with siRNA against MYC. (K) CAD mRNA in GBM6, U251, or SB28 cells transfected with siNT, siGCLC, siMYC, or siGCLC siMYC. (L) CAD mRNA in GBM6, U251, or SB28 cells treated with vehicle (DMSO) or 10 μM BSO, either alone or transfected with siRNA against MYC. Data are presented as mean ± standard deviation. **p < 0.01, ***p < 0.001, and ****p < 0.0001; ns indicates lack of statistical significance.
Figure 6.
Figure 6.. DON inhibits GLS and CAD and downregulates de novo pyrimidine nucleotide biosynthesis from [U-13C]-glutamine in GBM cells
(A and B) Effect of DON on GLS activity (A) and CAD activity (B) in GBM6, U251, and SB28 cells. (C) Dose-response curves for DON in the GBM6, U251, and SB28 models. ReN human neural stem cells and primary human astrocytes were used as controls. (D and E) Effect of DON on percentage of 13C metabolite enrichment from [U-13C]-glutamine in GBM6 (D) or U251 (E) cells. (F) Representative histograms of live GBM6 (left), U251 (middle), and SB28 (right) cells stained with Vybrant DyeCycle green showing DNA content distribution. Cells were treated with vehicle (control), 5 μM DON (DON), or 5 μM DON + 100 μM uridine (rescue). (G) Effect of DON on the percentage of GBM6 cells in the G1, S, and G2/M phases. (H) Effect of DON on caspase activity in GBM6, U251, and SB28 cells. (I and J) Bliss synergy score maps for the combination of DON and BSO in GBM6 (I) and U251 (J) cells. (K) Effect of treatment with vehicle (control) or the combination of 1 μM each of DON and BSO (combo) on caspase activity in GBM6, U251, and SB28 cells. (L and M) Effect of treatment with vehicle (control) or the combination of 1 μM each of DON and BSO (combo) on the percentage of 13C metabolite enrichment from [U-13C]-glutamine in GBM6 (L) or U251 (M) cells. Data are presented as mean ± standard deviation. **p < 0.01, ***p < 0.001, and ****p < 0.0001; ns indicates lack of statistical significance. See also Figures S5 and S6.
Figure 7.
Figure 7.. The combination of BSO and JHU-083 is synthetically lethal in GBMs
(A–C) Bliss synergy score maps for the combination of JHU-083 and BSO in GBM6 (A), U251 (B), and SB28 (C) cells. (D) Schematic illustration of study design with mice bearing intracranial GBM12 xenografts. Tumor-bearing mice were treated with vehicle, BSO (20 mg/kg), JHU-083 (20 mg/kg), or the combination of 20 mg/kg each of JHU-083 and BSO (combo) for 15 ± 2 days, and tumor tissue was resected for analysis. (E and F) Flow cytometric quantification of the percentage of Ki67+ cells (E) and Annexin V+ cells (F) in tumor tissue from mice bearing intracranial GBM12 tumors. (G) Schematic illustration of study design with mice bearing intracranial GBM6 xenografts. Tumor-bearing mice were treated with vehicle or the combination of 20 mg/kg each of JHU-083 and BSO (combo) for 7 days and then infused with [U-13C]-glutamine, and tumor tissue was resected for liquid chromatography-mass spectrometry (LC-MS). (H) Percentage of 13C metabolite enrichment from [U-13C]-glutamine in tumor tissue from mice bearing intracranial GBM6 tumors treated with vehicle or the combination of 20 mg/kg each of JHU-083 and BSO. (I) GCL activity, GLS activity, and CAD activity in tumor tissue from mice bearing intracranial GBM6 tumors treated with vehicle or the combination of 20 mg/kg each of JHU-083 and BSO as described in (G). (J) Schematic illustration of in vivo efficacy study design with mice bearing intracranial GBM6 or SB28 xenografts. Tumor-bearing mice were treated with vehicle, BSO (20 mg/kg), JHU-083 (20 mg/kg), or the combination of 20 mg/kg each of JHU-083 and BSO (combo) daily for 5 days every week. Mice were treated until they needed to be euthanized or the tumor was no longer visible on MRI. (K) Representative serial T2-weighted MRI from mice bearing intracranial GBM6 tumors treated as described in (J). (L) Kaplan-Meier survival curves for mice bearing intracranial GBM6 tumors treated as described in (J). (M) Representative serial T2-weighted MRI from mice bearing intracranial SB28 tumors treated as described in (J). (N) Kaplan-Meier survival curves for mice bearing intracranial SB28 tumors treated as described in (J). Data are presented as mean ± standard deviation. **p < 0.01, ***p < 0.001, and ****p < 0.0001; ns indicates lack of statistical significance. See also Figure S7.

Similar articles

Cited by

References

    1. Shay JW, and Wright WE (2019). Telomeres and telomerase: three decades of progress. Nat. Rev. Genet 20, 299–309. 10.1038/s41576-019-0099-1. - DOI - PubMed
    1. Bell RJA, Rube HT, Xavier-Magalhães A, Costa BM, Mancini A, Song JS, and Costello JF (2016). Understanding TERT Promoter Mutations: A Common Path to Immortality. Mol. Cancer Res. 14, 315–323. 10.1158/1541-7786.Mcr-16-0003. - DOI - PMC - PubMed
    1. Shay JW, Reddel RR, and Wright WE (2012). Cancer and Telomeres—An ALTernative to Telomerase. Science 336, 1388–1390. - PubMed
    1. Dilley RL, and Greenberg RA (2015). ALTernative Telomere Maintenance and Cancer. Trends Cancer 1, 145–156. 10.1016/j.trecan.2015.07.007. - DOI - PMC - PubMed
    1. Heaphy CM, de Wilde RF, Jiao Y, Klein AP, Edil BH, Shi C, Bettegowda C, Rodriguez FJ, Eberhart CG, Hebbar S, et al. (2011). Altered telomeres in tumors with ATRX and DAXX mutations. Science 333, 425. 10.1126/science.1207313. - DOI - PMC - PubMed

MeSH terms