

Open-source 3D active sample stabilization for fluorescence microscopy
- PMID: 40254224
- PMCID: PMC12124610
- DOI: 10.1016/j.bpr.2025.100208
Open-source 3D active sample stabilization for fluorescence microscopy
Abstract
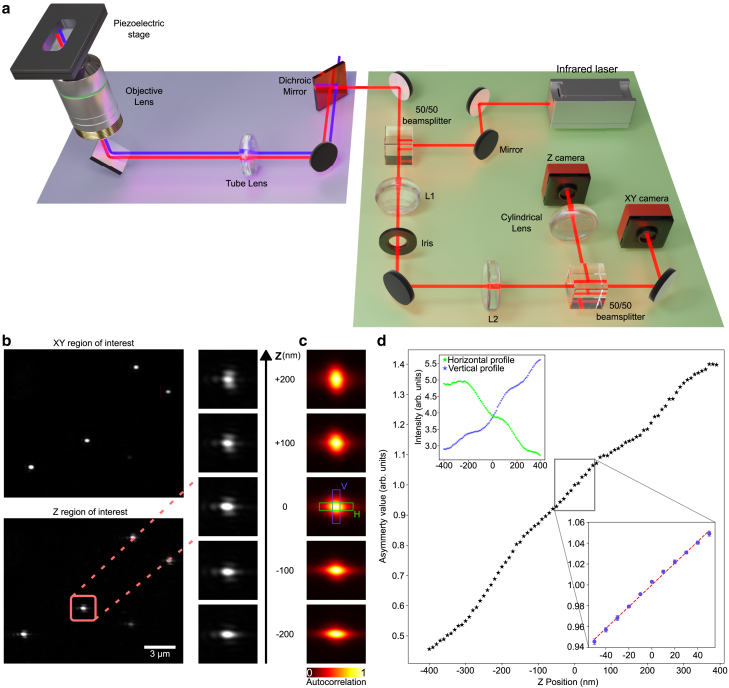
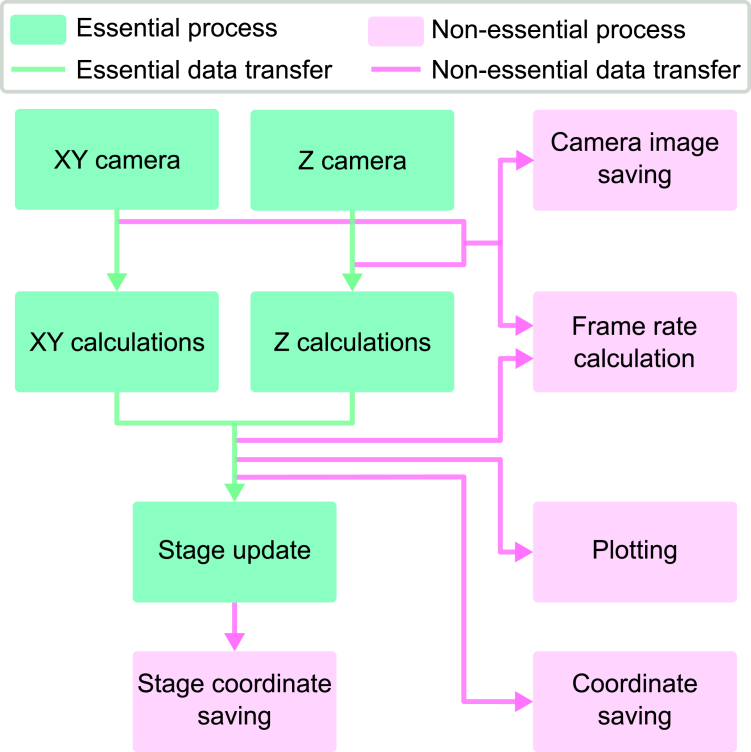
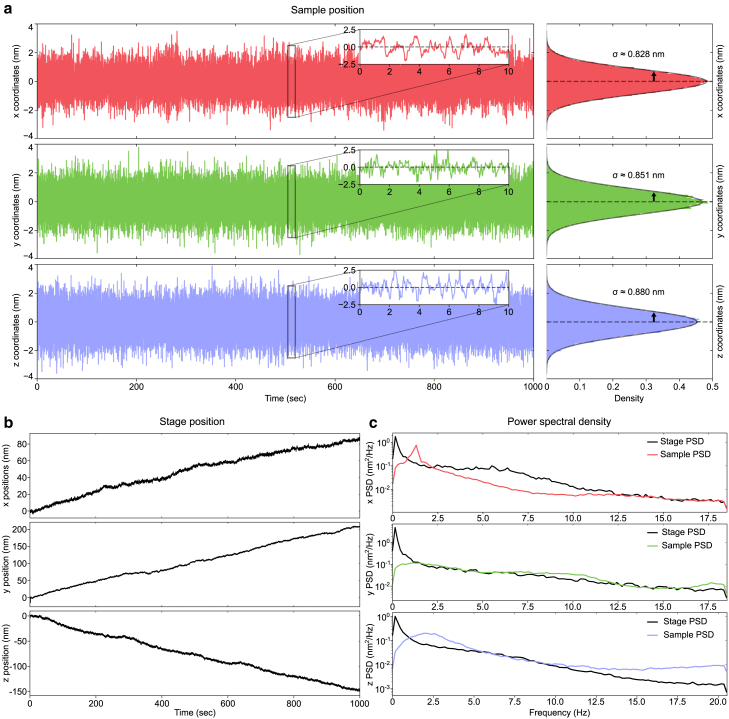
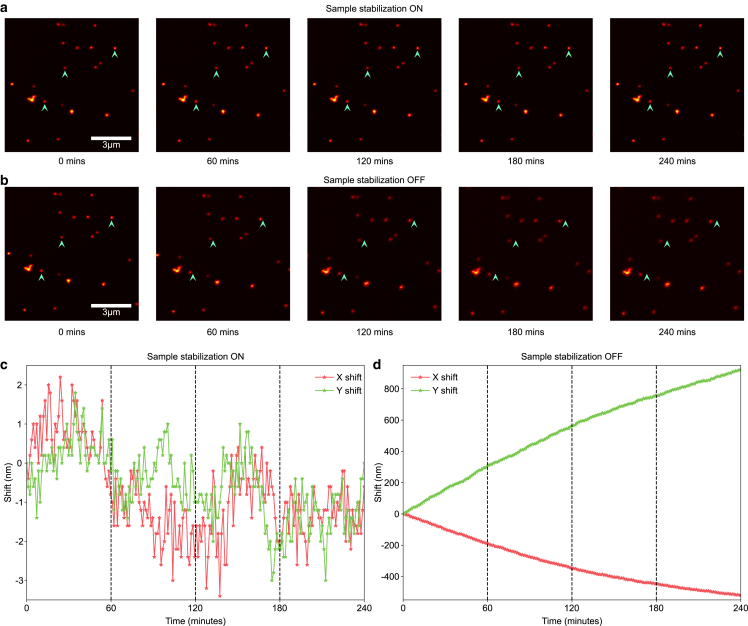
Super-resolution microscopy has enabled imaging at nanometer-scale resolution. However, achieving this level of detail without introducing artifacts that could mislead data interpretation requires maintaining sample stability throughout the entire imaging acquisition. This process can range from a few seconds to several hours, particularly when combining live-cell imaging with super-resolution techniques. Here, we present a three-dimensional active sample stabilization system based on real-time tracking of fiducial markers. To ensure broad accessibility, the system is designed using readily available off-the-shelf optical and photonic components. Additionally, the accompanying software is open source and written in Python, facilitating adoption and customization by the community. We achieve a standard deviation of the sample movement within 1 nm in both the lateral and axial directions for a duration in the range of hours. Our approach allows easy integration into existing microscopes, not only making prolonged super-resolution microscopy more accessible but also allowing confocal and widefield live-cell imaging experiments spanning hours or even days.
Copyright © 2025 The Authors. Published by Elsevier Inc. All rights reserved.
Conflict of interest statement
Declaration of interests The authors declare that they have no known competing financial interests or personal relationships that could have appeared to influence the work reported in this paper.
Figures
Similar articles
-
Image-based 3D active sample stabilization on the nanometer scale for optical microscopy.Biophys Rep (N Y). 2025 Jun 11;5(2):100211. doi: 10.1016/j.bpr.2025.100211. Epub 2025 May 5. Biophys Rep (N Y). 2025. PMID: 40334911 Free PMC article.
-
MINFLUX nanometer-scale 3D imaging and microsecond-range tracking on a common fluorescence microscope.Nat Commun. 2021 Mar 5;12(1):1478. doi: 10.1038/s41467-021-21652-z. Nat Commun. 2021. PMID: 33674570 Free PMC article.
-
A Simple Marker-Assisted 3D Nanometer Drift Correction Method for Superresolution Microscopy.Biophys J. 2017 May 23;112(10):2196-2208. doi: 10.1016/j.bpj.2017.04.025. Biophys J. 2017. PMID: 28538156 Free PMC article.
-
[Comparison and progress review of various super-resolution fluorescence imaging techniques].Se Pu. 2021 Oct;39(10):1055-1064. doi: 10.3724/SP.J.1123.2021.06015. Se Pu. 2021. PMID: 34505427 Free PMC article. Review. Chinese.
-
Super-resolution fluorescence microscopy.Annu Rev Biochem. 2009;78:993-1016. doi: 10.1146/annurev.biochem.77.061906.092014. Annu Rev Biochem. 2009. PMID: 19489737 Free PMC article. Review.
References
-
- Heilemann M., Linde S.van de, et al. Sauer M. Subdiffraction-resolution fluorescence imaging with conventional fluorescent probes. Angew. Chem. Int. Ed. 2008;47:6172–6178. - PubMed
MeSH terms
LinkOut - more resources
Full Text Sources
