

Exposure and response of satellite-tagged Blainville's beaked whales to mid-frequency active sonar off Kaua'i, Hawai'i
- PMID: 40254575
- PMCID: PMC12010625
- DOI: 10.1186/s40462-025-00550-9
Exposure and response of satellite-tagged Blainville's beaked whales to mid-frequency active sonar off Kaua'i, Hawai'i
Abstract
Background: Beaked whale response to Navy sonars is a global concern due to past stranding events coinciding with training activity. Often, controlled exposure experiments involve tagging cetaceans with short-term, high-resolution tags and exposing them to relatively short, single bouts of mid-frequency active sonar (MFAS). In contrast, longer-duration satellite-transmitting tags deployed around Navy ranges enables behavioral response studies of animals exposed to realistic Navy training activities over extended periods and spatial scales, with multiple exposures to different sources.
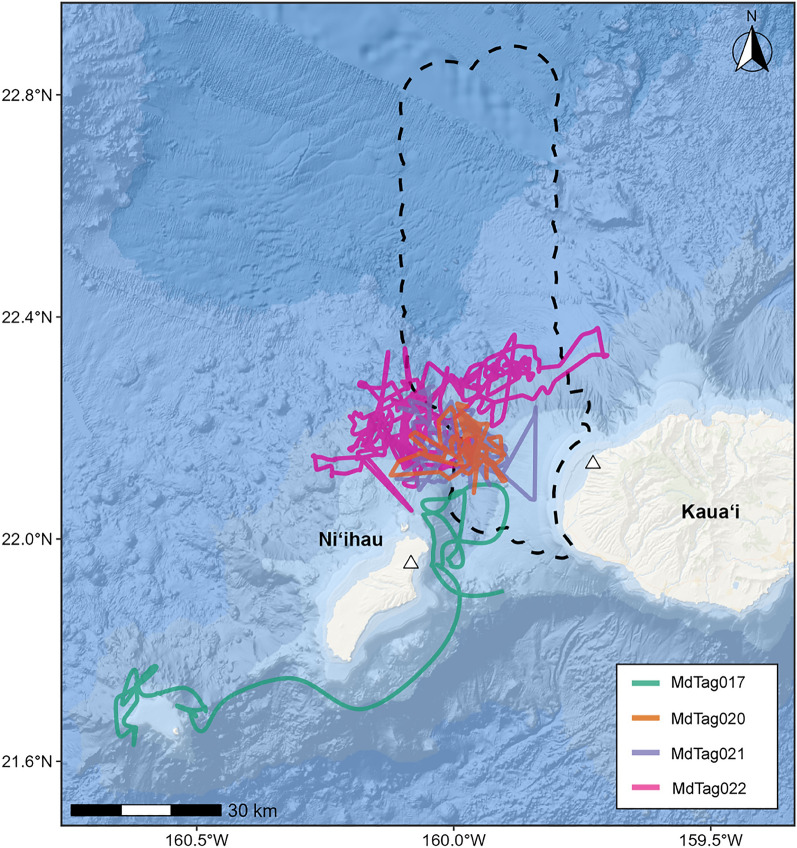
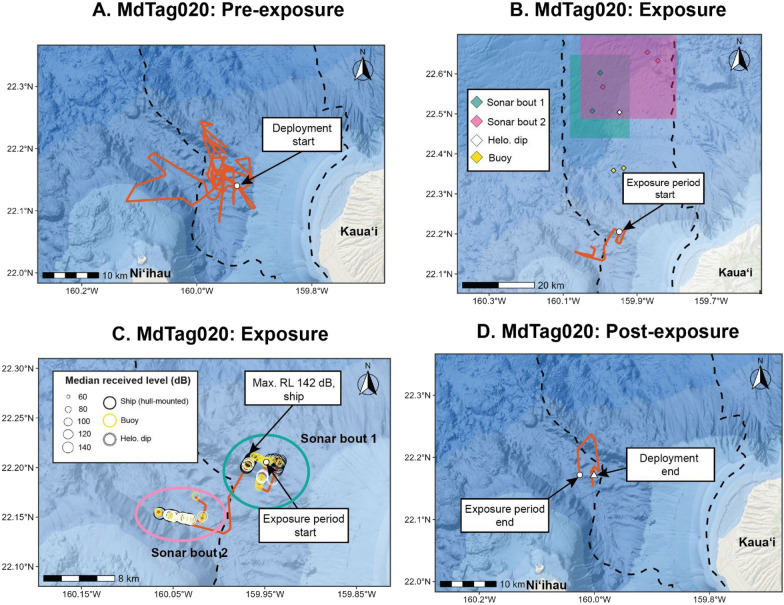
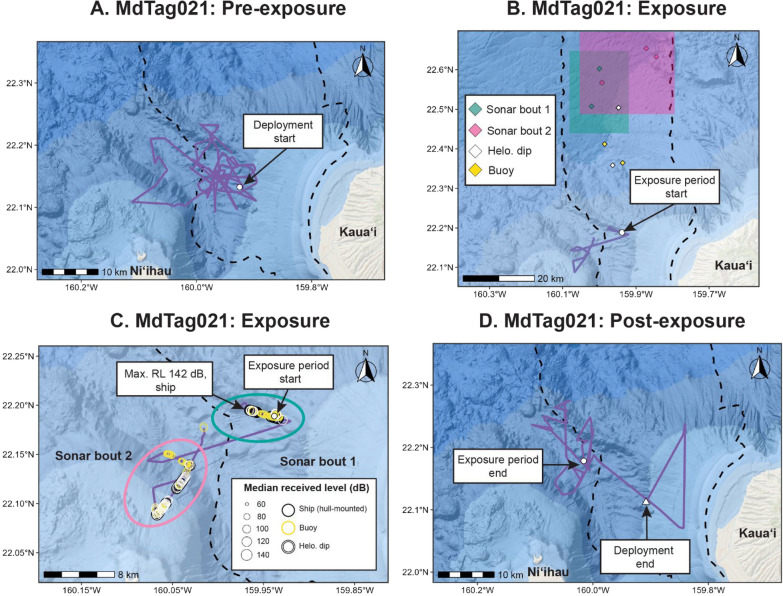
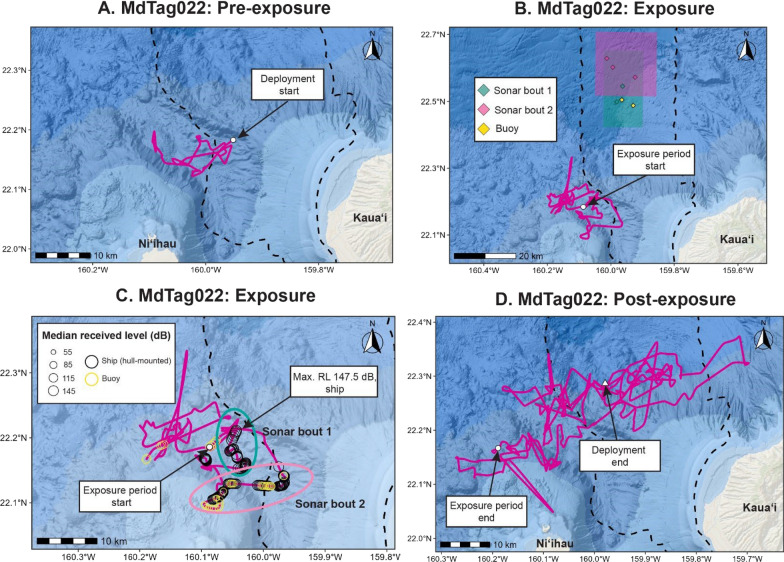
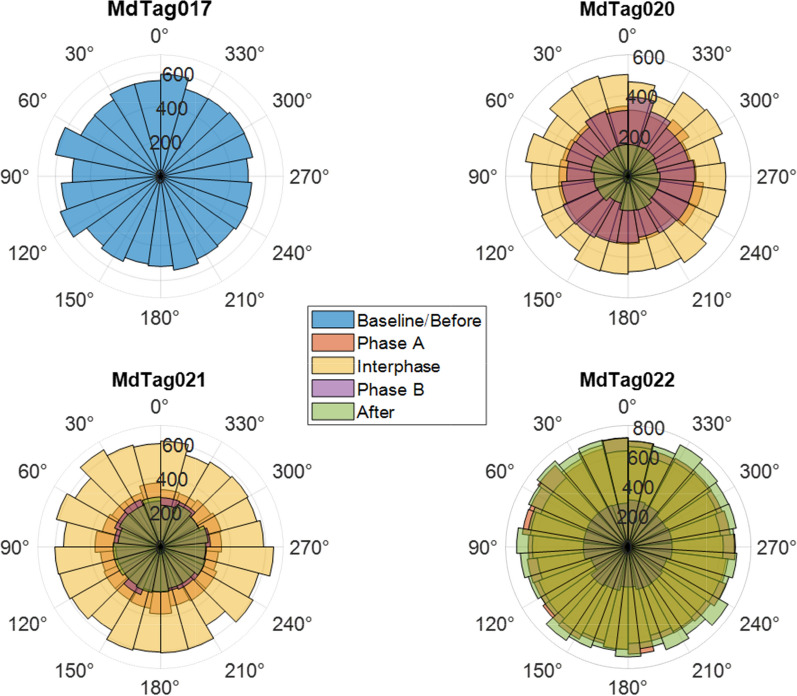
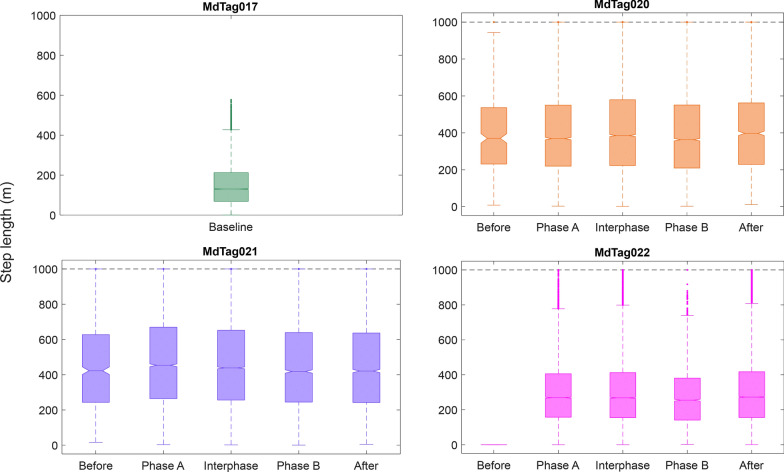
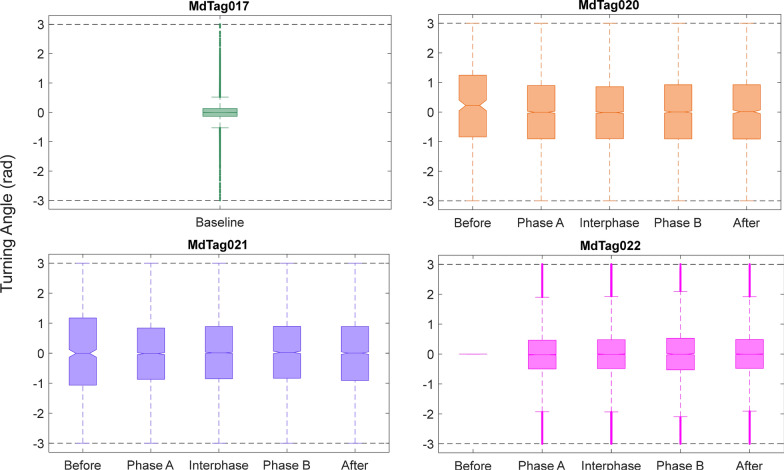
Methods: To study their behavior relative to extended periods of realistic Navy training, satellite-transmitting tags were deployed on four Blainville's beaked whales (Mesoplodon densirostris) on the Pacific Missile Range Facility (PMRF) off Kaua'i. Tags were deployed in 3 years, ahead of Submarine Command Courses (SCCs) with multiple sources of MFAS. Dive behavior of two tagged together were compared to acoustically detected group vocal periods (GVPs) on the range. Pre-exposure dive behavior metrics were compared to those during exposures. Horizontal movement behavior metrics were analyzed using Kruskal-Wallis non-parametric and Tukey-Kramer multiple comparison tests.
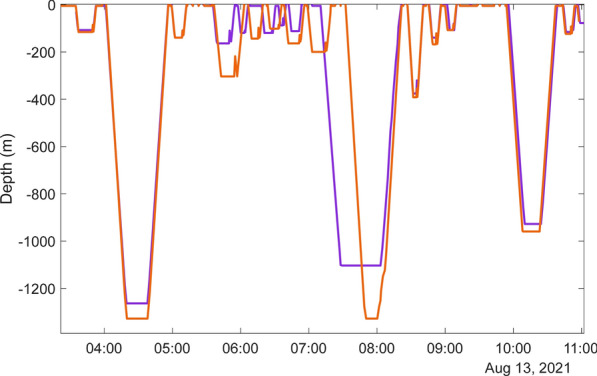
Results: Two whales remained together and highly synchronized in their dive and movement behavior until the onset of MFAS, at which time they appeared to separate. Twenty-three deep foraging dives were matched to GVPs, including three during MFAS. Of the dive behavior metrics, only the depth of one intermediate dive during an exposure was outside the 95th percentile of baseline behavior. Three of the four movement behavior metrics (75%) were atypical relative to baseline for at least one whale across SCC phases, but response varied by individual. However, throughout the SCCs, the whales remained within tens of kilometers of PMRF, near areas used before and after SCCs.
Conclusions: These data demonstrate some apparent short-term changes to dive behavior and horizontal movement in response to MFAS. However, these beaked whales did not demonstrate sustained avoidance responses, remaining in the area west of the range during MFAS and in two cases returning to the range after the SCC. Additional tagging and photo-identification studies are critical to understand Blainville's beaked whale habitat use and residency and to assess the potential impact of repeated exposures to MFAS.
Keywords: Behavioral response; Blainville’s beaked whales; Dive behavior; Mid-frequency active sonar; Movement behavior; Satellite tags.
© 2025. This is a U.S. Government work and not under copyright protection in the US; foreign copyright protection may apply.
Conflict of interest statement
Declarations. Ethics approval and consent to participate: Not applicable. Consent for publication: Not applicable. Competing interests: The authors declare no competing interests.
Figures


Similar articles
-
Beaked whales respond to simulated and actual navy sonar.PLoS One. 2011 Mar 14;6(3):e17009. doi: 10.1371/journal.pone.0017009. PLoS One. 2011. PMID: 21423729 Free PMC article.
-
A risk function for behavioral disruption of Blainville's beaked whales (Mesoplodon densirostris) from mid-frequency active sonar.PLoS One. 2014 Jan 21;9(1):e85064. doi: 10.1371/journal.pone.0085064. eCollection 2014. PLoS One. 2014. PMID: 24465477 Free PMC article.
-
Co-occurrence of beaked whale strandings and naval sonar in the Mariana Islands, Western Pacific.Proc Biol Sci. 2020 Feb 26;287(1921):20200070. doi: 10.1098/rspb.2020.0070. Epub 2020 Feb 19. Proc Biol Sci. 2020. PMID: 32070257 Free PMC article.
-
Advances in research on the impacts of anti-submarine sonar on beaked whales.Proc Biol Sci. 2019 Jan 30;286(1895):20182533. doi: 10.1098/rspb.2018.2533. Proc Biol Sci. 2019. PMID: 30963955 Free PMC article. Review.
-
How man-made interference might cause gas bubble emboli in deep diving whales.Front Physiol. 2014 Jan 28;5:13. doi: 10.3389/fphys.2014.00013. eCollection 2014. Front Physiol. 2014. PMID: 24478724 Free PMC article. Review.
References
-
- Atlantic Fleet Testing and Training Environmental Impact Statement. Appendix A, Navy activity description. https://www.nepa.navy.mil/AFTT-Phase-III/
-
- Andrews RD, Pitman RL, Ballance LT. Satellite tracking reveals distinct movement patterns for type B and type C killer whales in the southern Ross Sea, Antarctica. Polar Biol. 2008;31(12):1461–8. 10.1007/s00300-008-0487-z.
-
- Baird RW. The lives of Hawai‘i’s dolphins and whales: natural history and conservation. Honolulu: University of Hawai‘i’ Press; 2016. 10.1515/9780824865931.
LinkOut - more resources
Full Text Sources
Research Materials
Miscellaneous
