. 2025 Apr 21;13(1):79.
doi: 10.1186/s40478-025-02002-2.

Neutrophil infiltration and microglial shifts in sepsis induced preterm brain injury: pathological insights

Affiliations

Neutrophil infiltration and microglial shifts in sepsis induced preterm brain injury: pathological insights

Jinjin Zhu et al. Acta Neuropathol Commun. .

Abstract

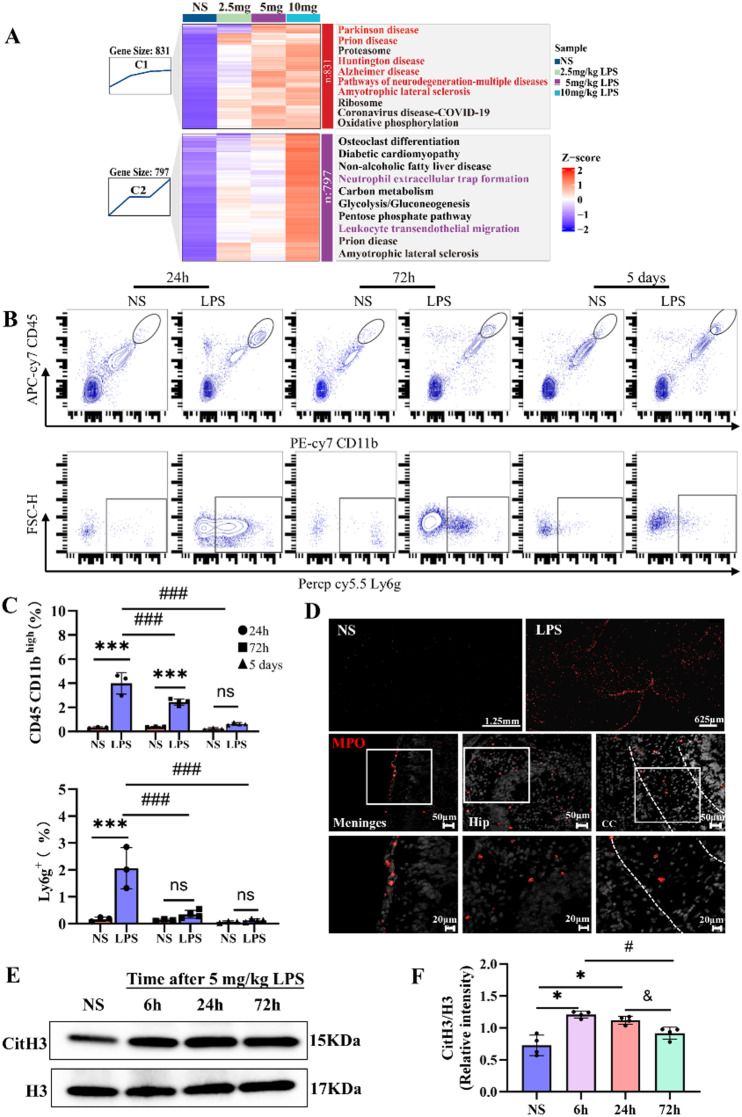
Preterm sepsis is a major contributor to brain injury and long-term neurodevelopmental impairments, but its molecular mechanisms remain poorly understood. This study integrated clinical and experimental approaches to investigate the pathological changes linking systemic inflammation to brain injury in preterm infants. Transcriptomic analysis of septic preterm infants' peripheral blood revealed upregulated immune, metabolic, and inflammatory pathways, suggesting a link between systemic and brain inflammation. Using P2 mice, we established a preterm white matter injury model through multiple doses of lipopolysaccharide, observing dose-dependent developmental delays, brain inflammation, and long-term behavioral deficits. Integrative analyses of peripheral blood and brain samples from both mice and preterm infants revealed consistent chemokine alterations and immune cell infiltration across peripheral and central compartments, highlighting the significant involvement of neutrophil extracellular traps in preterm brain injury. Furthermore, microglia exhibited significant transcriptional changes during the acute phase, accompanied by metabolic reprogramming from oxidative phosphorylation to glycolysis, with suggested involvement of Pgk1 and Pgam1. This shift intensified with escalating inflammation, along with PANoptosis-related gene upregulation, ultimately associated with microglial cell death. Collectively, these findings provide pathological insights into the immunometabolic alterations underlying sepsis-induced preterm brain injury and suggest potential targets for future therapeutic interventions to mitigate long-term neurodevelopmental deficits.

Keywords: Behavioral deficits; Microglial metabolic reprogramming; Neonatal sepsis; Neutrophil; PANoptosis; White matter injury.


Conflict of interest statement

Declarations. Ethical approval: Ethical approval for the preterm infants study was obtained from the Ethics Committees of The Third Affiliated Hospital of Zhengzhou University (ethical no: 2018-04). All procedures for the animal study followed the institutional animal care standards set by the Ethics Committee of Zhengzhou University [Ethics number 2022-(yu)121]. Competing interests: The authors declare no competing interests.

Figures

Fig. 1
Fig. 1
Perinatal LPS Exposure causes developmental delays and white matter injury in neonatal mice. A. Experimental timeline overview. B. Representative images of neonatal mice at P5 showing physical appearance after treatment with NS, 5 mg/kg, or 10 mg/kg LPS. C. Bar graph displaying body weight gain at different time points (P3, P5, and P12) relative to P2. Statistical analysis was performed using One-way ANOVA with Tukey’s post hoc test or Kruskal‒Wallis test with Dunn post hoc test (P3-female: H = 27.3, P = 0.000; P3-male: F3,39 = 119.5, P = 0.000; P5-female: H = 23.8, P = 0.000; P5-male: H = 19.2, P = 0.000; P12-female: F3,39 = 13.6, P = 0.000; P12-male: F3,42 = 8.5, P = 0.000; n = 8–15/group, **P < 0.01, ***P < 0.001, NS vs. LPS). D. Histogram showing the mortality ratio three days after LPS injection across groups (NS group, n = 29; 2.5 mg/kg LPS group, n = 59; 5 mg/kg LPS group, n = 83; 10 mg/kg LPS group, n = 80). E. Quantification of MBP-positive areas in the corpus callosum (CC) at P12 (Kruskal‒Wallis test with Dunn post hoc test: H = 25.8, P = 0.000, n = 9/group, P < 0.01, *P < 0.001, NS vs. LPS, #P < 0.05, 2.5 mg/kg LPS vs. 10 mg/kg LPS). F. Representative MBP-stained images of the CC at P12, showing myelin structure in the NS, 2.5 mg/kg, 5 mg/kg, and 10 mg/kg LPS groups. Scale bars: 1 mm (middle column) and 100 μm (side column). G. Quantification of Iba-1-positive cells per unit area (mm²) in the brain 24 h post-LPS treatment (One-way ANOVA with Tukey’s post hoc test: F3,14 = 7.6, P = 0.002; n = 4–5/group, *P < 0.05, **P < 0.01, NS vs. LPS). H. Representative Iba-1 staining (green) at 24 h after LPS treatment for different doses (NS, 5 mg/kg, and 10 mg/kg). Scale bars: 500 μm (left) and 100 μm (right)
Fig. 2
Fig. 2
Transcriptomic analysis uncovers key inflammatory pathways and hub genes in sepsis. (A) Overview of experimental workflow for the transcriptome analysis and Oink proteomic assay in sepsis preterm infants. (B) PCA plot displaying the transcriptomic separation between the sepsis and healthy control (HC) groups (n = 8/group). (C) Volcano plot illustrating differential gene expression between the sepsis and HC groups, with log2 fold change (FC) on the x-axis and − log10 (q-value) on the y-axis. The top 20 most significant differentially expressed genes (DEGs) are labeled. (D) Bar plot showing the GO term enrichment analysis of DEGs, with Z-scores indicating the direction and magnitude of pathway regulation. The color gradient reflects the significance (-log10(p. adjust)). (E) Circular layout depicting the top 50 hub genes identified by the STRING/Cityscape/cytoHubba interface. The size and color of each node (larger size and deep red) correspond to the gene rank based on the degree algorithm in the cytoHubba plug-in. (F) Comparative expression levels of selected hub genes (HMOX1, ITGAM, C1QA, MMP9, G6PD) between the HC and sepsis groups (n = 8/group), analyzed using two-tailed unpaired t-tests or Mann–Whitney U tests (HMOX1: t = 3.04, p = 0.014; ITGAM: t = 5.63, p = 0.000; C1QA: U = 53, p = 0.027; MMP9: t = 2.83, p = 0.021; G6PD: t = 4.59, p = 0.000). *P < 0.05, **P < 0.01, ***P < 0.001
Fig. 3
Fig. 3
Perinatal LPS exposure induces long-term anxiety-like behavior and social deficits. A. Heatmaps showing the movement distribution of NS- and LPS-treated mice during the O-maze test. B-E. Bar graphs illustrating the total distance traveled, number of open arm entries, percentage of time spent in the open arms, and distance traveled in the open arms during the O-maze test. Statistical analysis was performed using two-way ANOVA with Bonferroni post hoc correction. Results are as follows: total distance: no LPS effect: F1,35 = 2.6, P = 0.11; no sex effect: F1,35 = 0.4, P = 0.49; no interaction: F1,35 = 0.5, P = 0.47. Time percent in open arms: LPS effect: F1,35 = 23.3, P = 0.000; no sex effect: F1,35 = 1.1, P = 0.73; no interaction: F1,35 = 1.3, P = 0.25. Open arm entries: LPS effect: F1,35 = 18.0, P = 0.000; no sex effect: F1,35 = 0.423, P = 0.53; no interaction: F1,35 = 1.3, P = 0.25. Distance in open arms: LPS effect: F1,35 = 8.7, P = 0.006; no sex effect: F1,35 = 0.08, P = 0.77; no interaction: F1,35 = 0.3, P = 0.56 (n = 9/group, *P < 0.05, ***P < 0.001). F. Two-phase social preference (S-E) protocol: a 10-min habituation phase followed by a 10-min test with a social stimulus (Soc: mouse under a cup) and a nonsocial stimulus (Empty: empty cup). G. Heatmaps displaying the time distribution in the social preference test for NS- and LPS-treated mice. H. Bar graphs showing the time spent interacting with the social stimulus (Soc) or the empty cup (Empty) for NS- and LPS-treated mice. Statistical analysis with Student’s unpaired t test: NS-female: t = 5.7, P = 0.000; NS-male: t = 7.1, P = 0.000; LPS-female: t = 0.3, P = 0.75; LPS-male: t = 0.8, P = 0.42 (n = 7–9/group). I. Social preference indices for NS- and LPS-treated mice, analyzed by Two-way ANOVA with Bonferroni post hoc correction: Social index: LPS effect: F1,31 = 42.6, P = 0.000; no sex effect: F1,31 = 0.2, P = 0.64; no interaction: F1,31 = 1.31, P = 0.26 (n = 7–9/group). *P < 0.05, ***P < 0.001
Fig. 4
Fig. 4
Perinatal LPS exposure moderately impairs motor and cognitive functions. A. Representative heatmaps illustrating the head movements of mice during the novel object recognition test, comparing exploration of a familiar object versus a novel object. B-E. Bar graphs showing the recognition index (novel object time/total exploration time) and the discrimination index [(novel object time − familiar object time)/total exploration time]. Two-way ANOVA with Bonferroni post hoc correction (C, E) revealed a significant effect of LPS on the recognition index (F1,29 = 4.9, P = 0.035), but no effect of sex (F1,29 = 1.231, P = 0.27) and no interaction (F1,29 = 0.103, P = 0.75). Similarly, the discrimination index showed a significant LPS effect (F1,29 = 4.933, P = 0.035), with no effect of sex (F1,29 = 1.232, P = 0.27) and no interaction (F1,29 = 0.103, P = 0.75) (n = 6–9/group). For individual comparisons, Student’s unpaired t test (B, D) indicated significant differences in both the recognition index (t = 2.4, P = 0.02) and discrimination index (t = 2.4, P = 0.02). F. Representative heatmaps showing tracking patterns over 5-minute in the Y-maze. G. Bar graphs showing the percentage of spontaneous alternations calculated in the Y-maze test [(number of alternations/total number of entries − 2) × 100]. The Scheirer-Ray-Hare test with Kruskal‒Wallis test for pairwise comparisons showed a significant LPS effect (H = 9.0, P = 0.002), but no effect of sex (H = 1.7, P = 0.18) or interaction (H = 0.2, P = 0.62) (n = 9/group). H. Rotarod test setup. I-J. Bar graphs showing the latency to fall in both NS and LPS groups. Student’s unpaired t test for (I) and two-way ANOVA with Bonferroni post hoc correction for (J revealed an LPS effect (F1,35 = 5.0, P = 0.03), with no effect of sex (F1,31 = 1.2, P = 0.27) and no interaction (F1,31 = 0.1, P = 0.75; t = 2.2, P = 0.03) (n = 9/group). * P < 0.05
Fig. 5
Fig. 5
Chemokine expression and immune cell infiltration in LPS-treated neonatal mice and preterm infants with sepsis. A-B. Chemokine levels in neonatal mouse plasma (A) and brain tissue (B) measured at 24 h and 72 h after 5 mg/kg LPS treatment (n = 5–10/group). Statistical analyses were performed using t-tests, ANOVA, or Kruskal-Wallis tests with appropriate post hoc corrections. Full results are presented in Table S4-S5. C. Normalized chemokine protein expression in plasma from preterm infant (HC vs. Sepsis), measured using the Olink proteomics platform (n = 27–29/group). D. Workflow for transcriptome analysis of immune cells using magnetic bead sorting. E. PCA plot showing the transcriptomic separation among the groups (n = 7–8/group). F-G. Immune cell infiltration analysis based on bulk RNA-seq data, using the ImmuCellAI database for preterm infants (F) and LPS-treated neonatal mice (G) (n = 7–8/group). *P < 0.05, **P < 0.01, ***P < 0.001
Fig. 6
Fig. 6
Differentially expressed genes (DEGs) and network analysis in preterm sepsis and LPS-treated neonatal mice. A. Bar chart displaying the number of DEGs in each LPS treatment groups. (B) Gene mapping diagram showing the conversion of mouse DEGs to human genes across different LPS treatments. (C) Venn diagram showing DEGs overlap between the preterm sepsis group and various LPS treatment groups. (D) Bar plot of GO term enrichment analysis for each DEGs set. All combined group (green): Intersection of 123 DEGs between the preterm sepsis and all LPS treatment groups. Shared group (red): 48 DEGs common to both the preterm sepsis and all three LPS treatment groups. 5 mg/kg LPS-specific group (yellow): 20 uniquely overlapping genes. 10 mg/kg LPS-specific group (blue): 22 genes uniquely overlapping genes. (E) PPI network derived from the “All combined” DEGs using the STRING database. Circles indicate proteins, and lines represent predicted interactions; the line thickness reflecting the confidence level of interaction. (F) Reactome pathway enrichment analysis corresponding to E. Each pathway is color-matched to its respective protein nodes in E
Fig. 7
Fig. 7
Neutrophil infiltration and NETs formation induced by LPS in the neonatal mouse brain. A. Mfuzz clustering heatmap showing dynamic expression patterns across the four groups. The top 10 KEGG pathways are displayed with their z-scores (blue: negative, red: positive). Cluster 1 and Cluster 2 highlight the differential effects of various LPS doses. Genes name are listed in Table S6B. Flow cytometry gating strategy used to analyze immune cells in the peripheral blood. C. Bar graphs showing immune cell (CD45high/CD11b+) and neutrophil (CD45high/CD11b+/Ly6g+) expression in the neonatal mouse brain at 24 h, 72 h, and 5 days after 5 mg/kg LPS treatment. Analysis was performed using the Scheirer–Ray–Hare test with Kruskal–Wallis corrections. For Ly6g: LPS effect: H = 6.3, P = 0.011; time effect: H = 9.0, P = 0.010; no interaction: H = 0.5, P = 0.76. For CD45CD11b: LPS effect: H = 14.6, P = 0.000; no time effect: H = 3.1, P = 0.20; no interaction: H = 0.6, P = 0.73 (n = 3–4/group, ***P < 0.001, NS vs. LPS, ###P < 0.001 24 h vs. 72 h/5 days for LPS). D. Representative MPO (red) staining in the NS and 5 mg/kg LPS groups at 24 h (scale bars: 50 μm upper, 20 μm lower). E-F. Western blot quantification of CitH3 in neonatal mouse brain lysates at 6 h, 24 h, and 72 h after 5 mg/kg LPS treatment. H3 was used as the loading control. Welch one-way ANOVA test with Games–Howell post hoc test: F3,11 = 14.9, P = 0.002 (n = 4/group, *P < 0.05, NS vs. LPS, #P < 0.05, 6 h vs. 72 h, &P < 0.05, 24 h vs. 72 h)
Fig. 8
Fig. 8
LPS-Induced metabolic and homeostatic dysregulation in neonatal microglia. (A) Heatmap illustrating changes in microglia-related gene expression following LPS treatment. (B) Bar graph showing the number of DEGs in each LPS dosage group compared to NS, accompanied by a Venn diagram indicating the overlap of DEGs across the groups. A total of 724 common DEGs were used for GO term enrichment analysis, with the bar plot displaying the results and x-axis representing -log10(p.adjust). (C) WGCNA module-condition relationship heatmap, highlighting the brown and blue modules as being strongly correlated with LPS treatment. (D) Venn diagram showing the overlap of the 724 common DEGs with the brown and blue modules, followed by a dot plot of enriched biological processes and pathways. (E) Scatter plot illustrating gene significance (GS) and module membership (MM) in the blue module for the 10 mg/kg LPS group, highlighting key metabolic genes. (F) Bar graphs showing Pgk1 and Pgam1 expression across treatment groups. Kruskal–Wallis test followed by Dunn’s post hoc test: Pgk1: H = 19.978, p = 0.0002; Pgam1: H = 20.65, p = 0.0010 (n = 7–8/group, *P < 0.05, ***P < 0.001, NS vs. LPS). (G) Representative immunofluorescence images of Iba-1 (green) and Pgk1 (red) in in P3 mouse brains treated with NS or LPS (5 mg/kg). Scale bar = 100 μm. (H) Quantification of Iba-1⁺Pgk1⁺ cell density (cells/mm², left) and the percentage of Pgk1⁺Iba-1⁺ cells among total Iba-1⁺ cells (right). Welch’s t-test (left, t = 9.29, p < 0.001) and unpaired t-test (right, t = 8.08, p < 0.001). (n = 7–10/group, ***p < 0.001). (I) A simplified metabolic pathway schematic is displayed on the right (created using BioRender).J. Heatmap showing the predicted metabolic flux profile for energy-related modules, generated using scFEA. Each row represents the flux of a specific metabolic module across different cell groups (x-axis), with the color scale bar indicating the magnitude and direction of flux
Fig. 9
Fig. 9
LPS induces microglial programmed cell death in neonatal mice at 24 h. A. Heatmap displaying q-values from the KEGG cellular process enrichment analysis with significant pathways indicated (*P < 0.05, ***P < 0.001, NS vs. LPS). B. Heatmap showing differential gene expression related to the programmed cell death signaling pathway in neonatal mice exposed to 10 mg/kg LPS. C. PPI network of of cell death regulatiory proteins, extracted from the KEGG and STRING databases. Line thickness represents interaction confidence levels (thicker lines indicate higher confidence). D. RT-PCR validation of key programmed cell death genes in mouse brain tissue 24 h after LPS injection. Statistical tests used include one-way ANOVA with Tukey’s post hoc test or Kruskal–Wallis test with post hoc Dunn test (Mlkl: H = 10.4, P = 0.002; Zbp1: H = 5.4, P = 0.02; Ripk3: F2,13 = 9.5, P = 0.002; Ripk2: H = 8.6, P = 0.013; Slc7a11: F2,13 = 5.0, P = 0.02; Slc40a1: F2,13 = 17.0, P = 0.000. n = 4–8/group). Significant results: &P < 0.05, NS vs. 5 mg/kg LPS, * P < 0.05, ** P < 0.01, *** P < 0.001, NS vs. 10 mg/kg LPS, ##P < 0.01, 5 mg/kg LPS vs. 10 mg/kg LPS. E. Representative electron microscope images of mitochondria in control and LPS-treated mice at 24 h after 10 mg/kg LPS treatment. Red and blue arrows indicate normal and damaged mitochondria, respectively (Scale bar = 200 nm). n = 3–4/group. F. Representative TUNEL (green) and Iba-1 (red) double-staining images of the 10 mg/kg LPS group at 24 h. Scale bars, 50 μm (upper panel) and 20 μm (lower panel)
Fig. 10
Fig. 10
A schematic overview of possible mechanisms underlying systemic inflammation-induced WMI in preterm infants. Systemic inflammation in preterm infants promotes microglial metabolic reprogramming, shifting from oxidative phosphorylation to glycolysis via Pgam1 and Pgk1, and is associated with local inflammation and ROS release. Under severe inflammation conditions, mitochondrial damage worsens, releasing mtDNA and ROS, potentially activating the ZBP1-RIPK3-MLKL pathway and leading to microglial cell death and an amplified inflammatory response. Meanwhile, elevated chemokines drive neutrophil infiltration and NET formation, exacerbating BBB disruption and sustained brain inflammation, ultimately resulting in white matter injury (created using BioRender)

Similar articles

References

    1. Atladóttir HO, Thorsen P, Østergaard L, Schendel DE, Lemcke S, Abdallah M et al (2010) Maternal infection requiring hospitalization during pregnancy and autism spectrum disorders. J Autism Dev Disord 40:1423–1430. 10.1007/s10803-010-1006-y - PubMed
    1. Baburamani AA, Supramaniam VG, Hagberg H, Mallard C (2014) Microglia toxicity in preterm brain injury. Reprod Toxicol 48:106–112. 10.1016/j.reprotox.2014.04.002 - PMC - PubMed
    1. Baik SH, Kang S, Lee W, Choi H, Chung S, Kim JI et al (2019) A breakdown in metabolic reprogramming causes microglia dysfunction in Alzheimer’s disease. Cell Metab 30:493–507e496. 10.1016/j.cmet.2019.06.005 - PubMed
    1. Basilico B, Ferrucci L, Khan A, Di Angelantonio S, Ragozzino D, Reverte I (2022) What microglia depletion approaches tell Us about the role of microglia on synaptic function and behavior. Front Cell Neurosci 16:1022431. 10.3389/fncel.2022.1022431 - PMC - PubMed
    1. Benmamar-Badel A, Owens T, Wlodarczyk A (2020) Protective microglial subset in development, aging, and disease: lessons from transcriptomic studies. Front Immunol 11:430. 10.3389/fimmu.2020.00430 - PMC - PubMed

Publication types

MeSH terms

Substances

LinkOut - more resources