. 2025 Apr 20;16(1):193.
doi: 10.1186/s13287-025-04306-5.

Neural-induced human adipose tissue-derived stem cell secretome exerts neuroprotection against rotenone-induced Parkinson's disease in rats

Affiliations

Neural-induced human adipose tissue-derived stem cell secretome exerts neuroprotection against rotenone-induced Parkinson's disease in rats

Mahesh Ramalingam et al. Stem Cell Res Ther. .

Abstract

Background: Parkinson's disease (PD) is a multifactorial disease that involves genetic and environmental factors, which play an essential role in the pathogenesis of PD. Mesenchymal stem cells release a set of bioactive molecules called "secretome" that regulates intercellular communication and cargo transfer in signaling pathways for PD treatment. Thus, this study aimed to evaluate the neuroprotective effects of neural-induced human adipose tissue-derived stem cell (NI-hADSC)-conditioned medium (NI-hADSC-CM) and its exosomes (NI-hADSC-Exo) in a rotenone (ROT)-induced model of PD in rats.

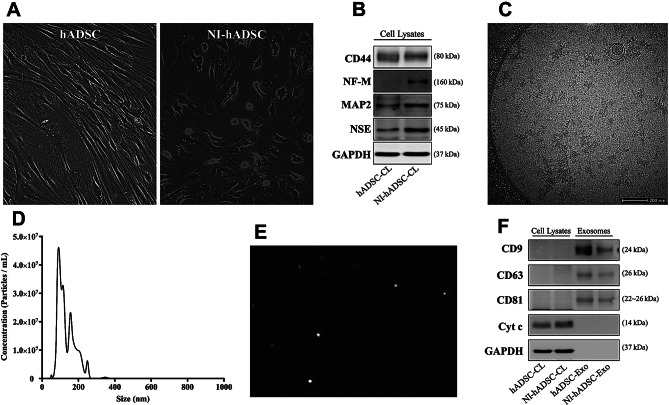
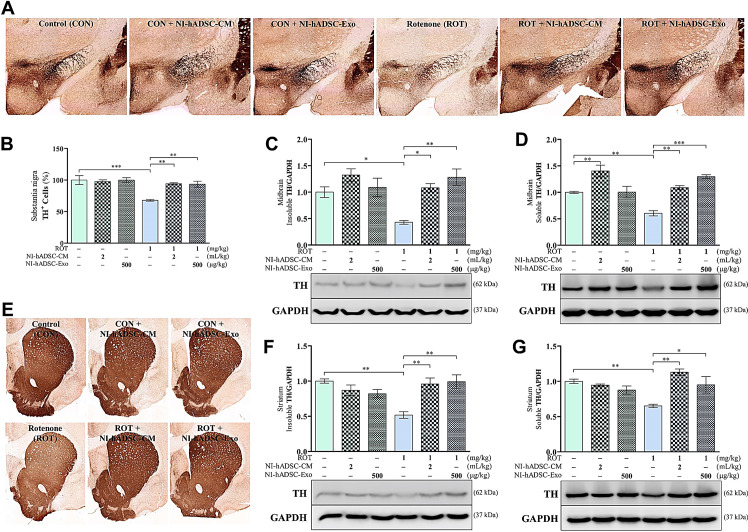
Methods: The NI-hADSC-CM was collected from NI-hADSC after 14 days of neural differentiation, and its NI-hADSC-Exo were isolated using a tangential flow filtration system. ROT (1 mg/kg) was subcutaneously administered for 28 days to establish a model of PD in rats. The treatment of NI-hADSC-CM or NI-hADSC-Exo was intravenously injected on days 15, 18, 21, 24, and 27. Animal behavioral effects were explored via a rotarod test. After 28 days, histological and western blot analyses were performed to investigate the tyrosine hydroxylase (TH), α-synuclein (α-syn) aggregation, and downstream signaling pathways for experimental validation.

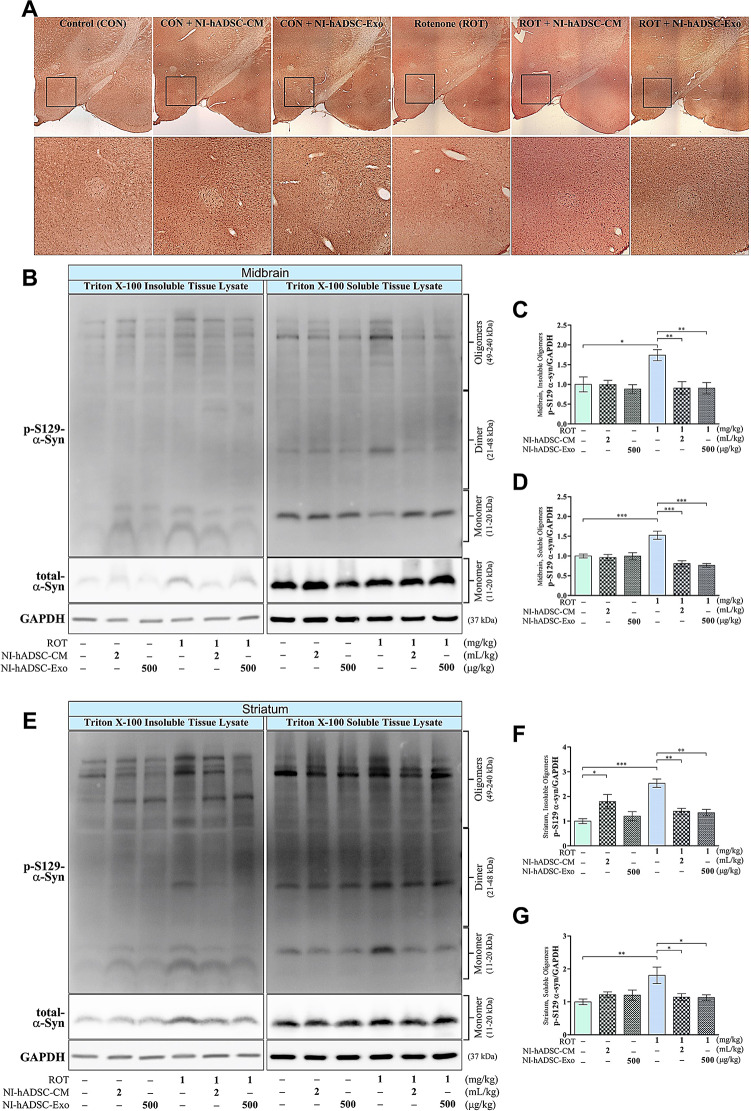
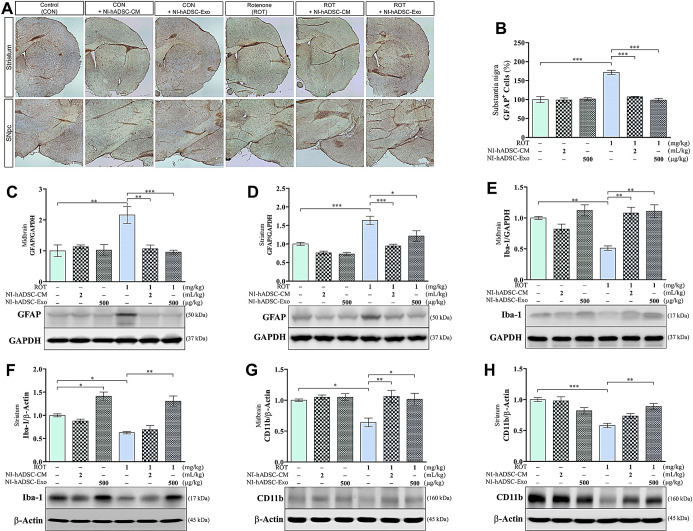
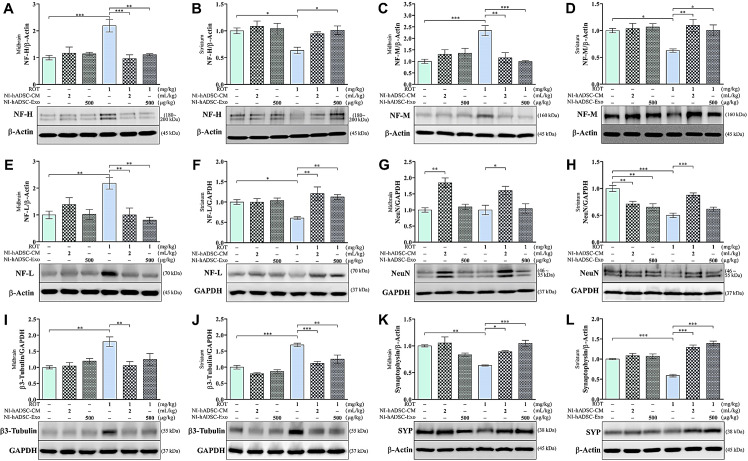
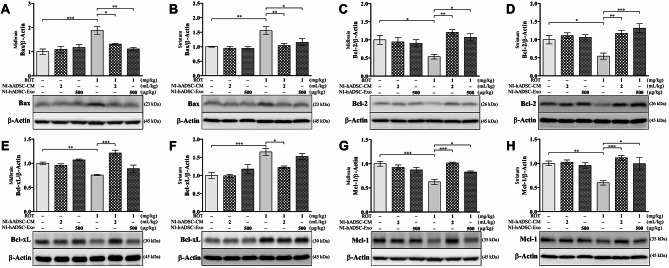
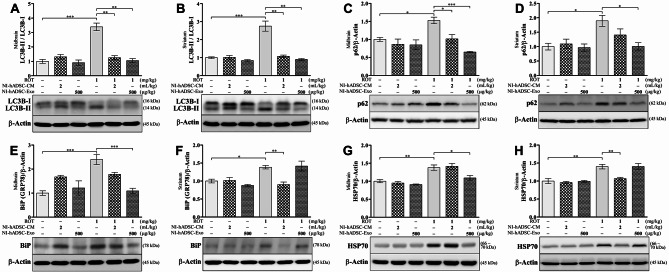
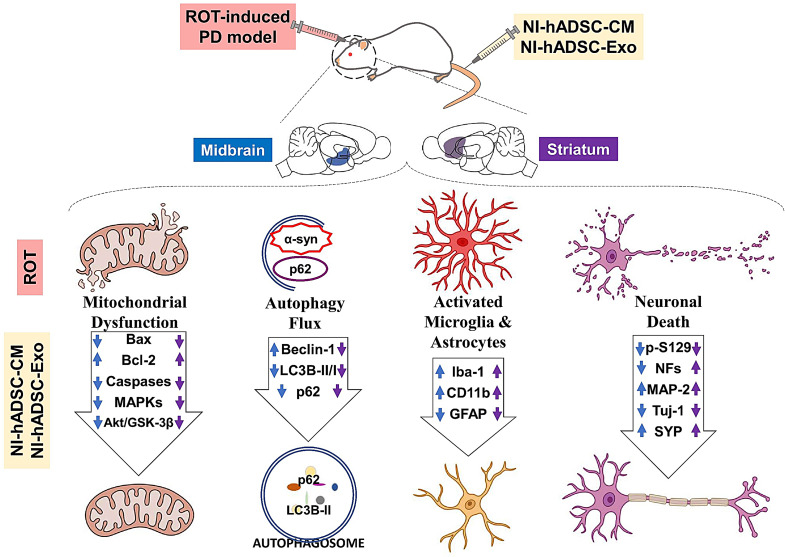
Results: NI-hADSC-Exo improved the motor balance and coordination skills against ROT toxicity. ROT reproduced the pathological features of PD, such as a decrease in TH-positive dopaminergic neurons and an increase in α-syn aggregation and glial fibrillary acidic protein (GFAP)-positive cells. NI-hADSC-CM and NI-hADSC-Exo improved the TH expression, decreased the Triton X-100 soluble and insoluble oligomeric p-S129 α-syn, and influenced the differential reactivity to astrocytes and microglia. Secretome treatment could reverse the ROT-induced damages in the neuronal structural and functional proteins, mitochondrial apoptosis, and caspase cascade. The treatment of NI-hADSC-CM and NI-hADSC-Exo ameliorated the ROT toxicity-induced serine-threonine protein kinase dysregulation and autophagy impairment to clear the aggregated α-syn.

Conclusions: NI-hADSC-CM and NI-hADSC-Exo significantly exerted neuroprotection by decreasing α-syn toxicity, inhibiting neuroinflammation and apoptosis, restoring autophagic flux properties, and promoting the neuronal function in ROT-injected rats; however, the influence of these treatments on signaling pathways differed slightly between the midbrain and striatum regions. Targeting α-syn degradation pathways provides a novel strategy to elucidate the beneficial effects of MSC secretome and future safe cell-free treatments for PD.

Keywords: Alpha-synuclein; Autophagy; Exosomes; Neuronal markers; Protein kinases.


Conflict of interest statement

Declarations. Ethical approval and consent to participate: Adipose tissues from human donors were collected in accordance with the guidelines approved by the Chonnam National University Hospital Biomedical Research Ethics Review Committee and that informed consent was obtained from the donors (title: Establishment of cell resources and specific therapeutic techniques for nervous system diseases using human mesenchymal stem cells, committee: Chonnam National University Hospital Institutional Review Board, approval number: CNUH IRB-I-2009-03-016, date of approval: 25 March 2009, expiration date: 2 September 2025). All animal experimental procedures were conducted in accordance with the ARRIVE guidelines and approved by the Animal Experiment Ethics Committee of the Chonnam National University Medical and Life Science Convergence Center (title: Stem Cell-derived New Drug Development, committee: Chonnam National University Institutional Animal Care and Use Committee, approval number: CNU IACUC-H-2022-36, date of approval: 4 May 2022, period: 8 May 2022 ~ 7 May 2023; title: Stem Cell-derived New Drug Development, committee: Chonnam National University Institutional Animal Care and Use Committee, approval number: CNU IACUC-H-2023-11, date of approval: 19 April 2023, period: 20 April 2023 ~ 19 April 2024). Consent for publication: Not applicable. Competing interests: The authors declare no competing interest.

Figures

Fig. 1
Fig. 1
Characterization of stem cells and their exosomes. (A) Morphological characteristics of primary hADSC and neural-induced hADSC (NI-hADSC). Magnification: 20×. (B) Protein expression levels of CD44, NF-M, MAP2, NSE, and GAPDH were detected in the cell lysates of hADSC (NI-hADSC-CL) and NI-hADSC (NI-hADSC-CL) by western blotting. (C) Representative cryo-TEM image of NI-hADSC-Exo. Scale bar: 200 nm. (D) NTA result shows the particle size and concentration of the NI-hADSC-Exo. (E) A single frame of NI-hADSC-Exo taken during NTA. (F) Protein expression levels of exosome surface positive markers (CD9, CD63, and CD81) and negative markers (Cyt c and GAPDH) were detected by western blotting. Full-length blots are presented in Supplementary Figure S12. n = 3
Fig. 2
Fig. 2
Experimental protocol schematic of in vivo rotenone (ROT), NI-hADSC-CM, and NI-hADSC-Exo treatments (A). The fold change in the body weight (B) and the fold change in the rotarod (C) were calculated for each group on days − 1, 7, 14, 21, and 28. Data were expressed as the mean ± SEM; n = 5. Statistical analysis was performed using two-way ANOVA followed by a Bonferroni post hoc test. Statistical significance: * p < 0.05, ** p < 0.01, and *** p < 0.001
Fig. 3
Fig. 3
Effects of NI-hADSC-CM and NI-hADSC-Exo against ROT on TH. (A) Representative images of the immunohistochemical evaluation of the TH protein expression in the midbrain (MB) of the rats. (B) Quantification of TH+ cells in the SN. (C ~ D) TH protein expression detected by western blotting in Triton X-100 insoluble (C) and soluble (D) fractions in the MB of rats. (E) Representative images of the immunohistochemical evaluation of the TH protein expression in the striatum (ST) of rats. (F-G) TH protein expression detected by western blotting in Triton X-100 insoluble (F) and soluble (G) fractions in the ST of rats. Full-length blots are presented in Supplementary Figure S13. Data were presented as the mean ± SEM; n = 4. Statistical analysis was performed using one-way ANOVA followed by Tukey’s post hoc test. Statistical significance: * p < 0.05, ** p < 0.01, and *** p < 0.001
Fig. 4
Fig. 4
Effects of NI-hADSC-CM and NI-hADSC-Exo against ROT on α-syn. (A) Representative images of the immunohistochemical evaluation of the p-S129 α-syn protein expression in the MB of rats. (B ~ G) Protein expression levels of p-S129 α-syn, total α-syn, and GAPDH were detected by western blotting in Triton X-100 insoluble and soluble fractions in the MB (B) and ST (E) of rats. The bar graphs represent the fold changes in the protein expression of the oligomers of p-S129 α-syn from Triton X-100 insoluble (C, F) and soluble (D, G) fractions from the MB (C,D) and ST (F, G) detected by western blotting. Full-length blots are presented in Supplementary Figure S14. Data were presented as the mean ± SEM; n = 4. Statistical analysis was performed using one-way ANOVA followed by Tukey’s post hoc test. Statistical significance: * p < 0.05, ** p < 0.01, and *** p < 0.001
Fig. 5
Fig. 5
Effects of NI-hADSC-CM and NI-hADSC-Exo on ROT-induced neuroinflammation in rats. (A) Representative images of the immunohistochemical evaluation of the GFAP protein expression in the astrocytes in the ST and MB sections. (B) Quantification of GFAP+ cells in the SN. (CH) Protein expression levels of GFAP (C, D), Iba-1 (E, F), and CD11b (G, H) in the MB (C, E, and G) and ST (D, F, and H) of rats by western blotting. Full-length blots are presented in Supplementary Figure S15. Data were presented as the mean ± SEM; n = 4. Statistical analysis was performed using one-way ANOVA followed by Tukey’s post hoc test. Statistical significance: * p < 0.05, ** p < 0.01, and *** p < 0.001
Fig. 6
Fig. 6
Effects of NI-hADSC-CM and NI-hADSC-Exo against ROT on DJ-1, TOM20, and MAP2 in rats. Protein expression levels of DJ-1 (A, B), TOM20 (C, D), and MAP2 (E, F) in the MB (A, C, and E) and ST (B, D, and F) of rats detected by western blotting. Full-length blots are presented in Supplementary Figure S16. Data were presented as the mean ± SEM; n = 4. Statistical analysis was performed using one-way ANOVA followed by Tukey’s post hoc test. Statistical significance: * p < 0.05, ** p < 0.01, and *** p < 0.001
Fig. 7
Fig. 7
Effects of NI-hADSC-CM and NI-hADSC-Exo against ROT on neurofilaments, neuronal nuclei, β3-tubulin, and synaptophysin in rats. Protein expression levels of NF-H (A, B), NF-M (C, D), and NF-L (E, F), NeuN (G, H), β3-tubulin (I, J), and SYP (K, L) in the MB (A, C, E, G, I, and K) and ST (B, D, F, H, J, and L) of rats detected by western blotting. Full-length blots are presented in Supplementary Figures S17 and S18. Data were presented as the mean ± SEM; n = 4. Statistical analysis was performed using one-way ANOVA followed by Tukey’s post hoc test. Statistical significance: * p < 0.05, ** p < 0.01, and *** p < 0.001
Fig. 8
Fig. 8
Effects of NI-hADSC-CM and NI-hADSC-Exo against ROT on Bcl-2 family proteins. Protein expression levels of Bax (A, B), Bcl-2 (C, D), Bcl-xL (E,F), and Mcl-1 (G, H) in the MB (A, C, E, and G) and ST (B, D, F, and H) of rats detected by western blotting. Full-length blots are presented in Supplementary Figure S19. Data were presented as the mean ± SEM; n = 4. Statistical analysis was performed using one-way ANOVA followed by Tukey’s post hoc test. Statistical significance: * p < 0.05, ** p < 0.01, and *** p < 0.001
Fig. 9
Fig. 9
Effects of NI-hADSC-CM and NI-hADSC-Exo against ROT on Cyt c and caspases. Protein expression levels of Cyt c (A, B), cleaved/pro caspase-9 (C, D), cleaved/pro caspase-3 (E,F), and cleaved/pro caspase-7 (G, H) in the MB (A, C, E, and G) and ST (B, D, F, and H) of the rats detected by western blotting. Full-length blots are presented in Supplementary Figure S20. Data were presented as the mean ± SEM; n = 4. Statistical analysis was performed using one-way ANOVA followed by Tukey’s post hoc test. Statistical significance: * p < 0.05, ** p < 0.01, and *** p < 0.001
Fig. 10
Fig. 10
Effects of NI-hADSC-CM and NI-hADSC-Exo against ROT on MAPKs, Akt, GSK-3β, and beclin-1. Protein expression levels of p/t-ERK (A, B), p-/t-SAPK (C, D), and p-/t-p38 (E, F), p/t-Akt (G, H), p-/t-GSK-3β (I, J), and beclin-1 (K, L) in the MB (A, C, E, G, I, and K) and ST (B, D, F, H, J, and L) in the rats as detected by western blotting. Full-length blots are presented in Supplementary Figures S21 and S22. Data were presented as the mean ± SEM; n = 4. Statistical analysis was performed using one-way ANOVA followed by Tukey’s post hoc test. Statistical significance: * p < 0.05, ** p < 0.01, and *** p < 0.001
Fig. 11
Fig. 11
Effects of NI-hADSC-CM and NI-hADSC-Exo against ROT on autophagy and HSPs. Protein expression levels of LC3B-II/LC3B-I (A, B), p62 (C, D), BiP (E,F), and HSP70 (G, H) in the MB (A, C, E, and G) and ST (B, D, F, and H) of the rats detected by western blotting. Full-length blots are presented in Supplementary Figure S23. Data were presented as the mean ± SEM; n = 4. Statistical analysis was performed using one-way ANOVA followed by Tukey’s post hoc test. Statistical significance: * p < 0.05, ** p < 0.01, and *** p < 0.001
Fig. 12
Fig. 12
Diagrammatic representation of the proposed mechanisms of the NI-hADSC-CM and NI-hADSC-Exo against ROT toxicity in various protein signaling pathways in the midbrain and striatum of rats. The downward (↓) and upward (↑) arrows denote inhibitions and stimulation, respectively

References

    1. Spillantini MG, Schmidt ML, Lee VM, Trojanowski JQ, Jakes R, Goedert M. Alpha-synuclein in lewy bodies. Nature. 1997;388:839–40. - PubMed
    1. Exner N, Lutz AK, Haass C, Winklhofer KF. Mitochondrial dysfunction in Parkinson’s disease: molecular mechanisms and pathophysiological consequences. EMBO J. 2012;31:3038–62. - PMC - PubMed
    1. Savitt JM, Dawson VL, Dawson TM. Diagnosis and treatment of Parkinson disease: molecules to medicine. J Clin Invest. 2006;116:1744–54. - PMC - PubMed
    1. Mehra S, Sahay S, Maji SK. alpha-Synuclein misfolding and aggregation: implications in Parkinson’s disease pathogenesis. Biochim Biophys Acta Proteins Proteom. 2019;1867:890–908. - PubMed
    1. Yamada M, Iwatsubo T, Mizuno Y, Mochizuki H. Overexpression of alpha-synuclein in rat substantia Nigra results in loss of dopaminergic neurons, phosphorylation of alpha-synuclein and activation of caspase-9: resemblance to pathogenetic changes in Parkinson’s disease. J Neurochem. 2004;91:451–61. - PubMed

MeSH terms

LinkOut - more resources