. 2025 Apr 20;16(1):3738.
doi: 10.1038/s41467-025-58987-w.

A dynamically phase-adaptive regulating hydrogel promotes ultrafast anti-fibrotic wound healing

Affiliations

A dynamically phase-adaptive regulating hydrogel promotes ultrafast anti-fibrotic wound healing

Fan Zhang et al. Nat Commun. .

Abstract

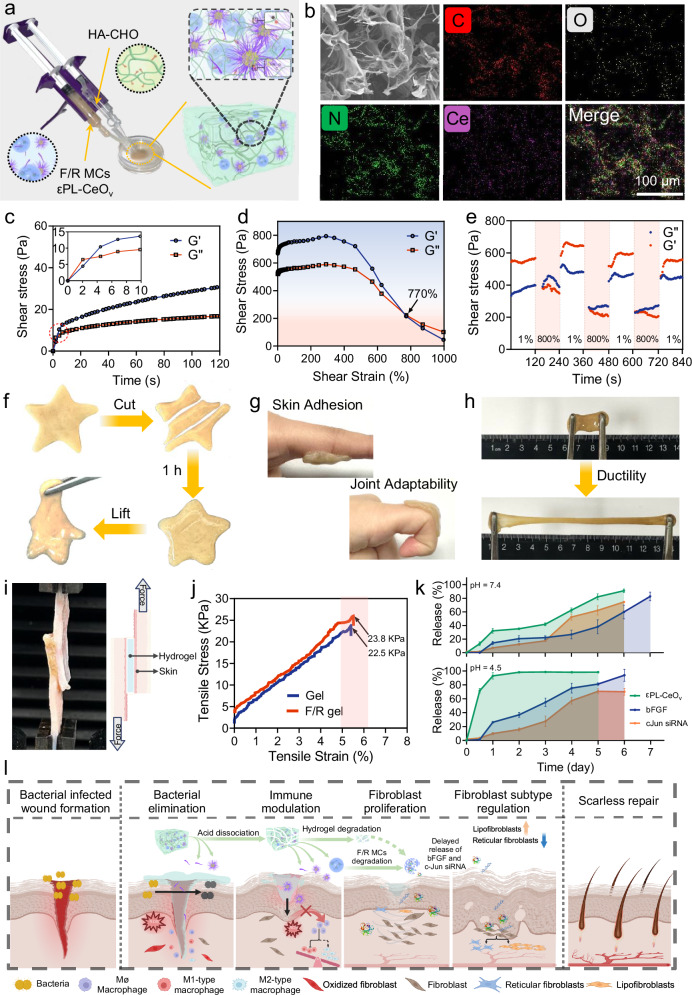
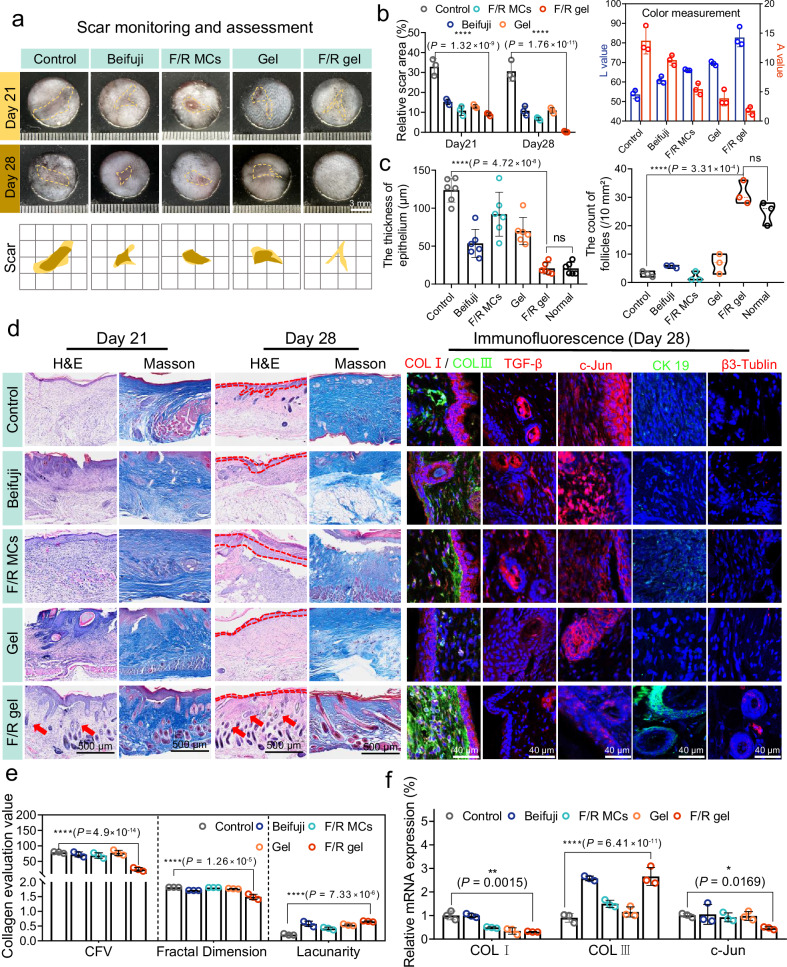
Achieving rapid and scar-free wound repair is a key goal in the field of regenerative medicine. Herein, a dynamically Schiff base-crosslinked hydrogel (F/R gel) with phase-adaptive regulating functions is constructed to integratedly promote rapid re-epithelization with suppressed scars on chronic infected wounds. Specifically, the gel effectively eliminates multidrug-resistant bacterial biofilm at infection stage via antimicrobial activity of ε-polylysine firstly dissociated from hydrogel matrix in infectious microenvironment, and interrupts the severe oxidative stress-inflammation cycle at wound site by the released ceria nanozyme, thus stimulating a pro-regenerative environment to ensure tissue repair. Subsequently, fibroblast growth factor/c-Jun siRNA co-loaded microcapsules gradually disintegrate to release drugs, facilitating neoangiogenesis and cell proliferation but simultaneously blocking c-Jun overexpression for fibrotic scar suppression. Notably, the F/R gel facilitates normal-like skin regeneration with no perceptible scars formed on infected male mouse wound and female rabbit ear wound models. Our work offers a promising regenerative strategy emphasizing immunomodulatory and fibroblast subtype modulation for scarless wound repair.


Conflict of interest statement

Competing interests: The authors declare no competing interests.

Figures

Fig. 1
Fig. 1. Schematic diagram of F/R gel’s design for regulating scarless wound healing, and characterization of the gel components.
a Illustration of F/R gel preparation for programmed regulation on chronic infected wounds. b TEM image, c HRTEM image and the corresponding lattice analysis of CeOv nanoparticles. d SEM image of F/R MCs. e Representative CLSM image of F/R MCs. FITC-labeled bFGF and FAM-labeled siRNA (green) were loaded in Nile red-labeled PLGA microcapsules (red). f Fluorescence staining of c-Jun expression (green) in 3T3 cells. Three independent experiments were performed, and representative results are shown in b-f.
Fig. 2
Fig. 2. Characterization of F/R gel.
a Schematic illustration of the gel preparation. b SEM image and elemental distribution in F/R gel. c Representative time sweep rheological plots of F/R gel. d G′ and G′′ on strain sweep. e Rheological variation of F/R gel when alternate step strain switched from 1% to 800%. Representative photographs of the gel’s (f) self-healing process, (g) adhesion, and (h) stretchable property. i Representative pictures (illustration was created with BioRender.com) and (j) tensile strain test using porcine skin. k In vitro release properties of F/R gel’s components in neutral PBS (pH = 7.4) and acidic PBS (pH = 4.5) (n = 3 independent samples, and data are presented as mean ± SD). l Graphical representation of the F/R gel’s dynamically phase-adaptive regulating functions for scarless wound healing process (created with BioRender.com). Three independent experiments were performed, and representative results are shown in b, f–g.
Fig. 3
Fig. 3. In vitro antibacterial and anti-biofilm activities of F/R gel.
a Representative images of bacteria colonies and live/dead staining assay after different treatments as indicated. b Statistical analysis of the colony counts and live/dead bacteria (n = 3 independent samples). c SEM images of the bacteria before and after F/R gel treatment (red arrows indicate rupture changes in cell wall). d Experimental illustration of biofilm destruction effect by F/R gel (created with BioRender.com). e Crystalline violet staining and live/dead bacteria staining images of mature biofilms after various treatments. f Biofilm evaluation values (including average thickness and biomass) of mature biofilms (n = 3 independent samples). g Green fluorescence intensity versus biofilm depth quantified from CLSM planes in e. Three independent experiments were performed and representative results are shown in a, c, e. Data are presented as mean ± SD and statistical significance was analyzed via one-way ANOVA with Tukey’s multiple comparison test. P value: *P < 0.05, **P < 0.01, ***P < 0.001, ****P < 0.0001.
Fig. 4
Fig. 4. In vitro antioxidant activity and DFT calculation.
a Diagram for ROS scavenging ability of F/R gel. Scavenging tests of F/R gel on (b) ABTS free radical, (c) DPPH free radical, (d) hydrogen peroxide, (e) hydroxyl free radical, and (f) superoxide anion (n = 3 independent samples, and data are presented as mean ± SD). g Particle model for the oxygen-deficient CeOv nanozyme and its unit cell configurations. h Simulated electron density mapping images of CeO2 (upper panel) and CeOv (bottom panel). Red dashed circle indicates surface oxygen vacancy. i Top view for the optimized structures of ABTS+•, DPPH•, H2O2, •OH, and •O2- free radicals adsorbed on CeOv (111) facets. The corresponding Ebinding values are indicated. j Reaction energy profiles for the simulated SOD-like and CAT-like catalytic processes on CeOv (111) facets. The optimized structures of key intermediate steps are shown as insets.
Fig. 5
Fig. 5. Intracellular oxidative stress eliminating, macrophage polarization effect, and biocompatibility assessment of F/R gel.
a Experimental illustration of cell experiments (created with BioRender.com). b Flow cytometry of DCFH-DA fluorescence on 3T3 and HUVEC cells. c Statistical data of intracellular DCFH-DA fluorescent intensity (n = 3 independent samples). d Fluorescence images of DCFH-DA probe (green), HPF probe (green), and live/dead cell staining assay (Calcein, green and PI, red) on 3T3 cells. e The corresponding statistical analysis (n = 3 independent samples). f Flow cytometry of CD86 marker on macrophages and g the corresponding statistical data (n = 3 independent samples). h Microscopic images of red blood cells and i hemolysis rates upon various treatments (n = 3 independent samples). j Experimental illustration of subcutaneous implantation test (created with BioRender.com). k H&E staining images of skin tissues after F/R gel implantation for 28 days. l Blood routine and biochemical indexes (n = 3 biologically independent samples). Three independent experiments were performed and representative results are shown in b, d, f, h, i, k. Data are presented as mean ± SD and statistical significance was analyzed via one-way ANOVA with Tukey’s multiple comparison test. P value: *P < 0.05, **P < 0.01, ***P < 0.001, ****P < 0.0001.
Fig. 6
Fig. 6. In vivo rapid healing effect of F/R gel on mouse MRSA-infected chronic wounds.
a Experimental process of the whole animal experiments on mice (created with BioRender.com). b Optical photos and simulated graphs of wound closure changes from day 0 to day 14. c Variation curve of wound areas within 14 days (n = 3 biologically independent samples). d Colony counting assay using wound exudates on day 2–7 (n = 3 independent samples) and (e) representative images. f Immunofluorescent staining of DHE (red), CD86 (green), CD206 (red), CD31 (red), VEGF (red), Ki67 (green) and DAPI (blue), H&E staining, and Masson staining images of wound tissues during wound healing. Red arrows mark the newborn hair follicles. g Relative mRNA expressions of CD86, iNOS, IL-1β, TNF-α, CD206, Arg1, IL-10, and Ki67 (n = 3 biologically independent samples). Three independent experiments were performed and representative results are shown in b, e, f. Data are presented as mean ± SD and statistical significance was analyzed via two-way ANOVA with Tukey’s multiple comparison test. P value: *P < 0.05, **P < 0.01, ***P < 0.001, ****P < 0.0001.
Fig. 7
Fig. 7. F/R gel alleviates fibrotic scar formation of MRSA-infected chronic wounds on mice.
a Optical photos and simulated graphs of scar area changes from day 21 to 28. b Scar changing curve and color analysis of scar tissues post-treatments (a higher L value represents a whiter color, and a higher A value represents a redder color) (n = 3 biologically independent samples). c Epidermal thickness (n = 6 biologically independent samples) and count of follicles (n = 3 biologically independent samples) analyzed by H&E staining on day 28. d H&E staining, Masson’s staining, and immunofluorescent staining of COL I (red), COL III (green), TGF-β (red), c-Jun (red), CK19 (green), β3-Tublin (red) and DAPI (blue) images of wound tissues on day 21 to 28. e Collagen volume ratio, fractal dimension value, and lacunarity value based on the tissue slice analysis (n = 3 biologically independent samples). f Relative mRNA expressions of COL I, COL III, and c-Jun on day 28 (n = 3 biologically independent samples). Three independent experiments were performed and representative results are shown in a, d. Data are presented as mean ± SD and statistical significance was analyzed via two-way ANOVA with Tukey’s multiple comparison test. P value: *P < 0.05, **P < 0.01, ***P < 0.001, ****P < 0.0001.
Fig. 8
Fig. 8. Potential regulatory mechanisms at cellular-molecular level analyzed by FACS and transcriptome sequencing measurements.
a Schematic process of FACS experiment on wound tissues (created with BioRender.com). b Fluorescence-activated cell sorting results of fibroblast subtypes in wound tissues (n = 3 biologically independent samples). c Schematic diagram of fibroblast subtype regulated by c-Jun silencing strategy (created with BioRender.com). d Immunofluorescent staining images of α-SMA (green) and Sca-1 (red) markers in wound tissues on day 7, 14, and 28. e Mean fluorescent intensity of α-SMA and Sca-1 signals (n = 3 biologically independent samples). f Heatmap of Pearson’s correlation coefficient matrix for tested samples. g The corresponding volcano plots analyzed on day 14 between F/R gel and Control groups. h Heatmaps of the screened differentially expressed genes involved in healing process. i KEGG enrichment and (j) GO enrichment analysis of the differentially expressed genes. Three independent experiments were performed and representative results are shown in b, d. Data are presented as mean ± SD and statistical significance was analyzed via two-way ANOVA with Tukey’s multiple comparison test. P value: *P < 0.05, **P < 0.01, ***P < 0.001, ****P < 0.0001.
Fig. 9
Fig. 9. Scarless healing effect of F/R gel on rabbit ear hyperplasia wounds.
a Experimental illustration for modeling process of rabbit ear wounds infected with MRSA and the following animal experiments (created with BioRender.com). b Optical photos, simulated graphs, and c statistical data of wound healing changes from day 0 to 28 (n = 3 biologically independent samples). d Schematic diagram of the evaluation indicators related to scarring effect on rabbit ears. e Statistical data of SEI, scar thickness, scar bulge angle and color measurement (n = 3 biologically independent samples). f Ultrasonography (red dotted lines indicate hyperplastic scarring area), H&E staining, and Masson’s staining images of the rabbit ear wound tissues. g Analysis of collagen orientation distribution based on Masson’s staining images in f. Three independent experiments were performed and representative results are shown in b, f, g. Data are presented as mean ± SD and statistical significance was analyzed via two-way ANOVA with Tukey’s multiple comparison test. P value: *P < 0.05, **P < 0.01, ***P < 0.001, ****P < 0.0001.

References

    1. Powers, J. G. et al. Wound healing and treating wounds: Chronic wound care and management. J. Am. Acad. Dermatol.74, 607–625 (2016). - PubMed
    1. Falanga, V. et al. Chronic wounds. Nat. Rev. Dis. Prim.8, 50 (2022). - PMC - PubMed
    1. Chittleborough, C. R. et al. The increasing prevalence of diabetes in South Australia: the relationship with population ageing and obesity. Public. Health121, 92–99 (2007). - PubMed
    1. Blanco-Fernandez, B. et al. Nanotechnology Approaches in Chronic Wound Healing. Adv. Wound Care. (N. Rochelle)10, 234–256 (2021). - PMC - PubMed
    1. Li, H., Cheng, B. & Zhang, C. Editorial: Wound repair: establishment and development of a new discipline in China. Front. Surg.10, 1207709 (2023). - PMC - PubMed

LinkOut - more resources