. 2025 Apr 20;16(1):3734.
doi: 10.1038/s41467-025-59010-y.

PI3K-Akt signalling regulates Scx-lineage tenocytes and Tppp3-lineage paratenon sheath cells in neonatal tendon regeneration

Affiliations

PI3K-Akt signalling regulates Scx-lineage tenocytes and Tppp3-lineage paratenon sheath cells in neonatal tendon regeneration

Atsushi Goto et al. Nat Commun. .

Abstract

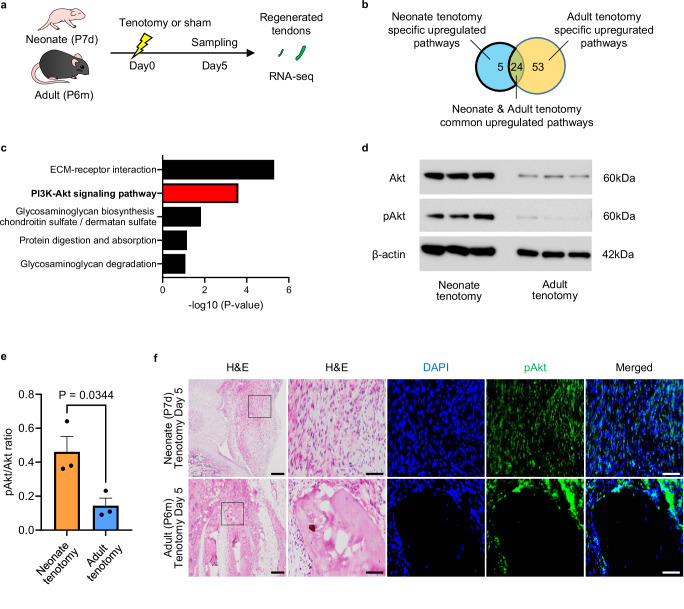
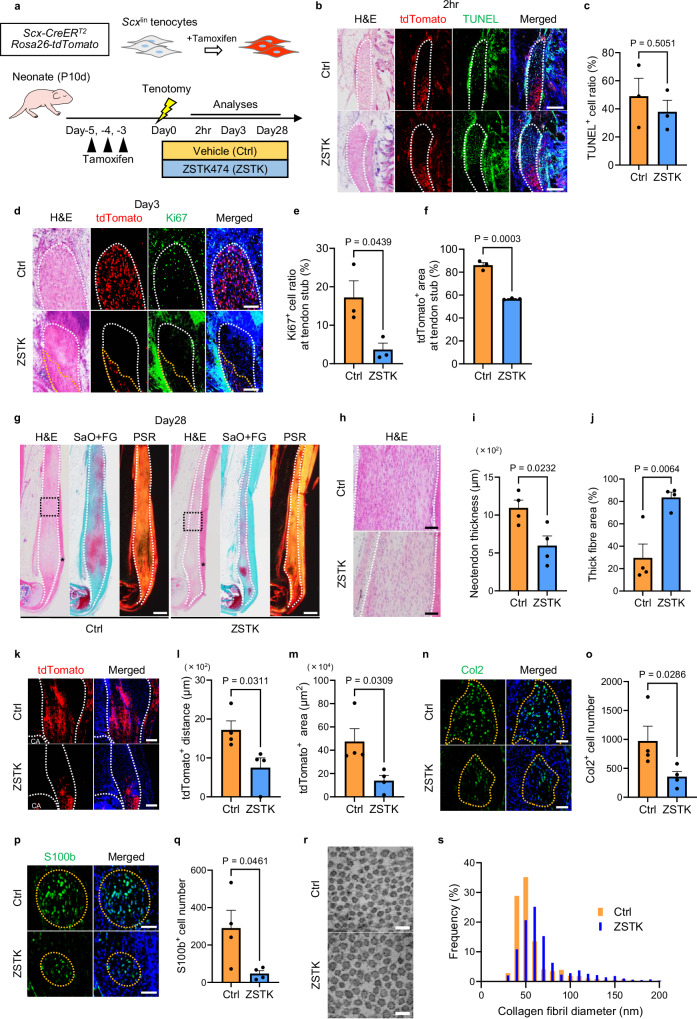
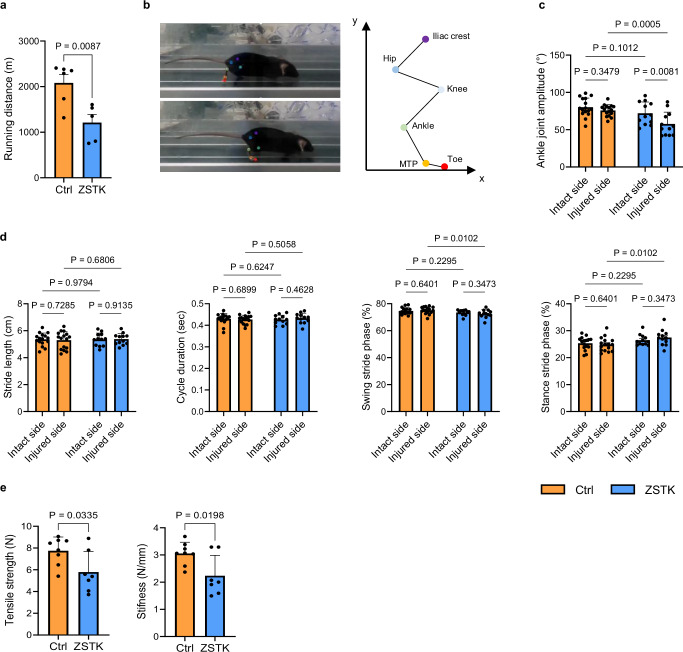
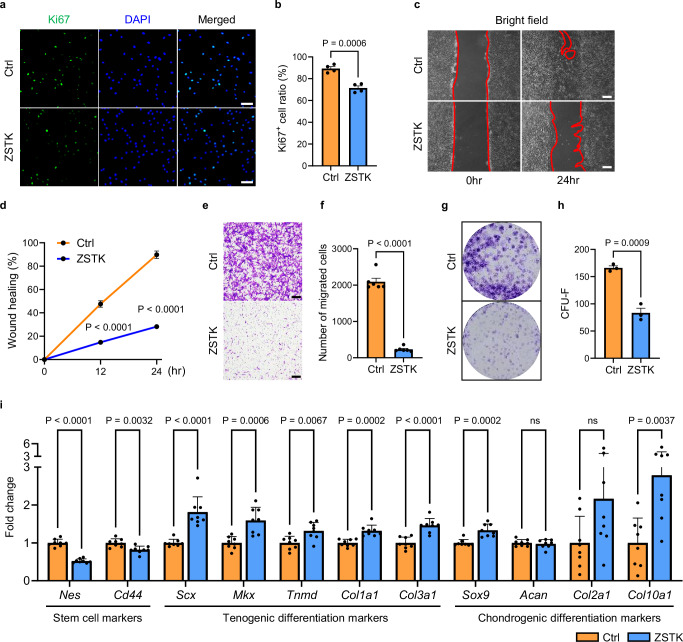
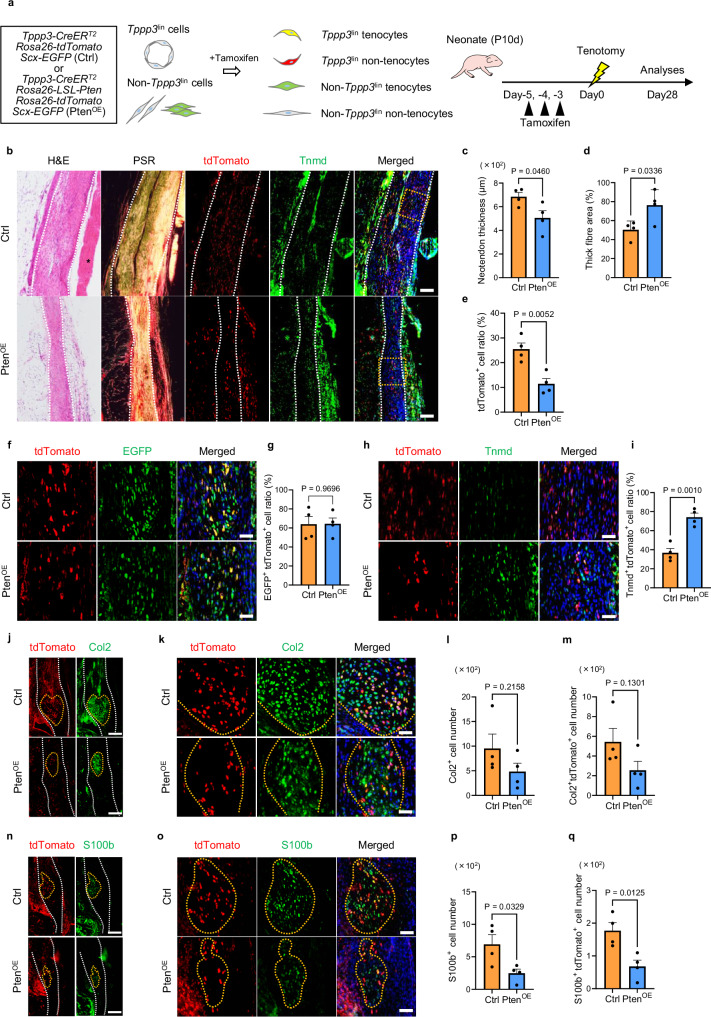
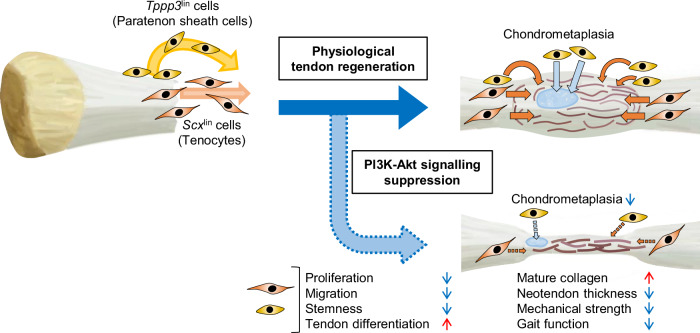
Tendon injuries are frequently occurring disorders; it is clinically important to enhance tendon regeneration and prevent functional impairment post-injury. While tendon injuries in children heal quickly with minimal scarring, those in adults heal slowly and are accompanied by fibrotic scarring. Therefore, investigating the healing mechanisms after tendon injury, and identifying the factors that regulate the inherent regenerative capacity of tendons are promising approaches to promoting tendon regeneration. Here, we identify that the PI3K-Akt signalling pathway is preferentially upregulated in injured neonatal murine Achilles tendons. Inhibition of PI3K-Akt signalling in a neonatal murine Achilles tendon rupture model decreases cell proliferation and migration in both Scx-lineage intrinsic tenocytes and Tppp3-lineage extrinsic paratenon sheath cells. Moreover, the inhibition of PI3K-Akt signalling decreases stemness and promotes mature tenogenic differentiation in both Scx- and Tppp3-lineage cells. Collectively, these results suggest that PI3K-Akt signalling plays a pivotal role in neonatal tendon regeneration.


Conflict of interest statement

Competing interests: The authors declare no competing interests.

Figures

Fig. 1
Fig. 1. PI3K-Akt signalling pathway is specifically activated in injured tendons of neonatal mice.
a Schematic of the sample collection protocol for RNA-sequence analysis. The 7-day-old (P7d) or 6-month-old (P6m) Scx-EGFP mice underwent Achilles tenotomy on the right hind limb (tenotomy group) and a sham operation (sham group) on the left hind limb. Injured and uninjured Achilles tendons were collected 5 days later. Five to eleven individual samples were pooled in each group and used in the RNA-sequencing analysis (7-day sham, n = 11; 7-day cut, n = 11; 6-month sham, n = 5; 6-month cut, n = 9). b KEGG pathway analyses for the neonatal and adult tenotomy groups; 29 and 77 upregulated pathways were identified in neonatal and adult tenotomy groups, respectively. A Venn diagram comparing the upregulated pathways between the neonatal and adult tenotomy groups shows five specifically upregulated pathways in neonatal mice. c The five specifically upregulated pathways in the neonatal tenotomy group. d Western blot analysis of injured neonatal (P7d) and adult (P6m) tendons on post-tenotomy day 5. Three independent samples were analysed in neonatal and adult mice. e Quantification of the pAkt/Akt ratio shown in (d). Akt phosphorylation (pAkt) was higher in neonates than in adults. Data are shown as the mean ± SEM of three independent samples in each group (two-tailed Student’s t test; P = 0.0344). f Haematoxylin-eosin staining (H&E) and fluorescent immunohistochemistry of pAkt in the injured neonatal (P7d) and adult (P6m) tendons on post-tenotomy day 5. The black square areas in the left panels are enlarged. Strong pAkt expression was observed at the distal stub of the neonatal injured tendon. Scale bars, 200 μm and 50 μm.
Fig. 2
Fig. 2. PI3K-Akt signalling is involved in the proliferation, migration, stemness, and tenogenic differentiation of tenocytes in vitro.
a Immunocytochemical staining using a Ki67 antibody for tenocytes treated with vehicle (control; Ctrl) or the PI3K inhibitor ZSTK474 (ZSTK). b Ki67 positive cell ratio of tenocytes in (a) (n = 3 independent experiments). The ZSTK group showed significantly decreased cell proliferation compared with the control group (two-tailed Student’s t test; p = 0.0095). c The scratch test was used to assess the migration capacity of tenocytes treated with vehicle or ZSTK. d Quantification of the wound healing rate shown in (c) (n = 6 independent experiments). The ZSTK group showed significantly decreased cell migration (two-tailed Student’s t test; P < 0.0001 at 12 h, and P < 0.0001 at 24 h). e Transwell assay was used to assess the migration capacity of tenocytes after treatment with vehicle or ZSTK. Analyses were performed 24 h after seeding. f Quantification of migrated cells shown in (e) (n = 6 independent experiments). The ZSTK group showed significantly decreased cell migration (two-tailed Student’s t-test; p < 0.0001). g CFU-F assay was used to assess the self-renewal capacity of tenocytes treated with vehicle or ZSTK. Analyses were performed 7 days after seeding. h Quantification of colony formation unit numbers shown in (g) (n = 3 independent experiments). The ZSTK group showed significantly decreased colony formation compared to the control group (two-tailed Student’s t test; p = 0.0002). i RT-qPCR was used to compare RNA expression in tenocytes between the control and ZSTK groups. Nes expression was significantly decreased in the ZSTK group. Expression of tenocyte tendon differentiation markers (Scx, Mkx, Tnmd, Col1a1, and Col3a1) was significantly increased in the ZSTK group. Expression of chondrogenic markers (Sox9 and Acan) was significantly decreased in the ZSTK group (two-tailed Student’s t-test, n = 8 independent experiments). *Data are presented as mean ± SEM. Scale bars, 100 μm (a), 200 μm (c), 400 μm (e).
Fig. 3
Fig. 3. PI3K-Akt signalling is involved in tenocyte proliferation and migration in the early regenerative phase, and tendon thickening and chondrometaplasia in the late regenerative phase after tendon injury in vivo.
a Experimental scheme for evaluating tendon regeneration in vivo. Scx-CreERT2; Rosa26-tdTomato mice were injected with 0.075 mg of tamoxifen three times. Tamoxifen was washed out for 72 h, and tenotomy was performed (P 10-day). Vehicle (control; Ctrl) or ZSTK474 (ZSTK) was administered and evaluated 2 h, 3 d, and 28 d later. b Haematoxylin-eosin staining (H&E) and TUNEL staining of the Achilles tendon stub 2 h after tenotomy. Scx-lineage cells [tdTomato-positive (tdTomato+) cells] were stained with an RFP antibody. White dotted lines indicate the distal tendon stub. c Quantification of TUNEL-positive (TUNEL+) cells shown in (b). Data are shown as the mean ± SEM of three independent biological samples (three independent sections per mouse). A two-tailed Student’s t-test was used for statistical analyses. There was no significant difference in the number of apoptotic cells in tendon stubs between the control and ZSTK groups. d H&E and immunofluorescence staining using RFP and Ki67 antibodies for the Achilles tendon stub was performed 3 days post-tenotomy. The distal tendon stub is indicated by white dotted lines, while the tdTomato+ tendon area is indicated by yellow dotted lines. e Quantification of the percentage of Ki67 positive (Ki67+) cells shown in (d). Data are shown as the mean ± SEM of three independent biological samples (three independent sections per mouse). The percentage of Ki67+ cells significantly decreased in the ZSTK group (two-tailed Student’s t-test; p = 0.0439). f Quantification of the area of the tendon with tdTomato-positive (tdTomato+) cells shown in (d). Data are shown as the mean ± SEM of three independent biological samples (three independent sections per mouse). The ZSTK group showed a significantly smaller tdTomato+ area at the tendon stub than the control group (two-tailed Student’s t-test; p = 0.0003), indicating that the migration of tdTomato+ cells decreased. g Haematoxylin-eosin staining (H&E), Safranin O and fast green staining (SaO+FG), and Picrosirius Red (PSR) staining of Achilles tendons 28 days after tenotomy. The regenerated tendons and intact plantaris tendons are indicated by white dotted lines and black asterisks, respectively. h Magnified images of the black dotted squares in (g). i Quantification of neotendon thickness shown in (g). Data are shown as the mean ± SEM of four independent biological samples (two independent sections per mouse). The transverse diameter of the thickest part of the regenerated tendon, excluding distal and proximal tendon stubs, was measured as neotendon thickness. The ZSTK group showed a significant decrease in neotendon thickness compared with the control group (two-tailed Student’s t-test; p = 0.0232). j Percentage of thick fibres in the neotendon. The thick fibre area was measured in PSR staining sections. Data are shown as the mean ± SEM of four independent biological samples (two independent sections per mouse). The ZSTK group had a significantly higher percentage of thick fibres than the control group (two-tailed Student’s t-test; p = 0.0064). k Immunofluorescence staining was performed using an RFP antibody at the boundary between the regenerated tendon and the remaining distal tendon stub at 28 days after tenotomy. Lower migration of tdTomato+ cells into the regenerated tendons was observed in the ZSTK group than in the control group. CA; calcaneus. l Quantification of the distance of proximally migrating tdTomato-positive (tdTomato+) cells in neotendons shown in (k). The distance between the most proximal tdTomato+ cell and the calcaneus was measured. Data are shown as the mean ± SEM of four independent biological samples (three independent sections per mouse). The distance in the ZSTK group was significantly smaller than that in the control group (two-tailed Student’s t-test; p = 0.0311). m Quantification of the area with tdTomato+ cells shown in (k). Data are shown as the mean ± SEM of four independent biological samples (three independent sections per mouse). The area of tdTomato+ cells in the ZSTK group was significantly smaller than that in the control group (two-tailed Student’s t-test; p = 0.0309). n Immunofluorescence staining using the Col2 antibody. Yellow dotted circles indicate Col2 positive (Col2+) chondrometaplastic regions in regenerated tendons. o Quantification of the number of Col2+ cells shown in (n). Data are shown as the mean ± SEM of four independent biological samples (three independent sections per mouse). The number of Col2+ cells significantly decreased in the ZSTK group compared to the control groups (two-tailed Mann Whiteny-U test, p = 0.0286). p Immunofluorescence staining using the S100b antibody. Yellow dotted circles indicate S100b positive (S100b+) chondrometaplastic regions in regenerated tendons. q Quantification of the number of S100b+ cells shown in (p). Data are shown as the mean ± SEM of four independent biological samples (three independent sections per mouse). The number of S100+ cells significantly decreased in the ZSTK group compared to the control groups (two-tailed Student’s t-test, p = 0.0461). r Transmission electron microscope (TEM) pictures showing collagen fibrils in the neotendon at 28 days after tenotomy. s Distribution of the collagen fibril diameter in the neotendon. The diameter of 1000 collagen fibrils was measured in TEM pictures shown in (r) (three independent biological samples in each group). Collagen fibril diameter in the ZSTK group tends to be larger than that in the Ctrl group. * Scale bars, 100 nm (s), 50 μm (n, p), 100 μm (d, h), 200 μm (b, k), 400 μm (g).
Fig. 4
Fig. 4. PI3K-Akt signalling is involved in functional and mechanical properties of the neotendons in the late regenerative phase after tendon injury in vivo.
a Running distance of the mice at 28 days after tenotomy. The mice in the ZSTK group showed significantly shorter running distances than those in the Ctrl group (Ctrl, n = 6; ZSTK, n = 5) (two-tailed Student’s t-test, p = 0.0087). b Treadmill videos were recorded using an iPhone positioned parallel to the treadmill belt. According to the Automated Limb Motion Analysis (ALMA) method, the coordinates of six hindlimb joints (iliac crest, hip, knee, ankle, metatarsophalangeal (MTP) joint, and toe) were tracked in the treadmill kinematic paradigm, and the coordinates were processed using the ALMA toolbox to generate hindlimb trajectories. c Ankle joint amplitude (range of motion angles) during running at 28 days after tenotomy. In the ZSTK group, the angle on the injured side was significantly decreased compared to that on the intact side (p = 0.0081). In contrast, in the Ctrl group, the angle on the injured side remained unchanged compared to that on the intact side (p = 0.3479). Moreover, the angle on the injured side in the ZSTK group was significantly smaller than that on the injured side the Ctrl group (p = 0.0005) (Ctrl, n = 16; ZSTK, n = 12, two-way ANOVA test). d Gait analyses at 28 days after tenotomy. Stride length and cycle duration were comparable between the two groups. Compared to the Ctrl group, the stance phase of the injured side was significantly prolonged, and the swing phase was significantly shortened in the ZSTK group (Ctrl, n = 16; ZSTK, n = 12) (two-way ANOVA test, p = 0.0102 and 0.0102, respectively). e Biomechanical test of the regenerated tendons at 28 days after tenotomy. Tensile strength (N) and stiffness (N/mm) in the ZSTK group were significantly lower compared to the Ctrl group (Ctrl, n = 8; ZSTK, n = 7) (two-tailed Student’s t-test, p = 0.0335 and 0.0198, respectively).
Fig. 5
Fig. 5. Scx-lineage cell-specific suppression of PI3K-Akt signalling resulted in decreased migration and chondrometaplasia of Scx-lineage cells in vivo.
a Schematic representation of the experiment. To investigate Scx-lineage (Scxlin) cell-specific suppression of the PI3K-Akt signalling pathway, Scx-CreERT2; Rosa26-tdTomato; Scx-EGFP (Ctrl), Scx-CreERT2; Rosa26-loxP-stop-loxP-Pten (Rosa26-LSL-Pten); Rosa26-tdTomato; Scx-EGFP (PtenOE) mice were used. After tamoxifen injection, Scx-lineage (Scxlin) cell-specific overexpression of Pten is induced. Yellow and red fluorescence indicates Scxlin tenocyte and non-tenocyte, respectively, whereas green and non-fluorescence indicate non-Scxlin tenocyte and non-tenocyte. Mice were injected with tamoxifen (0.075 mg) three times. Tamoxifen was washed out for 72 h, and subsequently, a tenotomy was performed (P 10-day) and evaluated 28 days later. b Haematoxylin-eosin (H&E), picrosirius red (PSR), and immunofluorescent staining of regenerated tendons 28 days after tenotomy. RFP and GFP antibodies were used for immunofluorescence analysis. Regenerated tendons and tendon stubs are indicated by white dotted lines. Intact plantaris tendons are indicated by asterisks. CA; calcaneus. c Quantification of the area with tdTomato-positive cells (Scxlin cells) shown in (b). Data are shown as the mean ± SEM of four independent biological samples (three independent sections per mouse). The area of tdTomato+ cells significantly decreased in the PtenOE group (two-tailed Student’s t-test; p = 0.0011). d Quantification of the distance of proximally migrating Scxlin cells in the neotendons shown in (b). Data are shown as the mean ± SEM of four independent biological samples (three independent sections per mouse). The distance in the PtenOE group was significantly smaller than that in the control group (two-tailed Student’s t-test; p = 0.0159). e Quantification of neotendon thickness shown in (b). Data are shown as the mean ± SEM of four independent biological samples (three independent sections per mouse). No significant differences were observed between the two groups (two-tailed Student’s t-test). f Magnified images of the yellow dotted squares (b). g The quantification of the EGFP-positive (EGFP+) cell ratio in the neotendons shown in (f). Data are shown as the mean ± SEM of four independent biological samples (three independent sections per mouse). The percentage of EGFP+ cells was significantly increased in the PtenOE group (two-tailed Student’s t-test; p = 0.0215). h Immunofluorescent staining at regenerated tendons using RFP and Tnmd antibodies. i Quantification of the Tnmd-positive (Tnmd+) cell ratio in the neotendons shown (h). Data are shown as the mean ± SEM of four independent biological samples (two independent sections per mouse). No significant difference in the percentage of Tnmd+ cells was observed between the Ctrl and PtenOE groups (two-tailed Student’s t-test; p = 0.3963). j Immunofluorescent staining using RFP and Col2 antibodies in the chondrometaplasia region is indicated by yellow dotted lines. k Magnified images of Fig. 5j. l Quantification of the number of Col2+ cells in regenerative tendons shown in (j). Data are shown as the mean ± SEM of four independent biological samples (three independent sections per mouse). No significant differences were observed between the two groups (two-tailed Student’s t-test, p = 0.4649). m Quantification of the number of Col2+ Scxlin (tdTomato+) cells in the regenerative tendons shown in (j). Data are shown as the mean ± SEM of four independent biological samples (three independent sections per mouse). Chondrometaplasia derived from Scxlin cells (tdTomato+ cells) significantly decreased in the PtenOE group (two-tailed Student’s t-test, p = 0.0286). n Immunofluorescent staining using RFP and S100b antibodies. Yellow dotted circles indicate chondrometaplasia. o Magnified images of Fig. 5n. p Quantification of the number of S100b+ cells in regenerative tendons shown in (n). Data are shown as the mean ± SEM of four independent biological samples (three independent sections per mouse). No significant differences were observed between the two groups (two-tailed Student’s t-test). q Quantification of the number of the S100b+ Scxlin (tdTomato+) cells in the regenerative tendons shown in (n). Data are shown as the mean ± SEM of four independent biological samples (three independent sections per mouse). Chondrometaplasia derived from Scxlin cells (tdTomato+ cells) significantly decreased in the PtenOE group (two-tailed Student’s t-test, p = 0.0427). * Scale bars, 50 μm (f, h, k, o), 200 μm (b, j, n).
Fig. 6
Fig. 6. PI3K-Akt signalling is involved in the proliferation, migration, stemness, and tenogenic differentiation of paratenon sheath cells in vitro.
a Immunocytochemical staining using Ki67 antibody for paratenon sheath cells treated with vehicle (control; Ctrl) or ZSTK474 (ZSTK). b Ki67 positive cell ratio of paratenon sheath cells in (a) (n = 4 independent experiments). The ZSTK group showed significantly decreased cell proliferation relative to the control group (two-tailed Student’s t-test; p = 0.0006). c The scratch test was used to assess the migration capacity of the paratenon sheath cells treated with vehicle or ZSTK. d Quantification of the wound healing rate shown in (c) (n = 6 independent experiments). The ZSTK group showed significantly decreased cell migration (two-tailed Student’s t-test; p < 0.0001 at 12 h, and p < 0.0001 at 24 h). e Transwell assay was used to assess the migration capacity of paratenon sheath cells treated with vehicle or ZSTK. Analyses were performed at 24 h after seeding. f Quantification of migrated cells shown in (e) (n = 6 independent experiments). The ZSTK group showed significantly decreased cell migration (two-tailed Student’s t-test; p < 0.0001). g CFU-F assay was used to assess the self-renewal capacity of paratenon sheath cells treated with Vehicle or ZSTK. Analyses were performed seven days after seeding. h Quantification of colony formation units shown in (g) (n = 3 independent experiments). The ZSTK group showed significantly decreased colony formation compared to the control group (two-tailed Student’s t-test; p = 0.0009). i Real-time quantitative reverse transcription polymerase chain reaction (RT-qPCR) was used to evaluate RNA expression in paratenon sheath cells in the control and ZSTK groups. Expression of tendon stem cell markers, Nes and Cd44, was significantly decreased in the ZSTK group. Expression of tendon differentiation markers (Scx, Mkx, Tnmd, Col1a1, and Col3a1) was significantly increased in the ZSTK group. Expression of chondrogenic markers (Sox9 and Col10a1) was significantly increased in the ZSTK group (two-tailed Student’s t-test, n = 8 independent experiments). * Data are presented as mean ± SEM. Scale bars, 100 μm (a), 200 μm (c), 400 μm (e).
Fig. 7
Fig. 7. Tppp3-lineage cell-specific suppression of PI3K-Akt signalling results in decreased cell migration, neotendon thickness, and chondrometaplasia while promoting tendon differentiation in vivo.
a Schematic representation of the experiment. To investigate Tppp3-lineage (Tppp3lin) cell-specific suppression of the PI3K-Akt signalling pathway, Tppp3-CreERT2; Rosa26-tdTomato (control; Ctrl), Tppp3-CreERT2; Rosa26-loxP-stop-loxP-Pten (Rosa26-LSL-Pten); Rosa26-tdTomato (PtenOE) mice were used. After tamoxifen injection, Tppp3-lineage (Tppp3lin) cell-specific overexpression of Pten is induced. Yellow and red fluorescence indicate Tppp3lin tenocyte and non-tenocyte, respectively, whereas green and non-fluorescence indicate non-Tppp3lin tenocyte and non-tenocyte. Mice were injected with tamoxifen (0.075 mg) three times. Tamoxifen was washed out for 72 h, and subsequently, a tenotomy was performed (P 10-day) and evaluated 28 days later. b Haematoxylin-eosin (H&E), picrosirius red (PSR), and immunofluorescent staining of regenerated tendons 28 days after tenotomy. RFP and Tnmd antibodies were used for immunofluorescence analysis. Regenerated tendons are indicated by white dotted lines, and intact plantaris tendons are indicated by a black asterisk. The region marked by yellow dotted squares was enlarged in (h). c Quantification of neotendon thickness. Data are shown as the mean ± SEM of four independent biological samples (three independent sections per mouse). Regenerated tendons were significantly thinner in the PtenOE group than in the control group (two-tailed Student’s t-test, p = 0.0460). d Percentage of thick fibres in the neotendon. Data are shown as the mean ± SEM of four independent biological samples (three independent sections per mouse). The PtenOE group had a significantly higher percentage of thick fibres than the control group (two-tailed Student’s t-test; p = 0.0336). e Quantification of the percentage of tdTomato-positive (+) cells (Tppp3lin cells) in regenerated tendons shown in (b). Data are shown as the mean ± SEM of five independent biological samples (three independent sections per mouse). The area of tdTomato+ cells significantly decreased in the PtenOE group (two-tailed Student’s t-test; p = 0.0052). f Magnified images of the yellow dotted squares in Supplementary Fig. 10d. g The percentage of EGFP+ Tppp3lin (tdTomato+) cells among tdTomato+ cells in the neotendons. Data are shown as the mean ± SEM of four independent biological samples (three independent sections per mouse). EGFP+ tdTomato+ cells ratio was similar between the Ctrl and PtenOE groups (two-tailed Student’s t-test, p = 0.9696). h Magnified images of the yellow dotted squares in (b). Immunofluorescent staining of regenerated tendons 28 days after tenotomy using RFP and Tnmd antibodies. i The percentage of Tnmd+ Tppp3lin (tdTomato+) cells among tdTomato+ cells in the neotendons. Data are shown as the mean ± SEM of four independent biological samples (three independent sections per mouse). Tnmd+ tdTomato+ cells ratio was higher in the PtenOE group than in the control group (two-tailed Student’s t-test, p = 0.0010). j Immunofluorescent staining using RFP and Col2 antibodies. Yellow dotted circles indicate chondrometaplasia. k Magnified images of (j). l Quantification of the number of Col2+ cells in the regenerative tendons shown in (j). Data are shown as the mean ± SEM of four independent biological samples (three independent sections per mouse). The number of Col2+ cells in the PtenOE group decreased, although it was not significant (two-tailed Student’s t-test; P = 0.2158). m Quantification of the number of Col2+ Tppp3lin (tdTomato+) cells in the regenerative tendons. Data are shown as the mean ± SEM of four independent biological samples (three independent sections per mouse). Chondrometaplasia derived from Tppp3lin cells (tdTomato+ cells) decreased in the PtenOE group although not significant (two-tailed Student’s t-test, p = 0.1301). n Immunofluorescent staining using RFP and S100b antibodies. Yellow dotted circles indicate chondrometaplasia. o Magnified images of (n). p Quantification of the number of S100b+ cells in the regenerative tendons shown in (n). Data are shown as the mean ± SEM of four independent biological samples (three independent sections per mouse). The number of S100b+ cells in the PtenOE group significantly decreased (two-tailed Student’s t-test; p = 0.0329). q Quantification of the number of S100b+ Tppp3lin (tdTomato+) cells in the regenerative tendons. Data are shown as the mean ± SEM of four independent biological samples (three independent sections per mouse). Chondrometaplasia derived from Tppp3lin cells (tdTomato+ cells) significantly decreased in the PtenOE group (two-tailed Student’s t-test, p = 0.0125). * Scale bars, 50 μm (f, h, k), 100 μm (o), 200 μm (b, j, n).
Fig. 8
Fig. 8. Physiological tendon regeneration in neonatal mice requires the PI3K-Akt signalling pathway.
When tendons are injured, regeneration is primarily mediated by tenocytes (Scx+ cells) and paratenon sheath cells (Tppp3+ cells). PI3K-Akt signalling pathway stimulates the proliferation and migration of these cell types. However, inactivation of the PI3K-Akt signalling pathway impairs cell proliferation and migration. In contrast, PI3K-Akt signalling regulates the stemness of both Scx+ and Tppp3+ cells. Inactivation of PI3K-Akt signalling leads to a loss of stemness and induces terminal differentiation into mature tenocytes. As a result, the neotendon fails to thicken, impairing functional and mechanical regeneration. Overall, the PI3K-Akt signalling pathway is necessary for physiological tendon regeneration in neonatal mice, and its inactivation alters the tendon regenerative potential.

References

    1. Wu, F., Nerlich, M. & Docheva, D. Tendon injuries: basic science and new repair proposals. EFORT Open Rev.2, 332–342 (2017). - PMC - PubMed
    1. Voleti, P. B., Buckley, M. R. & Soslowsky, L. J. Tendon healing: repair and regeneration. Annu. Rev. Biomed. Eng.14, 47–71 (2012). - PubMed
    1. Buckley, M. R. et al. Distributions of types I, II and III collagen by region in the human supraspinatus tendon. Connect Tissue Res.54, 374–379 (2013). - PMC - PubMed
    1. Hart, D., Kydd, A. & Reno, C. Gender and pregnancy affect neuropeptide responses of the rabbit Achilles tendon. Clin. Orthop. Relat. Res.365, 237–246 (1999). - PubMed
    1. Shaw, A. V. et al. Outcome measurement in adult flexor tendon injury: a systematic review. J. Plast. Reconstr. Aesthet. Surg.75, 1455–1466 (2022). - PubMed

MeSH terms

Substances

LinkOut - more resources