. 2025 Apr 20;16(1):320.
doi: 10.1038/s41419-025-07655-4.

CITK modulates BRCA1 recruitment at DNA double strand breaks sites through HDAC6

Affiliations

CITK modulates BRCA1 recruitment at DNA double strand breaks sites through HDAC6

Giorgia Iegiani et al. Cell Death Dis. .

Abstract

Citron Kinase (CITK) is a protein encoded by the CIT gene, whose pathogenic variants underlie microcephalic phenotypes that characterize MCPH17 syndrome. In neural progenitors, CITK loss leads to microtubule instability, resulting in mitotic spindle positioning defects, cytokinesis failure, and accumulation of DNA double strand breaks (DSBs), ultimately resulting in TP53-dependent senescence and apoptosis. Although DNA damage accumulation has been associated with impaired homologous recombination (HR), the role of CITK in this process and whether microtubule dynamics are involved is still unknown. In this report we show that CITK is required for proper BRCA1 localization at sites of DNA DSBs. We found that CITK's scaffolding, rather than its catalytic activity, is necessary for maintaining BRCA1 interphase levels in progenitor cells during neurodevelopment. CITK regulates the nuclear levels of HDAC6, a modulator of both microtubule stability and DNA damage repair. Targeting HDAC6 in CITK-deficient cells increases microtubule stability and recovers BRCA1 localization defects and DNA damage levels to that detected in controls. In addition, the CIT-HDAC6 axis is functionally relevant in a MCPH17 zebrafish model, as HDAC6 targeting recovers the head size phenotype produced by interfering with the CIT orthologue gene. These data provide novel insights into the functional interplay between HR and microtubule dynamics and into the pathogenesis of CITK based MCPH17, which may be relevant for development of therapeutic strategies.


Conflict of interest statement

Competing interests: The authors declare no competing interests. Ethics: For iPSC lines, subjects were enrolled according to protocols approved by institutional review boards at affiliated institutions, as previously described [11]. In all cases, the procedures followed were in accordance with the ethical standards of the respective institution’s committee on human research and were in keeping with international standards. Written informed consent was obtained prior to participation. The mouse studies were designed according to the guidelines of the NIH, the European Communities Council (2010/63/EU) and the Italian Law for Care and Use of Experimental Animals (DL26/2014), under permission number 1128/2020-PR, released on 16th November 2020 from Italian Ministry of Health, Department of Public Veterinary Health. It was also approved by the Italian Ministry of Health and the Bioethical Committee of the University of Turin. Zebrafish were bred following international (EU Directive 2010/63/EU; European recommendations) and national recognized guidelines (Italian decree 4th March 2014, n. 26), which focus on the protection of animals used for scientific research.

Figures
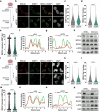
Fig. 1
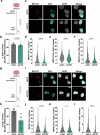
Fig. 1. CITK knockdown reduces BRCA1 levels and colocalization between BRCA1 and 53BP1 after induction of DNA damage.
a, i Schematic representation of the experiments performed. b, j Representative confocal images of ONS-76 cells treated as highlighted in (a, i), respectively, immunostained for BRCA1 and 53BP1 and counterstained with DAPI. Scale bars: 10 μm. c, d, k, l Quantification of 53BP1 and BRCA1 foci per nucleus, in cells treated as in (b, j), respectively. e, m Quantification of BRCA1 signal intensity in each 53BP1 focus, in cells treated as in (b, j), respectively, after normalization to the median of control samples. f, g, n, o Examples of co-localization profiles between BRCA1 and 53BP1 signals in ONS-76 cells treated as (b, j), respectively. Fluorescence intensity was plotted for the two channels along a 6-μm-long line, randomly drawn in the nuclei of exemplar cells. h, p Western blot analysis of total lysate from ONS-76, obtained at the end of experiments performed as highlighted in (a, i), respectively. The levels of CITK, BRCA1, RAD51, phosphor-RPA were analyzed, and the internal loading control was Vinculin (VINC). All quantifications were based on at least four independent biological replicates; >300 cells were analyzed per condition in each replicate. ****P < 0.0001; Mann– Whitney U test.
Fig. 2
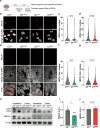
Fig. 2. CIT-K knockdown reduces BRCA1 levels independently from proliferative state.
a, g Schematic representation of the experiments performed. Quantification of the percentage of EdU positive ONS-76 cells 24 h (b) or 48 h (h) after transfection of the indicated siRNAs. Representative images of ONS-76 cells analyzed 24 h (c) or 48 h (i) after siRNAs transfection and treatment with 10 μM EdU for 30’, to label cells in S-phase. Cells were immunostained for BRCA1 and nuclei were counterstained with DAPI. Scale bars: 10 μm. d, j Quantification of BRCA1 foci per nucleus, in samples treated as in (c, i), respectively. e, k Quantification of BRCA1 foci per EdU-positive nucleus, in samples treated as in (c, i), respectively. f, l Quantification of BRCA1 foci per EdU-negative nucleus, in samples treated as in (c, i), respectively. All immunofluorescence quantifications were based on at least four independent biological replicates; >300 cells were analyzed per condition in each replicate. Error bars, SEM. *P < 0.05, ****P < 0.0001; unpaired two-tailed Student’s t-test for EdU positive cells; Mann– Whitney U test for foci.
Fig. 3
Fig. 3. CITK scaffold activity, but not kinase activity, is required for regulation of BRCA1 levels during neurodevelopment.
a Schematic representation of the protocol used to obtain neural progenitor cells and forebrain organoid from pluripotent stem cells. Representative images of proliferating neural progenitor cells (b) or rosettes from DD35 organoid sections (e), carrying wild type, frameshift, or kinase inactive variants of CIT gene, immunostained for BRCA1 and counterstained with DAPI. Scale bars: 10 μm and 50 μm, respectively. c, d, f, g Quantification of BRCA1 foci per nucleus in each genotype and condition. h Western blot analysis of total lysate obtained from P4 cerebellum and P4 cortex of mice carrying wild type, frameshift, or kinase inactive variant of Cit gene. The levels of CITK and BRCA1 were analyzed, and the internal loading control was α-tubulin (α-TUB). i, j Quantification of BRCA1 levels in each genotype. Each dot indicates an independent biological replicate. Error bars, SEM. *P < 0.05, ***P < 0.001; unpaired two-tailed Student’s t-test for western blots, Mann–Whitney U test for BRCA1 foci. A.U. arbitrary unit.
Fig. 4
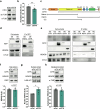
Fig. 4. CITK regulates acetylated tubulin levels and co-immunoprecipitates with HDAC6.
a Western blot analysis of total lysate from ONS-76 48 h after transfection of the indicated siRNA. The levels of CITK and acetylated tubulin (ac-TUB) were analyzed, and the internal loading control was α-tubulin (α-TUB). b Quantification of the relative density of ac-TUB in samples described in (a). c Schematic diagram of CITK protein domains (Kinase domain; Coiled coil, Rho-binding domain (Rho BD); Zinc finger (ZF), pleckstrin-homology domain (PH), Citron–Nik1 homology domain (CNH), PDZ domain) and of the different constructs used in the following panels. d Western blot analysis of total cell lysates (left) or RFP-Trap-based immunoprecipitations (right), obtained from 293-T cells transfected with constructs expressing Cherry-tagged CITK or with empty control vecto. The levels of RFP, HDAC6, and CYLD were analyzed. e Western blot analysis of total cell lysates (left) or anti-Myc immunoprecipitations (right), obtained from 293-T cells transfected with vectors expressing the indicated Myc-tagged CITK proteins. The levels of Myc, HDAC6 and CYLD were analyzed. f Western blot analysis of total lysate from ONS-76 48 h after transfection with the indicated siRNAs. The levels of CITK and HDAC6 were analyzed, and the internal loading control was Vinculin (VINC). Quantification of HDAC6 levels in siCITK cells relative to siCtrl. Nuclear (g) and cytoplasmic (h) fractionation of ONS-76 48 h after siRNA transfection. The levels of CITK and HDAC6 were analyzed, and the internal loading control was lamin A/C (LAM A/C) for the nucleus and α-tubulin (α-TUB) for the cytoplasm. Each dot indicates an independent biological replicate. Error bars, SEM. *P < 0.05, **P < 0.01. unpaired two-tailed Student’s t-test. A.U. arbitrary unit.
Fig. 5
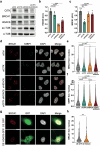
Fig. 5. HDAC6 targeting recovers BRCA1 levels and DNA damage in CITK depleted cells.
a Western blot analysis of total lysate from ONS-76 cells, 48 hafter transfection of the indicated siRNAs. The levels of CITK, HDAC6, acetylated tubulin (ac-TUB) were analyzed, and the internal loading control was α-tubulin (α-TUB). b Quantification of the relative density of HDAC6 in each treatment condition. c Quantification of the relative density of BRCA1 in each treatment condition. d Representative images of ONS-76 cells, analyzed 48 h after transfection of the indicated siRNAs. Cells were immunostained for BRCA1 and 53BP1 and counterstained with DAPI. Scale bars: 10 μm. Quantification of BRCA1 (e) or 53BP1 (f) foci per nucleus in experiments performed as in (d). g Representative images of ONS-76 cells after transfection with GFP or HDAC6-GFP expression plasmids. Cells were immunostained for BRCA1 and counterstained with DAPI. Scale bars: 10 μm. h Quantification of BRCA1 foci per nucleus in samples treated as in (e) condition. Each dot indicates an independent biological replicate. All immunofluorescence quantifications were based on at least four independent biological replicates; >300 cells were analyzed per condition in each replicate. Error bars, SEM. **P < 0.01, ***P < 0.001, ****P < 0.0001; one-way ANOVA test followed by Bonferroni’s correction (b, c, e, f), unpaired Student’s t-test (h). A.U. arbitrary unit.
Fig. 6
Fig. 6. Targeting HDAC6 recovers microcephaly in MCPH17 Zebrafish model.
a Schematic representation of the experiment performed. b Representative brightfield images of the head region of 24 hpf embryos showing normal or reduced head size. Scalebar = 100 μm. c Quantification of the lateral head area under control conditions, after injection of cita-LoF morpholino oligonucleotide and after co-injection of cita-LoF with control vector or Cit-K expression vector. d Quantification of the lateral head area under control conditions and in cita-LoF embryos treated with DMSO or Tubastin A at the indicated concentrations. e Quantification of the lateral head area under control condition of after injection of the indicated morpholinos. Each dot indicates a single embryo. Error bars, SEM. *P < 0.05, ***P < 0.001, ****P < 0.0001 one-way ANOVA test followed by Tukey’s correction.

References

    1. McKinnon PJ. Maintaining genome stability in the nervous system. Nat Neurosci. 2013;16:1523–9. - PMC - PubMed
    1. Cannan WJ, Pederson DS. Mechanisms and consequences of double-strand DNA break formation in chromatin. J Cell Physiol. 2016;231:3–14. - PMC - PubMed
    1. Scully R, Panday A, Elango R, Willis NA. DNA double-strand break repair-pathway choice in somatic mammalian cells. Nat Rev Mol Cell Biol. 2019;20:698–714. - PMC - PubMed
    1. Ma CJ, Gibb B, Kwon Y, Sung P, Greene EC. Protein dynamics of human RPA and RAD51 on ssDNA during assembly and disassembly of the RAD51 filament. Nucleic Acids Res. 2017;45:749–61. - PMC - PubMed
    1. Tarsounas M, Sung P. The antitumorigenic roles of BRCA1-BARD1 in DNA repair and replication. Nat Rev Mol Cell Biol. 2020;21:284–99. - PMC - PubMed

MeSH terms

Substances