

Evaluation of imputation and imputation-free strategies for differential abundance analysis in metaproteomics data
- PMID: 40254829
- PMCID: PMC12009712
- DOI: 10.1093/bib/bbaf141
Evaluation of imputation and imputation-free strategies for differential abundance analysis in metaproteomics data
Abstract
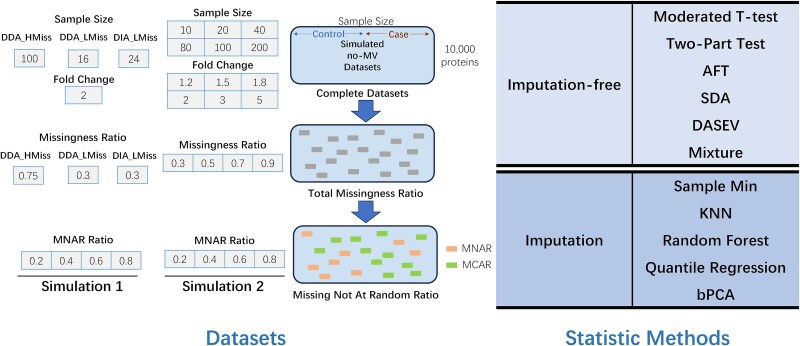
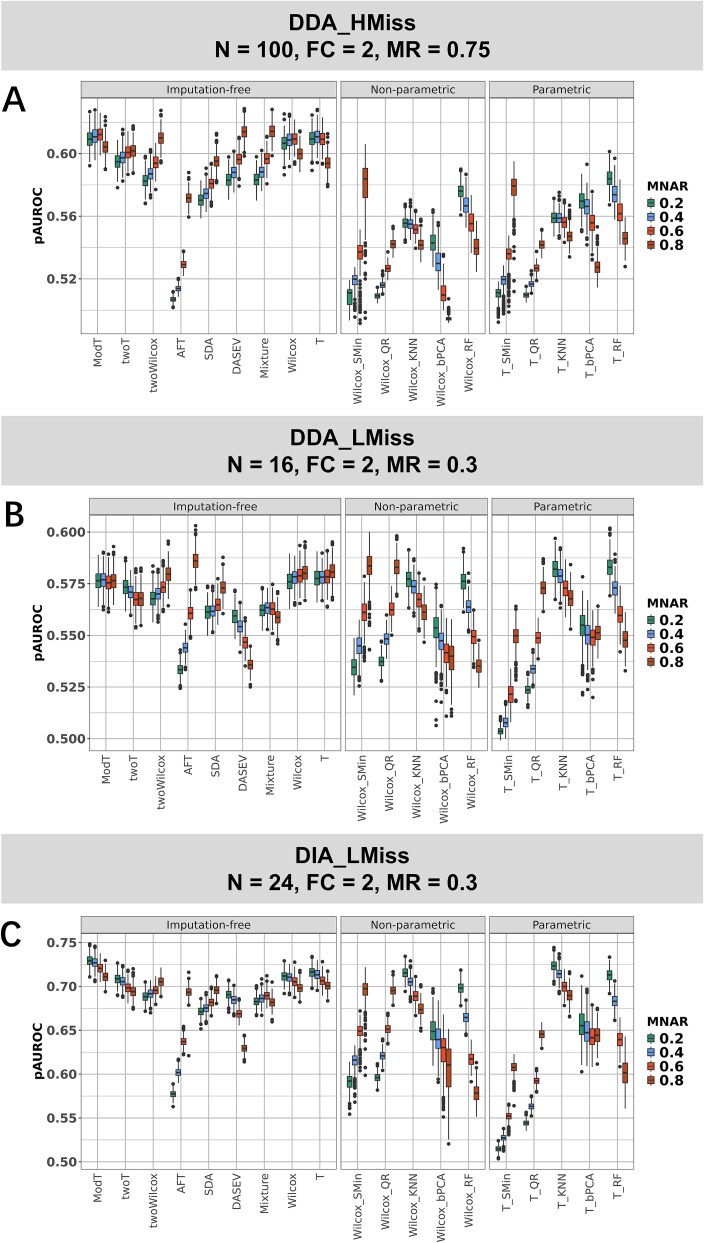
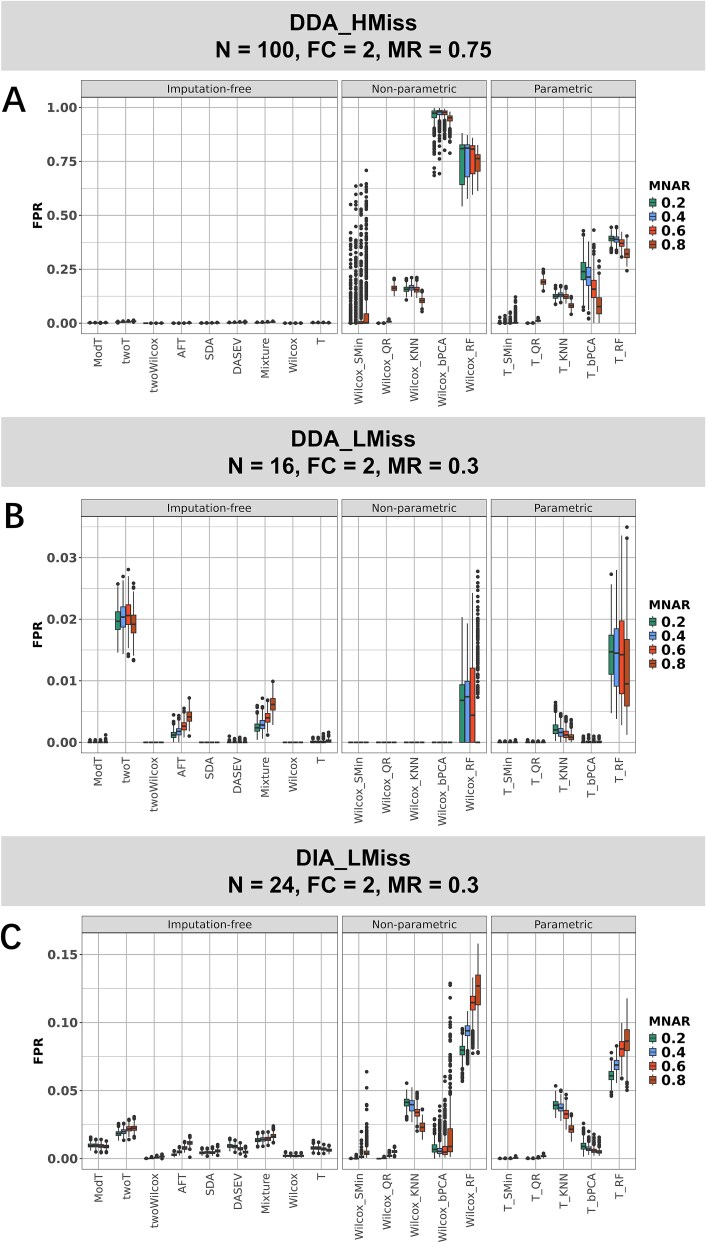
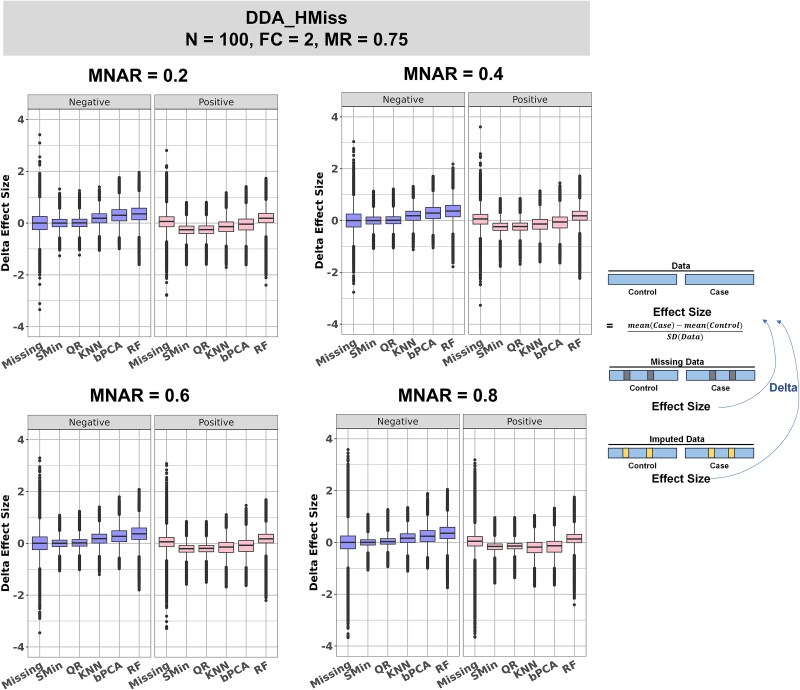
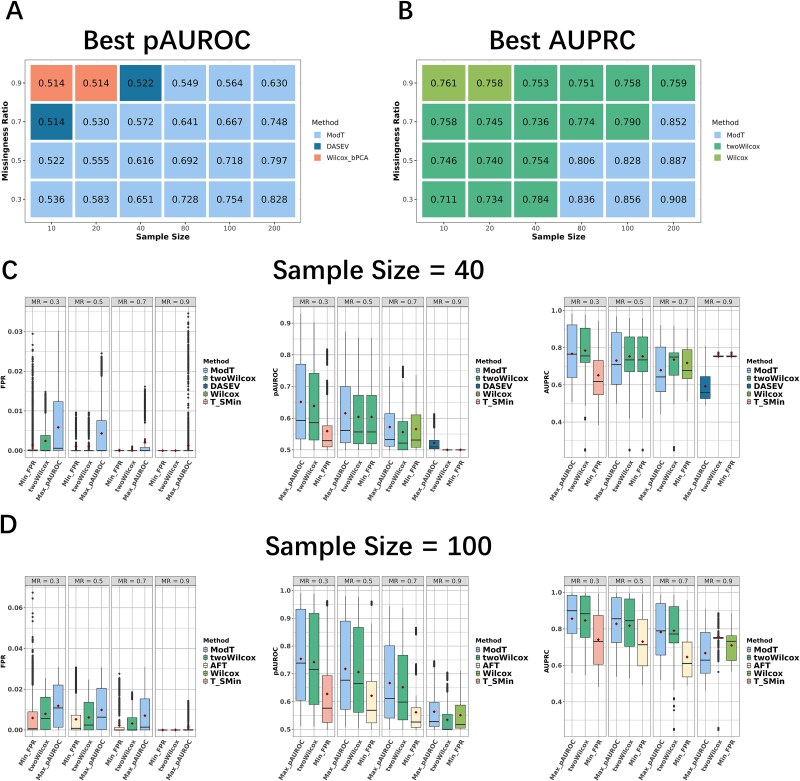
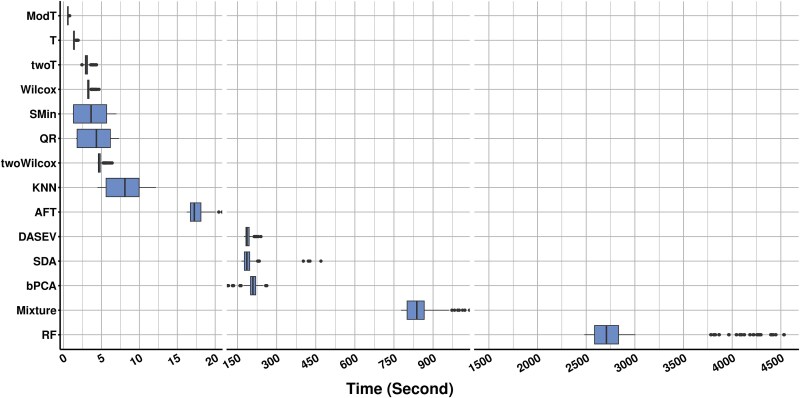
For metaproteomics data derived from the collective protein composition of dynamic multi-organism systems, the proportion of missing values and dimensions of data exceeds that observed in single-organism experiments. Consequently, evaluations of differential analysis strategies in other mass spectrometry (MS) data (such as proteomics and metabolomics) may not be directly applicable to metaproteomics data. In this study, we systematically evaluated five imputation methods [sample minimum, quantile regression, k-nearest neighbors (KNN), Bayesian principal component analysis (bPCA), random forest (RF)] and six imputation-free methods (moderated t-test, two-part t-test, two-part Wilcoxon test, semiparametric differential abundance analysis, differential abundance analysis with Bayes shrinkage estimation of variance method, and Mixture) for differential analysis in simulated metaproteomic datasets based on both data-dependent acquisition MS experiments and emerging data-independent acquisition experiments. The simulation datasets comprised 588 scenarios by considering the impacts of sample size, fold change between case and control, and missing value ratio at random and nonrandom. Compared to imputation-free methods, KNN, bPCA, and RF imputation performed poorly in datasets with a high missingness ratio and large sample size and resulted in a high false-positive risk. We made empirical recommendations based on the balance of sensitivity in analysis and control of false positives. The moderated t-test was optimal in scenarios of large sample size with a low missingness ratio. The two-part Wilcoxon test was recommended in scenarios of small sample size with a low missingness ratio or large sample size with a high missingness ratio. The comprehensive evaluations in our study can provide guidance for the differential abundance analysis in metaproteomics.
Keywords: differential abundance analysis; imputation missing mechanism; metaproteomics; missing value; two-part statistics.
© The Author(s) 2025. Published by Oxford University Press.
Figures
Similar articles
-
Comprehensive Evaluation of Advanced Imputation Methods for Proteomic Data Acquired via the Label-Free Approach.Int J Mol Sci. 2024 Dec 17;25(24):13491. doi: 10.3390/ijms252413491. Int J Mol Sci. 2024. PMID: 39769253 Free PMC article.
-
Missing Value Imputation Approach for Mass Spectrometry-based Metabolomics Data.Sci Rep. 2018 Jan 12;8(1):663. doi: 10.1038/s41598-017-19120-0. Sci Rep. 2018. PMID: 29330539 Free PMC article.
-
Random forest-based imputation outperforms other methods for imputing LC-MS metabolomics data: a comparative study.BMC Bioinformatics. 2019 Oct 11;20(1):492. doi: 10.1186/s12859-019-3110-0. BMC Bioinformatics. 2019. PMID: 31601178 Free PMC article.
-
[Microbial metaproteomics--From sample processing to data acquisition and analysis].Se Pu. 2024 Jul;42(7):658-668. doi: 10.3724/SP.J.1123.2024.02009. Se Pu. 2024. PMID: 38966974 Free PMC article. Review. Chinese.
-
Computational Methods for Data Integration and Imputation of Missing Values in Omics Datasets.Proteomics. 2025 Jan;25(1-2):e202400100. doi: 10.1002/pmic.202400100. Epub 2024 Dec 30. Proteomics. 2025. PMID: 39740174
Cited by
-
Ginsenoside Rg5 alleviates hypoxia-induced myocardial apoptosis by targeting STAT3 to promote Tyr705 phosphorylation.Chin Med. 2025 Jun 13;20(1):86. doi: 10.1186/s13020-025-01128-8. Chin Med. 2025. PMID: 40514732 Free PMC article.
References
Publication types
MeSH terms
Grants and funding
LinkOut - more resources
Full Text Sources
