. 2025 Feb 27;5(2):268-282.
doi: 10.1021/acsbiomedchemau.4c00098. eCollection 2025 Apr 16.

Engineering Cell-Specific Protein Delivery Vehicles for Erythroid Lineage Cells

Affiliations

Engineering Cell-Specific Protein Delivery Vehicles for Erythroid Lineage Cells

Mekedlawit T Setegne et al. ACS Bio Med Chem Au. .

Abstract

Biologics such as proteins, peptides, and oligonucleotides are powerful ligands to modulate challenging drug targets that lack readily accessible and "ligandable" pockets. However, the limited membrane permeance of biologics severely restricts their intracellular applications. Moreover, different cell types may exhibit varying levels of impermeability, and some delivery vehicles might be more sensitive to this variance. Erythroid lineage cells are especially challenging to deliver cargo to because of their unique cytoskeleton and the absence of endocytosis in mature erythrocytes. We recently employed a cell permeant miniature protein to deliver bioPROTACs to human umbilical cord blood derived erythroid progenitor cells (HUDEP-2) and primary hematopoietic stem (CD34+) cells (Shen et al., ACS Cent. Sci.2022, 8, 1695-1703). While successful, the low efficiency of delivery and lack of cell-type specificity limit use of bioPROTACs in vivo. In this work, we thoroughly evaluated the performance of various recently reported cell penetrating peptides (CPPs), CPP additives, bacterial toxins, and contractile injection systems for their ability to deliver cargo to erythroid precursor cells. We also explored how targeting receptors enriched on the erythroid cell surface might improve the efficiencies and specificities of these delivery vehicles. Our results reveal that certain vehicles exhibit improved efficiencies when directed to cell surface receptors while others do not benefit from this targeting strategy. Together, these findings advance our understanding of protein delivery to challenging cell types and illustrate some of the intricacies of cell-surface receptor targeting.


Conflict of interest statement

The authors declare no competing financial interest.

Figures

Figure 1
Figure 1
Schematic description of proteins used in this study. (a) Classes of protein DVs include CPMP (ZF5.3), CPP (E5TAT), CPP additive (TNB-R10), and bacterial toxins (PVC and BoNT). (b) Cargo proteins delivered by the DVs and (c) description of a modification to the cargo to improve TNB-R10 conjugation.
Figure 2
Figure 2
Representative confocal microscopy images taken on a spinning disc confocal and DIC microscope of live a) HUDEP-2 and c) Jurkat cells treated with 8 μM of ZF5.3-mNG, mNG-1 × TNB-R10, mNG-3× TNB-R10, or E5TAT-mNG for 1 h, recovered for an additional 1 h. Protein is first shown in gray and then shown in cyan overlapped with cell mask (red). Quantification of mean fluorescence intensity (total fluorescence intensity was background corrected and normalized to cell area) from confocal images of HUDEP-2 (b) and Jurkat cells (d). Median fluorescence intensity from (b) and (d) are represented with black bars and descriptive statistics are shown for each condition. n represents the number of cells quantified per condition. P-values were determined by one-way analysis of variance (ANOVA) followed by Kruskal–Wallis and Mann–Whitney tests and compared to mNG only treatment. Scale bar = 20 μm.
Figure 3
Figure 3
Dose-dependent delivery of mNG by the different DVs. Uptake of mNG in HUDEP-2 and Jurkat cells; cells were treated for 1 h, washed, and incubated with trypsin to remove surface proteins and quantified by flow cytometry. a) Repersenative histograms of each sample. b-g) Data shown as fold change of median fluorescence intensity (MFI) values compared to untreated cells. b,c) MFI fold change data points were fit using a simple linear regression (Table S5). d-g) MFI fold change shown as bar graph representation of the data with a dashed horizontal line indicating the point of significant uptake (MFI >1.5×, compared to untreated samples). MFI values corresponding to each mNG-vehicle were compared to nontreated cells and between cell types at each dose, and P-values were determined by two-way analysis of variance (ANOVA) of N = 3 biological replicates.
Figure 4
Figure 4
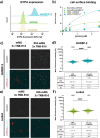
Engineering cell-specific DVs. a) Flow cytometry analysis of GYPA levels on the surface of HUDEP-2 and Jurkat cells. b) Surface binding of proteins to HUDEP-2 and Jurkat cells. Cells were treated with 0–2.5 μM of protein and analyzed using flow cytometry. Data is shown as fold change of MFI values compared to untreated cells. c, e) Representative confocal microscopy images of live HUDEP-2 (c) and Jurkat cells (e) taken on spinning disc confocal and DIC microscope; cells were treated with 1 μM of mNG-1 × TNB-R10 or IH4-mNG-3× TNB-R10 unmodified with 2-iminiothiolane for 2 h. Protein is first shown in gray and then shown in cyan overlapped with cell mask (red). e, f) Quantification of mean fluorescence intensity from confocal images of HUDEP-2 (e) and Jurkat cells (f). Median is represented with a black bar, and descriptive statistics are shown for each condition. N represents the number of cells quantified per image. P-values were determined by one-way analysis of variance (ANOVA) followed by Kruskal–Wallis test and compared to treatment of mNG only of three biological replicates.
Figure 5
Figure 5
Representative confocal microscopy images of live a) HUDEP-2 and c) Jurkat cells taken on spinning disc confocal and DIC microscope. Cells were treated with 5 μM ZF5.3-mNG-IH4, E5TAT-mNG-IH4, IH4-mNG-1 × -TNB-R10, and IH4-mNG-3 × -TNB-R10 for 1 h, recovered for an additional 1 h before imaging. Black bars correspond to the median of each treatment (DV-IH4), and red dashed lines correspond to the median of the DV without IH4 (from Figure 2). The protein is first shown in gray and then shown in cyan overlapped with cell mask (red). Quantification of mean fluorescence intensity for confocal images from of HUDEP-2 (b) and Jurkat cells (d). Median is represented with a black bar, and descriptive statistics are shown for each condition. n represents the number of cells quantified per image. P-values were determined by one-way analysis of variance (ANOVA) followed by Kruskal–Wallis and Mann–Whitney tests and compared to mNG only treatment of two biological replicates. Scale bar = 20 μm.
Figure 6
Figure 6
Comparison of uptake by DVs with and without targeting ligand IH4 appended assessed by flow cytomtery. (a-d) Dose-dependent fluorescence in cells treated with varying concentrations of proteins and DVs. Cells were treated with either 0.5, 1, or 5 μM ZF5.3-mNG-IH4, E5TAT-mNG-IH4, IH4-mNG-1 × -TNB-R10, and IH4-mNG-3 × -TNB-R10. Data is shown as fold change of MFI values compared to untreated cells and represents the fluorescence intensity of cells. A dashed line at 1.5× fold change defined as significant uptake compared to untreated cells. MFI values corresponding to each mNG-vehicle were compared to nontreated cells and between cell types at each dose. P-values were determined by two-way analysis of variance (ANOVA) of three biological replicates.
Figure 7
Figure 7
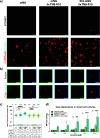
(a, b) Representative confocal microscopy images of mixed coculture of live HUDEP-2 and Jurkat cells taken on a spinning disc confocal and DIC microscope; cells were treated with 1 μM mNG, mNG-3 × TNB-R10, IH4-mNG-3× TNB-R10 for 2 h, washed, and labeled with CD36-APC. Protein is first shown in gray and then shown in cyan overlapped with cell mask (red). (c) Quantification of mean fluorescence intensity for confocal images from a,b (background corrected and normalized to cell area). Gaussian Mixture Model was used to distinguish cells based on CD36-APC signal with CD36+ (HUDEP-2) and CD36– (Jurkat) which is positive for HUDEP-2 cells only (Figure S15). Median is represented with a black bar, and descriptive statistics are shown for each condition. N represents the number of cells quantified per image. P-values were determined by one-way analysis of variance (ANOVA) followed by Kruskal–Wallis and Mann–Whitney tests and compared to mNG only treatment of two biological replicates. Scale bar = 20 μm. (d) mNG, mNG-3 × -TNBR-10, or IH4-mNG-3× TNB-R10 at 0.3 to 5 μM were added to cells for 2 h, washed to remove surface-bound proteins, labeled with CD36-APC and CD3-PE-Cy7 antibodies, and analyzed via flow cytometry. Gates were chosen stringently as HUDEP-2 (APC+PE-Cy-7−) and Jurkat (APC-PE-Cy-7+) as described in Figure S13. Data shown as MFI fold change of treated cells compared to mNG only treated cells. P-values were determined by two-way analysis of variance (ANOVA) of three biological replicates.

References

    1. Neklesa T. K.; Winkler J. D.; Crews C. M. Targeted Protein Degradation by PROTACs. Pharmacol. Ther. 2017, 174, 138–144. 10.1016/j.pharmthera.2017.02.027. - DOI - PubMed
    1. Spradlin J. N.; Zhang E.; Nomura D. K. Reimagining Druggability Using Chemoproteomic Platforms. Acc. Chem. Res. 2021, 54 (7), 1801–1813. 10.1021/acs.accounts.1c00065. - DOI - PubMed
    1. Lu Y.; Yang Y.; Zhu G.; Zeng H.; Fan Y.; Guo F.; Xu D.; Wang B.; Chen D.; Ge G. Emerging Pharmacotherapeutic Strategies to Overcome Undruggable Proteins in Cancer. Int. J. Biol. Sci. 2023, 19 (11), 3360–3382. 10.7150/ijbs.83026. - DOI - PMC - PubMed
    1. Mullard A. 2020 FDA Drug Approvals. Nat. Rev. Drug Discovery 2021, 20 (2), 85–90. 10.1038/d41573-021-00002-0. - DOI - PubMed
    1. Ebrahimi S. B.; Samanta D. Engineering Protein-Based Therapeutics through Structural and Chemical Design. Nat. Commun. 2023, 14, 2411.10.1038/s41467-023-38039-x. - DOI - PMC - PubMed

LinkOut - more resources