

Comparative analysis of rodent lens morphometrics and biomechanical properties
- PMID: 40255368
- PMCID: PMC12006193
- DOI: 10.3389/fopht.2025.1562583
Comparative analysis of rodent lens morphometrics and biomechanical properties
Abstract
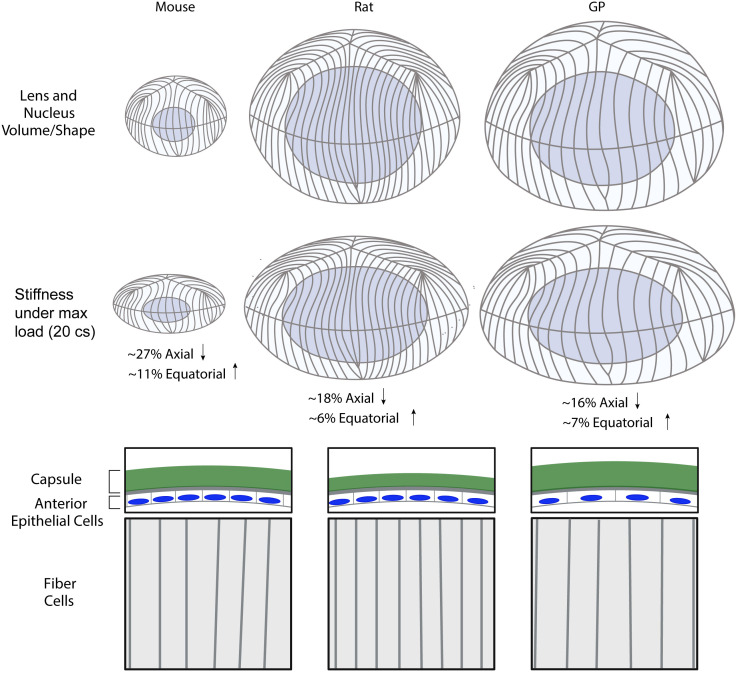
Introduction: Proper ocular lens function requires biomechanical flexibility, which is reduced during aging. As increasing lens size has been shown to correlate with lens biomechanical stiffness in aging, we tested the hypothesis that whole lens size determines gross biomechanical stiffness by comparing lenses of varying sizes from three rodent species (mice, rats, and guinea pigs).
Methods: Coverslip compression assay was performed to measure whole lens biomechanics. Whole mount staining on fixed lenses, followed by confocal microscopy, was conducted to measure lens microstructures.
Results: Among the three species, guinea pig lenses are the largest, rat lenses are smaller than guinea pig lenses, and mouse lenses are the smallest of the three. We found that rat and guinea pig lenses are stiffer than the much smaller mouse lenses. However, despite guinea pig lenses being larger than rat lenses, whole lens stiffness between guinea pigs and rats is not different. This refutes our hypothesis and indicates that lens size does not solely determine lens stiffness. We next compared lens microstructures, including nuclear size, capsule thickness, epithelial cell area, fiber cell widths, and suture organization between mice, rats, and guinea pigs. The lens nucleus is the largest in guinea pigs, followed by rats, and mice. However, the rat nucleus occupies a larger fraction of the lens. Both lens capsule thickness and fiber cell widths are the largest in guinea pigs, followed by mice and then rats. Epithelial cells are the largest in guinea pigs, and there are no differences between mice and rats. In addition, the lens suture shape appears similar across all three species.
Discussion: Overall, our data indicates that whole lens size and microstructure morphometrics do not correlate with lens stiffness, indicating that factors contributing to lens biomechanics are complex and likely multifactorial.
Keywords: allometry; lens biomechanics; lens microstructures; lens stiffness; morphometrics.
Copyright © 2025 Cheheltani, Islam, Malino, Abera, Aryal, Forbes, Parreno and Fowler.
Conflict of interest statement
The authors declare that the research was conducted in the absence of any commercial or financial relationships that could be construed as a potential conflict of interest.
Figures


Similar articles
-
Trifocal versus extended depth of focus (EDOF) intraocular lenses after cataract extraction.Cochrane Database Syst Rev. 2024 Jul 10;7(7):CD014891. doi: 10.1002/14651858.CD014891.pub2. Cochrane Database Syst Rev. 2024. PMID: 38984608 Free PMC article.
-
The Black Book of Psychotropic Dosing and Monitoring.Psychopharmacol Bull. 2024 Jul 8;54(3):8-59. Psychopharmacol Bull. 2024. PMID: 38993656 Free PMC article. Review.
-
Portion, package or tableware size for changing selection and consumption of food, alcohol and tobacco.Cochrane Database Syst Rev. 2015 Sep 14;2015(9):CD011045. doi: 10.1002/14651858.CD011045.pub2. Cochrane Database Syst Rev. 2015. PMID: 26368271 Free PMC article.
-
Systemic pharmacological treatments for chronic plaque psoriasis: a network meta-analysis.Cochrane Database Syst Rev. 2017 Dec 22;12(12):CD011535. doi: 10.1002/14651858.CD011535.pub2. Cochrane Database Syst Rev. 2017. Update in: Cochrane Database Syst Rev. 2020 Jan 9;1:CD011535. doi: 10.1002/14651858.CD011535.pub3. PMID: 29271481 Free PMC article. Updated.
-
Comparison of Two Modern Survival Prediction Tools, SORG-MLA and METSSS, in Patients With Symptomatic Long-bone Metastases Who Underwent Local Treatment With Surgery Followed by Radiotherapy and With Radiotherapy Alone.Clin Orthop Relat Res. 2024 Dec 1;482(12):2193-2208. doi: 10.1097/CORR.0000000000003185. Epub 2024 Jul 23. Clin Orthop Relat Res. 2024. PMID: 39051924
References
-
- Lovicu F, Robinson M. Development of the Ocular Lens. Cambridge: Cambridge University Press; (2004).
-
- Robinson ML. “Lens Fiber Cell Differentiation”. In: Encyclopedia of the Eye. Elsevier, Academic Press: (2010).
-
- Cogan DG. Anatomy of lens and pathology of cataracts. Exp Eye Res. (1962) 1:291–5. - PubMed
Grants and funding
LinkOut - more resources
Full Text Sources
Research Materials