. 2025 Apr 4:16:1536302.
doi: 10.3389/fimmu.2025.1536302. eCollection 2025.

Repertoire-based mapping and time-tracking of T helper cell subsets in scRNA-Seq

Affiliations

Repertoire-based mapping and time-tracking of T helper cell subsets in scRNA-Seq

Daniil K Lukyanov et al. Front Immunol. .

Abstract

Introduction: The functional programs of CD4+ T helper (Th) cell clones play a central role in shaping immune responses to different challenges. While advances in single-cell RNA sequencing (scRNA-Seq) have significantly improved our understanding of the diversity of Th cells, the relationship between scRNA-Seq clusters and the traditionally characterized Th subsets remains ambiguous.

Methods: In this study, we introduce TCR-Track, a method leveraging immune repertoire data to map phenotypically sorted Th subsets onto scRNA-Seq profiles.

Results and discussion: This approach accurately positions the Th1, Th1-17, Th17, Th22, Th2a, Th2, T follicular helper (Tfh), and regulatory T-cell (Treg) subsets, outperforming mapping based on CITE-Seq. Remarkably, the mapping is tightly focused on specific scRNA-Seq clusters, despite 4-year interval between subset sorting and the effector CD4+ scRNA-Seq experiment. These findings highlight the intrinsic program stability of Th clones circulating in peripheral blood. Repertoire overlap analysis at the scRNA-Seq level confirms that the circulating Th1, Th2, Th2a, Th17, Th22, and Treg subsets are clonally independent. However, a significant clonal overlap between the Th1 and cytotoxic CD4+ T-cell clusters suggests that cytotoxic CD4+ T cells differentiate from Th1 clones. In addition, this study resolves a longstanding ambiguity: we demonstrate that, while CCR10+ Th cells align with a specific Th22 scRNA-Seq cluster, CCR10-CCR6+CXCR3-CCR4+ cells, typically classified as Th17, represent a mixture of bona fide Th17 cells and clonally unrelated CCR10low Th22 cells. The clear distinction between the Th17 and Th22 subsets should influence the development of vaccine- and T-cell-based therapies. Furthermore, we show that severe acute SARS-CoV-2 infection induces systemic type 1 interferon (IFN) activation of naive Th cells. An increased proportion of effector IFN-induced Th cells is associated with a moderate course of the disease but remains low in critical COVID-19 cases. Using integrated scRNA-Seq, TCR-Track, and CITE-Seq data from 122 donors, we provide a comprehensive Th scRNA-Seq reference that should facilitate further investigation of Th subsets in fundamental and clinical studies.

Keywords: T cell memory; Th17; Th22; cytotoxic CD4+ T cells; helper T cell subsets; immune repertoires; scRNA-Seq; scTCR-seq.


Conflict of interest statement

The authors declare that the research was conducted in the absence of any commercial or financial relationships that could be construed as a potential conflict of interest.

Figures

Figure 1
Figure 1
T-cell receptor (TCR)-based mapping of sorted T helper (Th) cell subsets in the single-cell RNA sequencing (scRNA-Seq) data. The Th cell subsets were isolated using fluorescence-activated cell sorting (FACS) with the classic surface markers. RNA-based TCRα and TCRβ repertoires were obtained. After 4 years, scRNA-Seq and scTCR-Seq analysis was performed for the same donor CD4+ T cells. Th clones were localized within the scRNA-Seq landscape using TCRs as natural barcodes. Compact positioning of each Th repertoire localized the corresponding T-cell scRNA-Seq clusters and revealed the long-term stability of the circulating Th clonal programs.
Figure 2
Figure 2
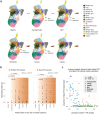
Mapping of the classic T helper (Th) cell subsets with single-cell RNA sequencing (scRNA-Seq). (a) Uniform manifold approximation and projection (UMAP) visualization of the reference scRNA-Seq dataset of peripheral blood Th cells. Dataset built via Seurat integration of publicly available data and our scRNA-Seq data. The proposed classification is based on previous knowledge and the findings of the current work. (b) Dot plots summarizing the positioning of the sorted (TCR-Track) and in silico gated (CITE-Seq) Th subsets within the scRNA-Seq clusters shown in (c). For normalization, 20,000 randomly selected scRNA-Seq cells with matched CITE-Seq or TCR-Track data were used for each plot. Dot intensity indicates the stained proportion of the scRNA-Seq cluster. Dot size denotes the proportion of the TCR-Track-identified or the in silico CITE-Seq-based gated scRNA-Seq cells mapped to the scRNA-Seq cluster. Green dashed rectangles indicate the dominating scRNA-Seq cluster. (c) UMAP plots showing the localization of the TCR-Track and CITE-Seq defined subsets. TCRβ clonotypes were used to define the Th subsets in the TCR-Track method. Expression of the surface markers was used to gate the Th subsets in the CITE-Seq-based annotation. The color intensity in TCR-Track is proportional to the clonal frequencies in the original sorted Th bulk TCRβ repertoires.
Figure 3
Figure 3
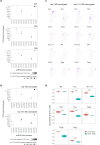
TCR-Track reproducibility and clonality dependence. (a) Dot plots summarizing the clonal positioning of the sorted T helper (Th) cell subsets (TCR-Track) within the single-cell RNA sequencing (scRNA-Seq) clusters, shown separately for each donor. (b) Dot plots summarizing the clonal positioning of the top 100 and the top 101–500 largest clonotypes from the sorted Th subsets (TCR-Track) within the scRNA-Seq clusters. (c) Uniform manifold approximation and projection (UMAP) plots showing the clonal positioning of the top 100 and the top 101–500 largest clonotypes from the sorted Th subsets (TCR-Track) within the scRNA-Seq clusters. TCRβ clonotypes were used to define the Th subsets in the TCR-Track method. The color intensity in TCR-Track is proportional to the clonal frequencies in the original sorted Th bulk TCRβ repertoires. (d) Relative accuracy of subset mapping to the specific scRNA-Seq clusters measured as normalized Shannon index, which reflects the unevenness of the cell distribution across clusters (Wilcoxon rank-sum test; see Methods). The lower the value, the more focused is the mapping.
Figure 4
Figure 4
Clonality and clonal overlap between the T helper (Th) cell clusters. (a). Relative clonality of the single-cell RNA sequencing (scRNA-Seq) Th clusters represented as unique TCRβ CDR3/cell count ratio. Each dot represents one donor. (b) Heatmap visualization of the clonal (nucleotide-defined TCRβ CDR3) overlaps between the scRNA-Seq clusters measured as the number of shared clonotypes between the clusters of the same donor (122 donors used) divided by the number of clonotypes in each cluster (D metrics in VDJtools). The D metric is multiplied by a scale factor (106) and then log2(1 + x) transformed for comprehensive values (32, 33).
Figure 5
Figure 5
Top genes that distinguished peripheral T helper (Th) single-cell RNA sequencing (scRNA-Seq) clusters. The top 5 differentially expressed genes per cluster are shown. For visualization, 500 cells were randomly selected from each cluster.
Figure 6
Figure 6
Interferon (IFN) response clusters in healthy donors and coronavirus disease 2019 (COVID-19) patients. (a) Uniform manifold approximation and projection (UMAP) plots grouped by disease severity. The “Eff-Mem IFN response” and “Naive IFN response” clusters are nearly absent in healthy individuals. (b) Proportion of the samples occupied by the “Eff-Mem IFN response” or the “Naive IFN response” cluster (normalized cluster size). Medians are shown as red lines. The p-values for ANOVA are shown on top. Post-hoc pairwise analysis was performed with Tukey’s honest significant difference (HSD) test, and p < 0.05 are shown. (c) Inverse correlation between the proportions of Naive+Naive RTE versus Naive IFN-induced subsets within T helper (Th) cells. Color indicates the patient status on the day of sample collection. r is Pearson’s correlation coefficient.
Figure 7
Figure 7
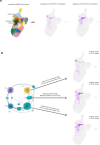
Positioning of the Th17/Th22 shared clonotypes. (a) Annotated single-cell RNA sequencing (scRNA-Seq) clusters and TCR-Track positioning of the sorted Th17 and Th22 subsets. (b) Uniform manifold approximation and projection (UMAP) positioning of the sorted Th17 clonotypes that do not overlap with the sorted Th22, the sorted Th22 clonotypes that do not overlap with the sorted Th17, and the overlapping clonotypes. Cytoscape network plot adapted from (28).

References

    1. Kunzli M, Masopust D. Cd4(+) T cell memory. Nat Immunol. (2023) 24:903–14. doi: 10.1038/s41590-023-01510-4 - DOI - PMC - PubMed
    1. Sallusto F. Heterogeneity of human cd4(+) T cells against microbes. Annu Rev Immunol. (2016) 34:317–34. doi: 10.1146/annurev-immunol-032414-112056 - DOI - PubMed
    1. Borst J, Ahrends T, Babala N, Melief CJM, Kastenmuller W. Cd4(+) T cell help in cancer immunology and immunotherapy. Nat Rev Immunol. (2018) 18:635–47. doi: 10.1038/s41577-018-0044-0 - DOI - PubMed
    1. McDonald DR. Th17 deficiency in human disease. J Allergy Clin Immunol. (2012) 129:1429–35; quiz 36-7. doi: 10.1016/j.jaci.2012.03.034 - DOI - PMC - PubMed
    1. Cook MC, Tangye SG. Primary immune deficiencies affecting lymphocyte differentiation: lessons from the spectrum of resulting infections. Int Immunol. (2009) 21:1003–11. doi: 10.1093/intimm/dxp076 - DOI - PubMed

MeSH terms

LinkOut - more resources