. 2025 Apr 4:16:1541252.
doi: 10.3389/fimmu.2025.1541252. eCollection 2025.

Clinical potential and experimental validation of prognostic genes in hepatocellular carcinoma revealed by risk modeling utilizing single cell and transcriptome constructs

Affiliations

Clinical potential and experimental validation of prognostic genes in hepatocellular carcinoma revealed by risk modeling utilizing single cell and transcriptome constructs

Hang Deng et al. Front Immunol. .

Abstract

Background: Hepatocellular carcinoma (HCC) is the leading cause of tumor-related mortality worldwide. There is an urgent need for predictive biomarkers to guide treatment decisions. This study aimed to identify robust prognostic genes for HCC and to establish a theoretical foundation for clinical interventions.

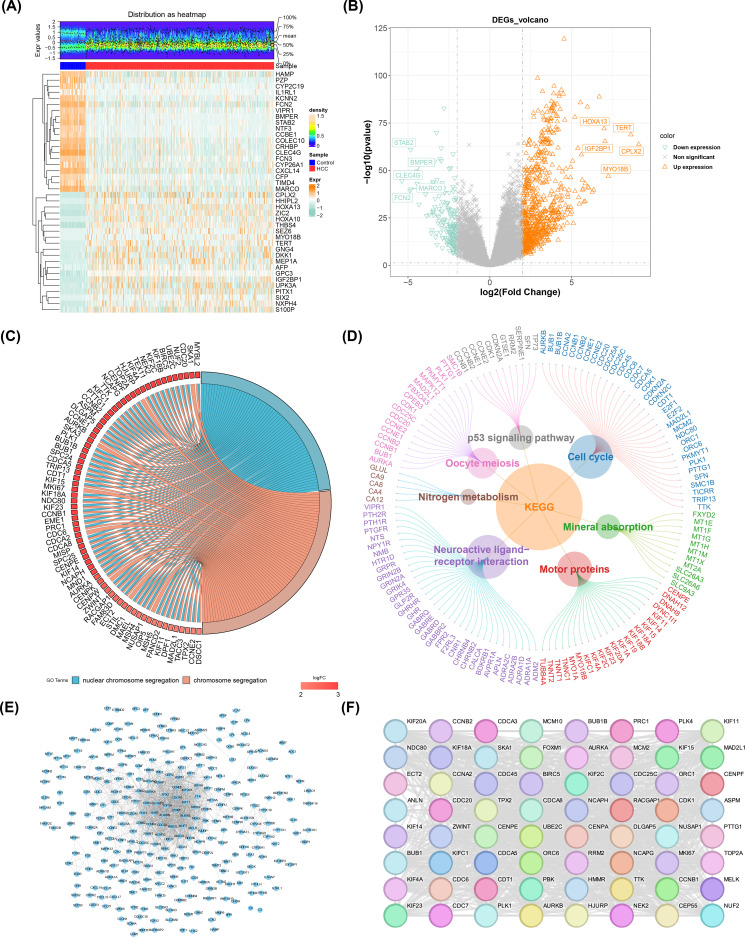
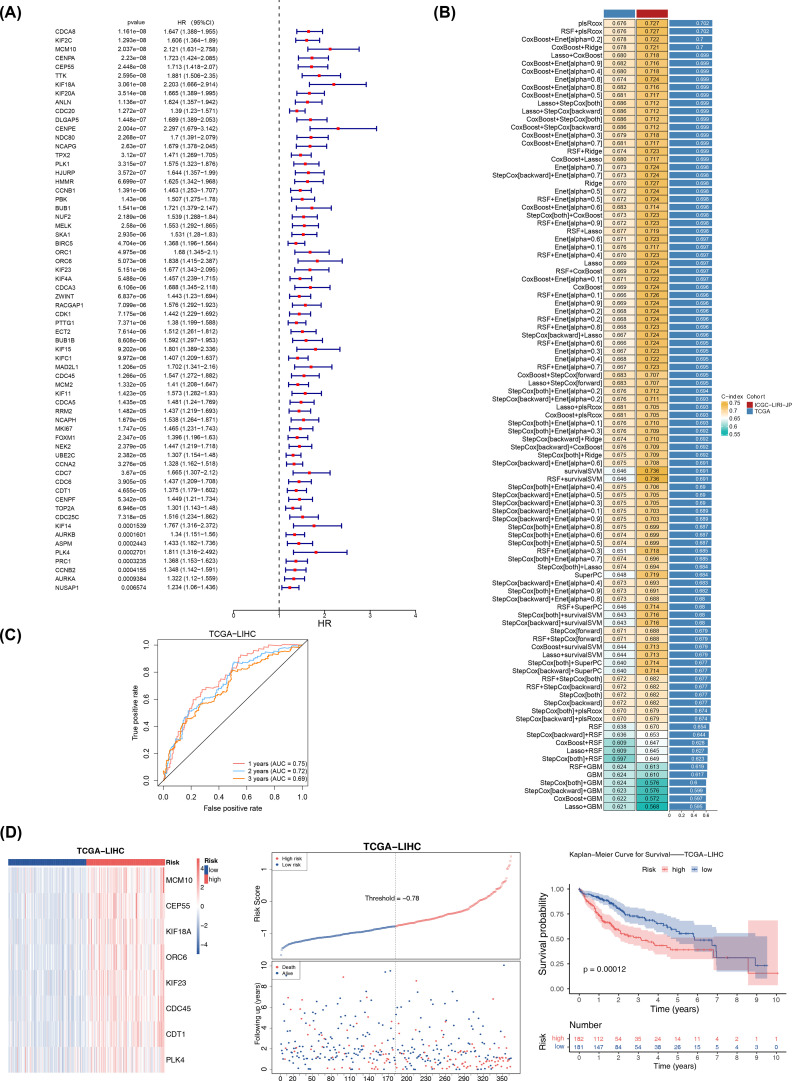
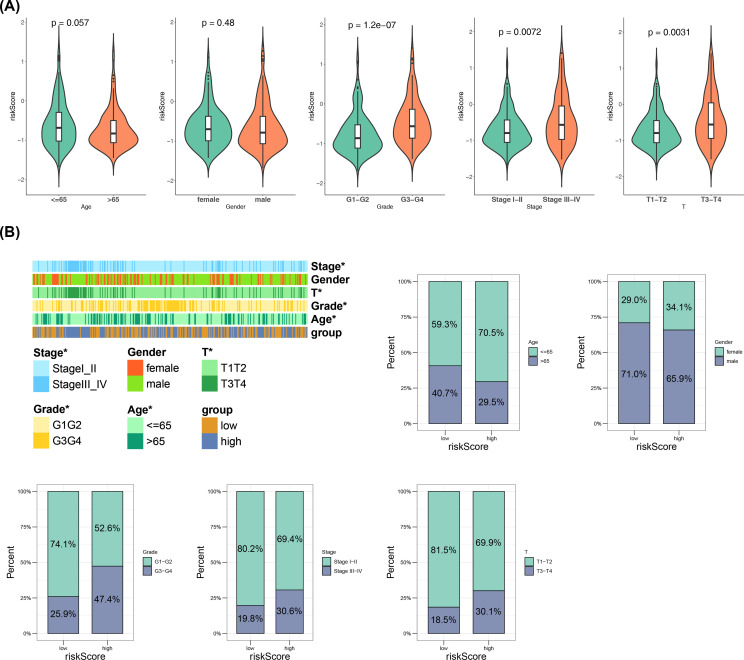
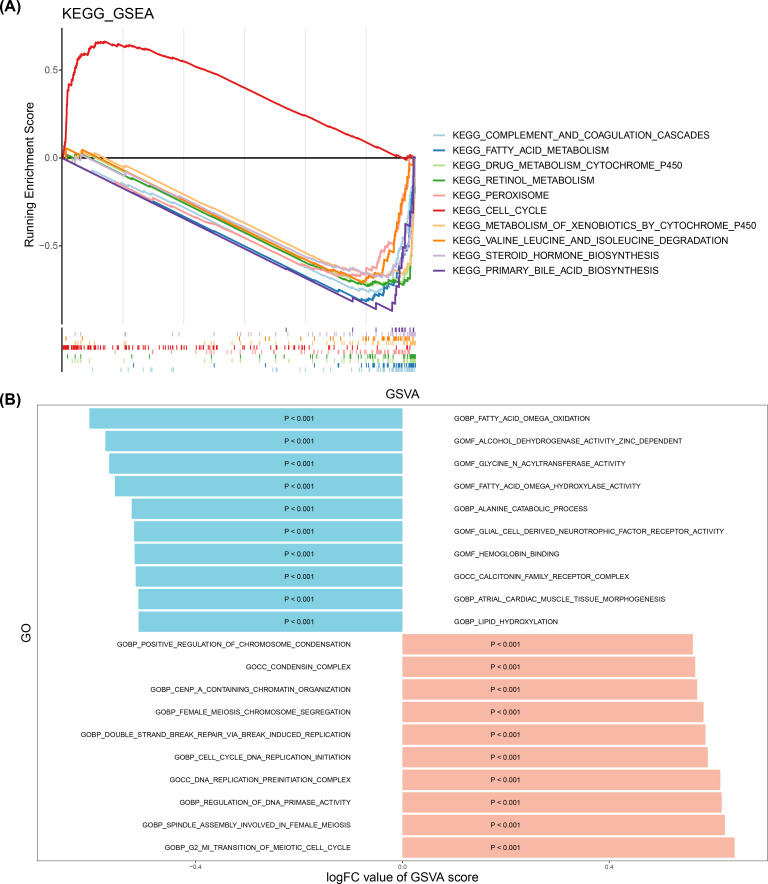
Methods: The HCC datasets were obtained from public databases and then differential expression analysis were used to obtain significant gene expression profiles. Subsequently, univariate Cox regression analysis and PH assumption test were performed, and a risk model was developed using an optimal algorithm from 101 combinations on the TCGA-LIHC dataset to pinpoint prognostic genes. Immune infiltration and drug sensitivity analyses were conducted to assess the impact of these genes and to explore potential chemotherapeutic agents for HCC. Additionally, single-cell analysis was employed to identify key cellular players and their interactions within the tumor microenvironment. Finally, reverse transcription-quantitative polymerase chain reaction (RT-qPCR) was utilized to validate the roles of these prognostic genes in HCC.

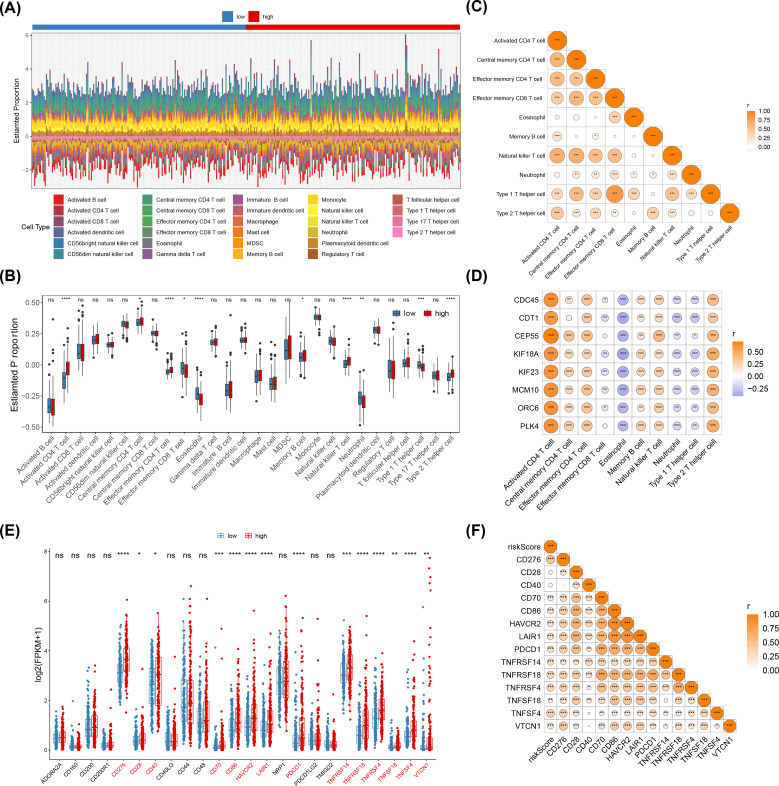
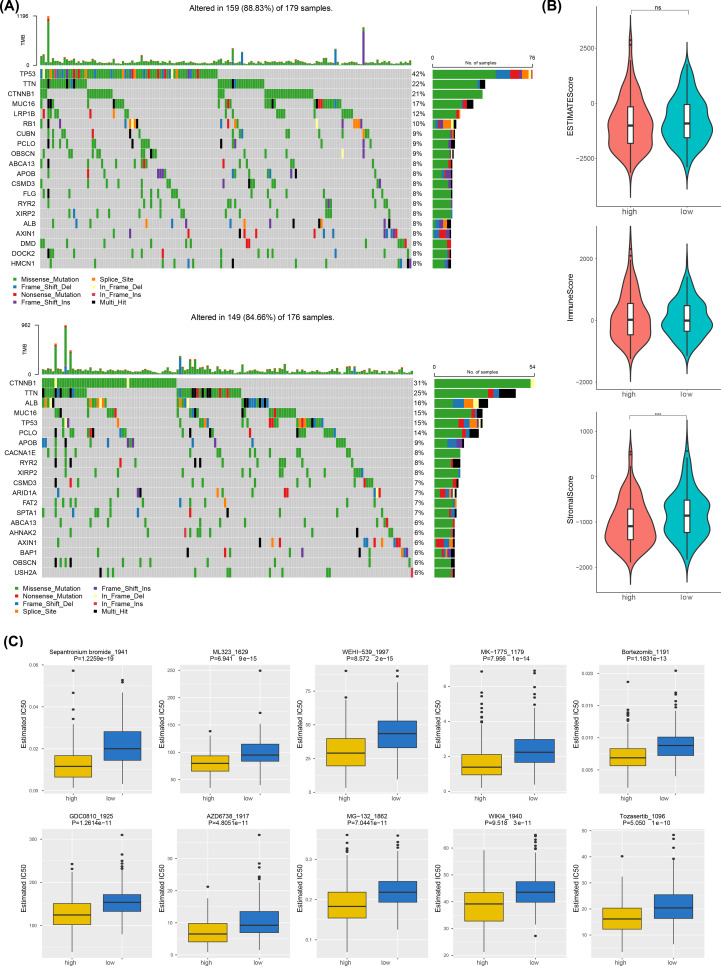
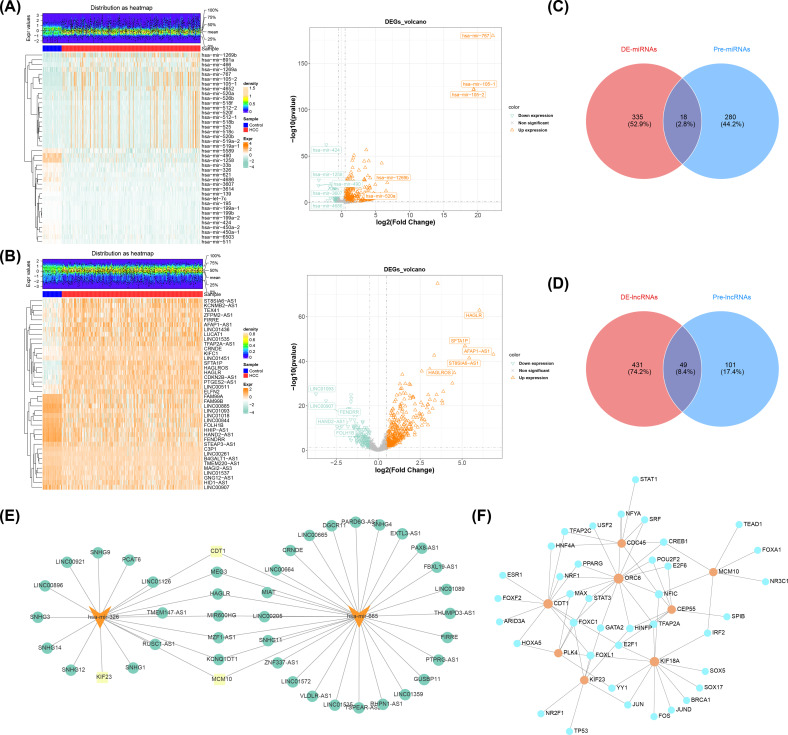
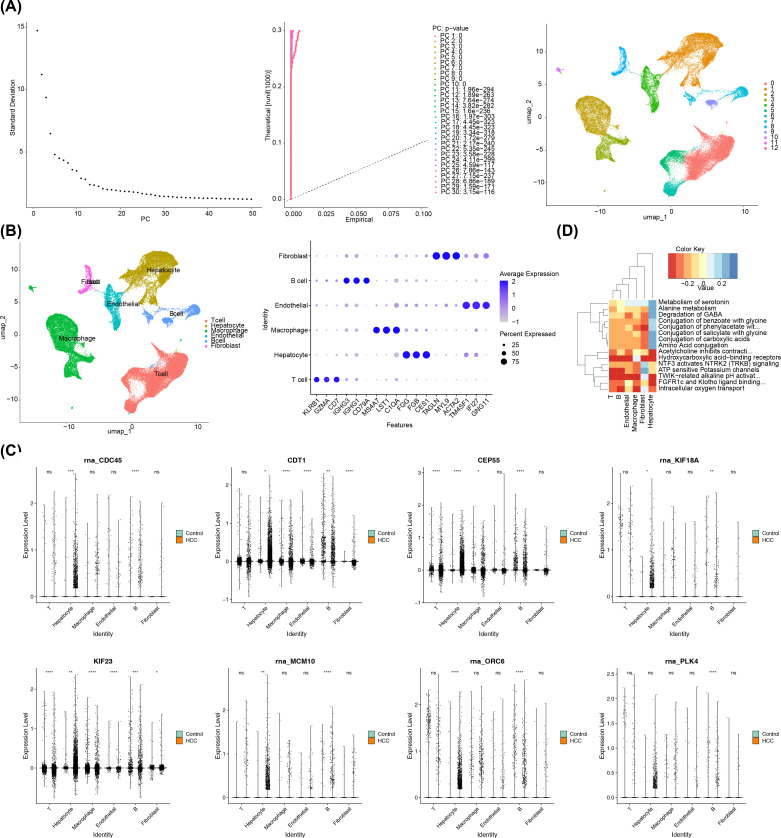
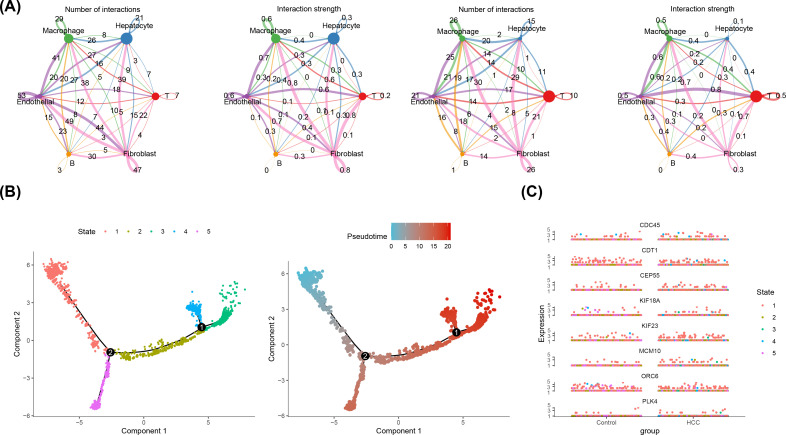
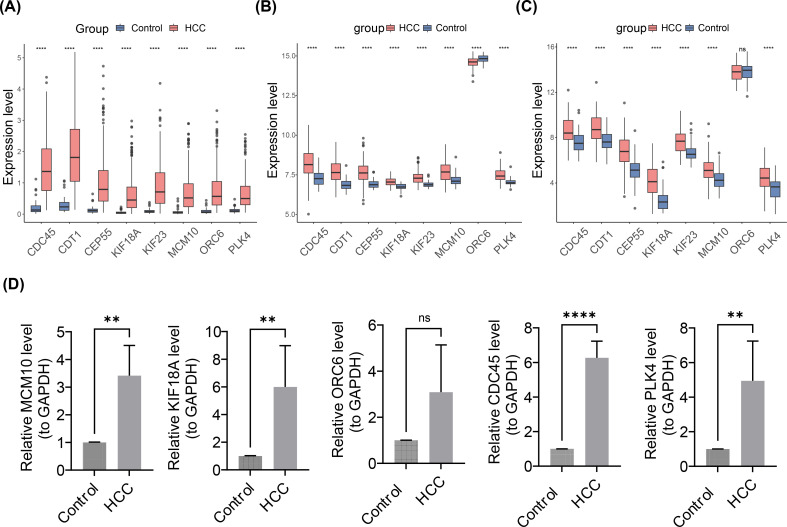
Results: A total of eight prognostic genes were identified (MCM10, CEP55, KIF18A, ORC6, KIF23, CDC45, CDT1, and PLK4). The risk model, constructed based on these genes, was effective in predicting survival outcomes for HCC patients. CEP55 exhibited the strongest positive correlation with activated CD4 T cells. The top 10 drugs showed increased sensitivity in the low-risk group. B cells were identified as key cellular components with the highest interaction numbers and strengths with macrophages in both HCC and control groups. Prognostic genes were more highly expressed in the initial state of B cell differentiation. RT-qPCR confirmed significant upregulation of MCM10, KIF18A, CDC45, and PLK4 in HCC tissues (p< 0.05).

Conclusion: This study successfully identified eight prognostic genes (MCM10, CEP55, KIF18A, ORC6, KIF23, CDC45, CDT1, and PLK4), which provided new directions for exploring the potential pathogenesis and clinical treatment research of HCC.

Keywords: combination algorithms; drug sensitivity; hepatocellular carcinoma; prognostic genes; single-cell sequencing analysis.


Conflict of interest statement

The authors declare that the research was conducted in the absence of any commercial or financial relationships that could be construed as a potential conflict of interest.

Figures

Figure 1
Figure 1
DE-mRNA identification, enrichment and PPI network analysis. (A) Heatmap of the top 20 upregulated and downregulated genes expression. The uppermost plot represented the differential mRNA expression density distribution, showing lines for the five percentiles and the average value; the lower plot, each square represented a sample, with orange indicating high expression and green indicating low expression. (B) Volcano map of 890 DE-mRNAs from TCGA-LIHC. (C) Gene Ontology (GO) enrichment analysis. (D) KEGG enrichment analysis. (E) PPI Network Diagram of Differentially Expressed Genes (DEGs). (F) Core candidate gene relationship network.
Figure 2
Figure 2
Prognostic risk model was construct in TCGA-LIHC. (A) Univariate Cox Forest plot of 64 genes associated with hepatocellular carcinoma. (B) Combined results of 101 combination algorithms. (C) ROC analysis illustrating the high diagnostic value of prognostic genes. (D) The left plot showed the heatmap of gene expression in the high- and low-risk groups based on the model (training set). The middle plot displayed the risk curve, with the x-axis representing the patient samples ordered from low to high risk based on their risk scores, with increasing risk scores from left to right. The upper part of the plot had the y-axis representing the risk scores, with red indicating high-risk group samples and blue indicating low-risk group samples. The lower part of the plot had the y-axis representing survival status, with blue indicating surviving samples and red indicating deceased samples. The dashed line represented the median risk score. The right plot displayed the Kaplan-Meier curve for the high-risk and low-risk groups based on the risk model (with the median risk score of -0.78). The x-axis represented time, the upper part of the y-axis represented survival rate, and the lower part of the y-axis represented different groups, with numbers indicating the number of surviving samples.
Figure 3
Figure 3
Relationship of risk model with clinical characteristics. (A) Violin plots of clinical feature distributions. (B) Heatmap of different subtypes of clinical features between high and low risk groups and distribution of risk scores in subgroups defined by clinical characteristics.
Figure 4
Figure 4
Signaling pathways analysis. (A) Top 10 KEGG pathway enrichment analysis results. (B) GSVA enrichment analysis outcomes between high- and low-risk groups (pink: represents upregulated pathways; blue: represents downregulated pathways).
Figure 5
Figure 5
Analysis of immune cells in high and low risk groups for HCC. (A) Heatmap of the immune cell scores of the high-risk and low-risk groups for hepatocellular carcinoma, visualizing the difference in immune cell status between the two groups. (B) Box line plot of immune cell score between high risk group and low risk group. (C) Heat map of prognostic genes and differential immune cell correlation. (D) Heatmap of prognostic genes correlating with differential immune cells. (E) Immune checkpoint gene expression in high-risk and low-risk groups. ns: Not significant, *p< 0.05, **p< 0.01, ***p< 0.001.****p< 0.0001. (F) Risk score and immune checkpoint molecular correlation analysis. ns, p > 0.05; *p< 0.05; **p< 0.01; ***p< 0.001.
Figure 6
Figure 6
Mutated landscapes, ESTIMATE, and drug sensitivity analysis. (A) Shows the top 20 most frequently mutated genes in the low-risk group (below) and the high-risk group (above). (B) Comparison of immune score, stromal score, and composite score between high-risk and low-risk groups by ESTIMATE analysis. (C) Drug sensitivity analysis between high-risk and low-risk groups, with the inhibitory effect of the drug expressed as the IC50 value (50% inhibitory concentration).
Figure 7
Figure 7
Analysis of differentially expressed miRNAs and lncRNAs in HCC and associated networks. (A) Heat map (left) and volcano map (right) of differentially expressed miRNAs. (B) Heat map (left) and volcano plot (right) of differentially expressed lncRNAs. (C) Venn diagram of miRNAs. (D) Venn diagram of lncRNAs. (E) Prognostic gene-miRNA-incRNA interaction network (yellow indicates prognostic genes, orange indicates miRNAs, and green indicates lncRNAs). (F) Prognostic gene-transcription factor (TF) regulatory network JASPAR prediction results (orange indicates prognostic genes, and blue indicates transcription factors).
Figure 8
Figure 8
A comprehensive single-cell sequencing analysis in HCC. (A) PCA displacement test and inflection plot; cell UMAP clustering plot. (B) The left panel showed the cell clustering subpopulation annotation results, and the right panel showed the gene bubble map for each cluster annotation marker. (C) Differential expression of prognostic genes in subpopulations. The left column is the control group and the right column is the HCC group. (D) Enrichment pathway of key cells. The Color Key represented the scores of the gene set in the cells, indicating the overall expression level of the gene set in the cells. Red indicated that the gene set was overall lowly expressed in the cells, while blue indicated that the gene set was overall highly expressed in the cells.
Figure 9
Figure 9
Cellular Communication and Proposed Timing Analysis. (A) Cellular communication network of key cells in HCC group (left two figures) and control group (right two figures). ‘Number of Interactions’ represents the frequency of cell-to-cell interactions; ‘Interaction Strength’ indicates the strength of cell-to-cell interactions. (B) Proposed time trajectory analysis of key B cells. The left panel shows the proposed time trajectory, with the transition from blue to red indicating the order of cell differentiation. The right panel shows the various states of the cell throughout the differentiation process. (C) Differential expression of 8 prognostic genes over time in the control and HCC groups.
Figure 10
Figure 10
Expression Validation Analysis of Prognostic Gene in Control and HCC Groups. (A-C) Box plots of the expression profiles of 8 prognostic genes. (A) TCGA-LIHC dateset. (B) GSE76427 dataset. (C) GSE54236 dataset. ns represented no significance, **** represented p< 0.0001. (D) Reverse transcription quantitative polymerase chain reaction expression validation. From left to right are MCM10, KIF18, ORC6, CDC45, PLK4. ns represented not significant, ** represented p< 0.01, **** represented p< 0.0001.

Similar articles

References

    1. Bray F, Laversanne M, Sung H, Ferlay J, Siegel RL, Soerjomataram I, et al. . Global cancer statistics 2022: GLOBOCAN estimates of incidence and mortality worldwide for 36 cancers in 185 countries. CA Cancer J Clin. (2024) 74:229–63. doi: 10.3322/caac.21834 - DOI - PubMed
    1. Kulik L, El-Serag HB. Epidemiology and management of hepatocellular carcinoma. Gastroenterology. (2019) 156:477–91.e1. doi: 10.1053/j.gastro.2018.08.065 - DOI - PMC - PubMed
    1. Zhou H, Song T. Conversion therapy and maintenance therapy for primary hepatocellular carcinoma. Biosci Trends. (2021) 15:155–60. doi: 10.5582/bst.2021.01091 - DOI - PubMed
    1. Brown ZJ, Tsilimigras DI, Ruff SM, Mohseni A, Kamel IR, Cloyd JM, et al. . Management of hepatocellular carcinoma: A review. JAMA Surg. (2023) 158:410–20. doi: 10.1001/jamasurg.2022.7989 - DOI - PubMed
    1. Vogel A, Meyer T, Sapisochin G, Salem R, Saborowski A. Hepatocellular carcinoma. Lancet. (2022) 400:1345–62. doi: 10.1016/S0140-6736(22)01200-4 - DOI - PubMed

MeSH terms

Substances