Review
. 2025 Jun 24:13:670.
doi: 10.12688/f1000research.149263.3. eCollection 2024.

Recent advances in the design of SERS substrates and sensing systems for (bio)sensing applications: Systems from single cell to single molecule detection

Affiliations
Review

Recent advances in the design of SERS substrates and sensing systems for (bio)sensing applications: Systems from single cell to single molecule detection

Sai Ratnakar Tadi et al. F1000Res. .

Abstract

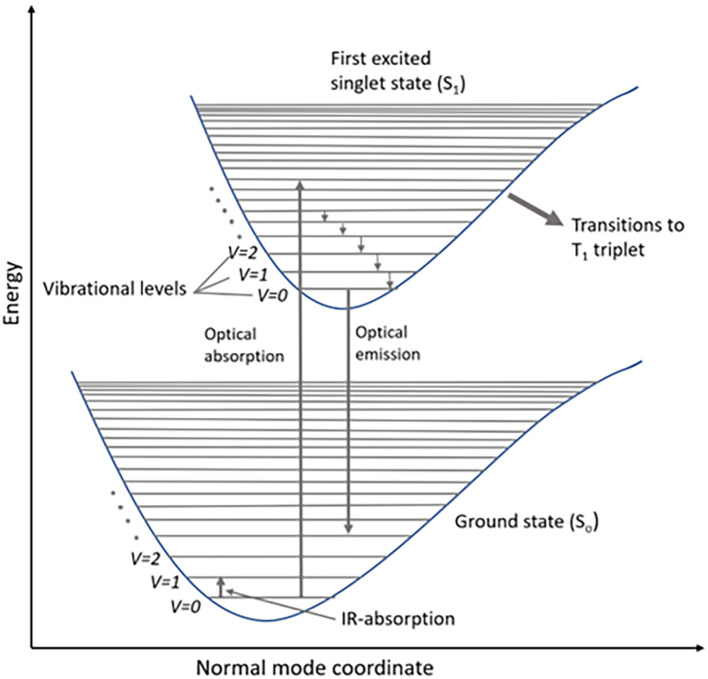
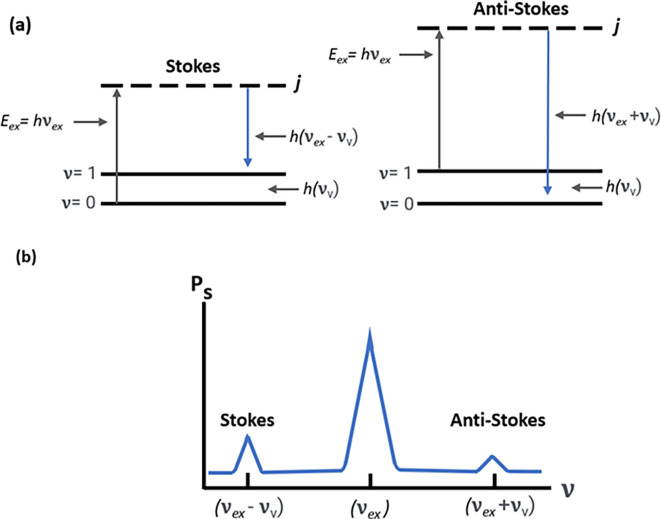
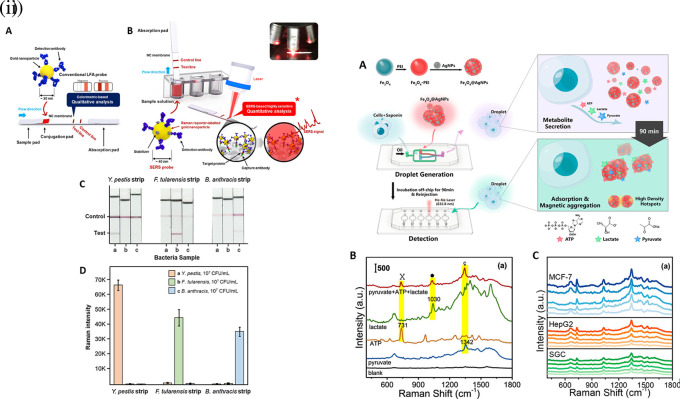
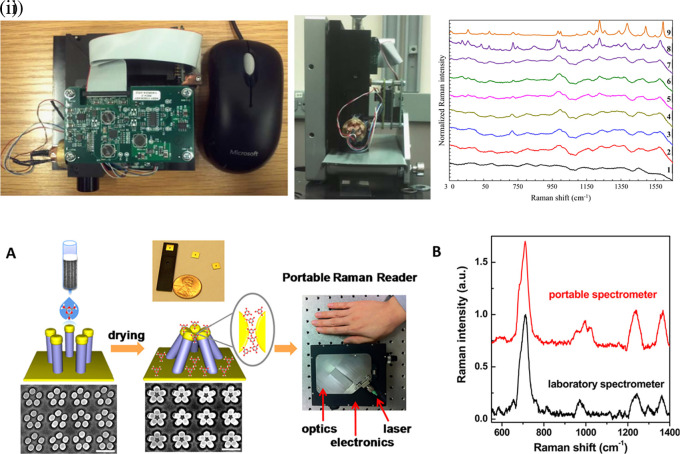
The Raman effect originates from spontaneous inelastic scattering of photons by matter. These photons provide a characteristic fingerprint of this matter, and are extensively utilized for chemical and biological sensing. However, the phenomenon do not hold potential for its direct use in sensing applications, since the generation of the Raman scattered photons is inherently low. Surface enhanced Raman spectroscopy (SERS) overcomes the low sensitivity associated with Raman spectroscopy and assists the sensing of diverse analytes, including ions, small molecules, inorganics, organics, radionucleotides, and cells. Plasmonic nanoparticles exhibit localized surface plasmon resonance (LSPR) and when they are closely spaced, they create hotspots where the electromagnetic field is significantly enhanced. This amplifies the Raman signal and may offer up to a 10 14-fold SERS signal enhancement. The development of SERS active substrates requires further consideration and optimization of several critical features such as surface periodicity, hotspot density, mitigation of sample or surface autofluorescence, tuning of surface hydrophilicities, use of specific (bio) recognition elements with suitable linkers and bioconjugation chemistries, and use of appropriate optics to obtain relevant sensing outcomes in terms of sensitivity, cross-sensitivity, limit of detection, signal-to-noise ratio (SNR), stability, shelf-life, and disposability. This article comprehensively reviews the recent advancements on the use of disposable materials such as commercial grades of paper, textiles, glasses, polymers, and some specific substrates such as blue-ray digital versatile discs (DVDs) for use as SERS-active substrates for point-of-use (POU) sensing applications. The advancements in these technologies have been reviewed and critiqued for analyte detection in resource-limited settings, highlighting the prospects of applications ranging from single-molecule to single-cell detection. We conclude by highlighting the prospects and possible avenues for developing viable field deployable sensors holding immense potential in environmental monitoring, food safety and biomedical diagnostics.

Keywords: Bioreceptor.; Disposable substrates; Point-of-use; Raman effect; Single-molecule sensing; Surface Enhanced Raman Spectroscopy.


Conflict of interest statement

No competing interests were disclosed.

Figures

Figure 1.
Figure 1.. Schematic representation of energy levels of a molecule in a Jablonski diagram.
Figure 2.
Figure 2.. (a) Stokes and anti-stokes scattering due to energy changes in electronic excitation and emission.
(b) Raman spectrum depicting Stokes scattering and anti-stokes scattering.
Figure 3.
Figure 3.. Schematic illustration of electromagnetic (EM) enhancement with specifics of the two-step enhancement mechanism (This figure has been reproduced with permission from ( Ding et al., 2016) Copyright (2016) Nature Reviews Materials).
Figure 4.
Figure 4.. Sample illumination systems used in point-of-use (POU)- SERS devices (i) (A) Optical configuration: 1) 785 nm laser, 2) amplified spontaneous emission (ASE) filters, 3) dichroic mirror, 4) −100 mm meniscus lens, 5) 2″ silver-coated parabolic mirror with 4″ of focus and central 3.2 mm hole in the parallel direction, 6) silver mirror, 7) 2″ aspheric sample lens, 8) sample pellet, 9) 600 μm slit, 10) collimator lens, 11) notch filters, 12) focusing lens, 13) 100 μm optical fiber. (B) Sample holder coupled to the stepper motor for rotating the pellet. (This figure has been reproduced with permission from ( Paiva et al., 2020) Copyright (2020) Spectrochimica Acta Part A: Molecular and Biomolecular Spectroscopy), (ii) Schematic representation of the assay system using Raman spectroscopy for sensing in liquid samples (This figure has been reproduced with permission from ( Kawahara‐Nakagawa et al., 2019) Copyright (2019) Protein Science), (iii) Raman-FTIR device for continuous measurement of the sensor output (DC conductivity) (This figure has been reproduced with permission from ( Sänze et al., 2013) Copyright (2013) Angewandte Chemie).
Figure 5.
Figure 5.. (a) Block diagram of the experimental design of the fiber-optic SERS probe and the Au substrate in the measurement chamber, (b) Schematic illustration of the light transmission through the Ag nanoparticle layered fiber-optic SERS probe (This figure has been reproduced with permission from ( Agarwal et al., 2016) Copyright (2016) Sensors and Actuators B: Chemical).
Figure 6.
Figure 6.. Schematic of the visible laser-based FT-Raman spectrometer (P-Pinhole 2mm diameter, PM1, PM2 and PM3- Parabolic mirrors, M1, M2, M3, M4, and M5- Dielectric mirrors, F1 and F2- Long-pass filters, BS-Quartz beam splitter, PMT-Photo-multiplier tube) (This figure has been reproduced with permission from ( Dzsaber et al., 2015) Copyright (2015) Journal of Raman Spectroscopy).
Figure 7.
Figure 7.. SERS systems for point-of-use sensing (i) Schematic of SERS-based lateral flow immunoassay (LFIA) system for ultrasensitive detection of thyroid stimulating hormone (TSH) (This figure has been reproduced with permission from ( Choi et al., 2017), Copyright (2017) Sensors and Actuators B: Chemical), (ii) Schematic of Au@AgPt@MCH synthesis and the sensing of Hg 2+ by colorimetric/SERS strategy (This figure has been reproduced with permission from ( C. Song et al., 2020), Copyright (2020) Sensors and Actuators B: Chemical).
Figure 8.
Figure 8.. Hotspot engineering with 0D & 1D materials for SERS signal enhancement (i) (A) TEM images of the composite material obtained after calcination of [Au(SPh)]n fibers at 230 oC for 1 hour, (B) Photographs and (C) Powder X-ray diffraction (PXRD) patterns fibers calcined at various temperatures and time durations, (D) Comparison of the Raman spectra of 4-mercaptobenzoic acid (4-MBA) (5 x 10 −2 M), the fibers calcined at 230 o C–1 h and a solution of 4-MBA with the fibers calcined at 230 o C–1 h, and (E) a zoomed in version of the spectra. (This figure has been reproduced with permission from ( Vaidya et al., 2020), Copyright from (2020) Journal of Materials Chemistry) (ii) (a, b) Atomic force microscopy (AFM) images of the synthesized and chemically etched Ag nanowires, (c) Average EF per pixel of etched and synthesized Ag nanowires and Ag film. (This figure has been reproduced with permission from ( Goh et al., 2012), Copyright (2012) Langmuir).
Figure 9.
Figure 9.. Hotspot engineering with 2D materials for SERS signal enhancement (i) Graphical representation of the 2D mildly reduced-graphene oxide (MR-GO) substrate for Rhodamine B detection and the corresponding SERS spectra depicting increased SERS intensity (This figure has been reproduced with permission from ( X. Yu et al., 2011), Copyright (2011) ACS Nano), (ii) (A) Schematic representation of Au TNAs/graphene/Au NP fabrication. (B) SERS spectra of varying concentrations of 4-NTP absorbed on 9nm thick Au TNAs/monolayer graphene. (This figure has been reproduced with permission from ( X. Zhang et al., 2017), Copyright (2016) Nano micro small).
Figure 10.
Figure 10.. Hotspot engineering with 3D materials for SERS signal enhancement (i) (a) Schematic illustration of the developed interfacial self-assembly near the oil/water interface, (b) adopting a planar configuration, C3-octahedra- octahedra aligned edge to edge, C16-octahedra-square superlattice with a pyramidal protrusions with square superlattice, (c) AFM characterization of PDMS with various functionalized Ag octahedra and the Ag octahedra length (%) immersed into the oil phase (This figure has been reproduced with permission from ( Y. H. Lee et al., 2015), Copyright (2015) Nature Communications), (ii) (A) Schematic representation of the synthesis protocol (B) The measured SERS spectra of vac 1Au 11 (blue), vac 1Au 5 (red), vac 1Au 1 (gray) arrays, as displayed in the TEM images (This figure has been reproduced with permission from ( Udayabhaskararao et al., 2017), Copyright (2017) Science).
Figure 11.
Figure 11.. Effect of substrate hydrophobicity on SERS signal enhancement (i) (A-B) MicroPillars of silicon containing ordered hexagonal lattices, coated with electroless grown silver aggregates, (C) SEM image of the residual Rhodamine 6G (R6G) by the end of solvent evaporation, and (D) Characteristic Raman spectrum of R6G. (This figure has been reproduced with permission from ( Gentile et al., 2010), Copyright (2010) Microelectronic Engineering), (ii) Graphical illustration of a droplet and its evaporation at specific solute deposition spot due to the hydrophobic substrate surface. (b) SEM images of the drop diameter and the solute suspended on the nanopillars. (c) Recorded contact angles during evaporation at varying time intervals, (e) Measurement of Raman map of rhodamine and (f ) the associated Raman spectrum (This figure has been reproduced with permission from ( De Angelis et al., 2011), Copyright (2011) Nature Photonics).
Figure 12.
Figure 12.. Effect of substrate periodicity on SERS signal enhancement (i) (A) 1-3: C 11 resorcinarene derivatives (Left); C 12 thiol capped Au nanocrystals, resorcinarene 1, and cavitand 3 (control), (B) SERS spectra of resorcinarene 6 measured from Au nanoparticle arrays, with a 785 nm laser, (C) (a) G values with excitation wavelengths at 1064, 785, 647 nm; (b) G values with 785 nm using varying solid angles, as determined by the numerical aperture (N.A.) of the collection objective. (This figure has been reproduced with permission from ( A. Wei, 2006), Copyright (2007) Chemical Communications), (ii) (a) Schematic illustration of the self-assembled AuNP metafilm (b) SEM image of the fabricated metafilm with 3ml AuNP solution (c) Thiram SERS spectra (1000-0.5 ppm) obtained from a AuNP metafilm by swabbing the orange surface (This figure has been reproduced with permission from ( N. Yang et al., 2019) Copyright (2019) Langmuir).
Figure 13.
Figure 13.. (a) Photoreduction process for the synthesis of AuNPs arranged on graphene oxide (GO) flakes (AuNPs@GO). (b) The hydrophobic (h)-paper-based SERS substrate was fabricated by drop-casting 50 μL AuNPs@GO solution onto the h-paper (This figure has been reproduced with permission from ( Dong-Jin Lee & Dae Yu Kim, 2019), Copyright (2019) Sensors).
Figure 14.
Figure 14.. Schematic illustration of the SERS Q-tip on cotton swab for 2, 4-DNT detection and the associated SERS spectra.
(This figure has been reproduced with permission from ( Z. Gong et al., 2014), Copyright (2014) Applied materials & Interfaces).
Figure 15.
Figure 15.. Schematic illustration of the process for the fabrication of the GO/AgNPs/P-PMMA substrate.
(This figure has been reproduced with permission from ( X. Zhao et al., 2018), Copyright from (2018) Applied Surface Science).
Figure 16.
Figure 16.. Digital versatile disc (DVD)-based disposable substrate for SERS-based sensing (i). (a) Large-scale SEM images from AgNPs@AgDVD sample, (b) AFM image from AgNPs@AgDVD, and (c) Comparison between literature data of several Ag-based SERS substrates and the results of this study (EF values, reproducibility and repeatability) (This figure has been reproduced with permission from ( Giallongo et al., 2011), Copyright from (2011) Plasmonics), (ii) (A) FESEM image of BR(Blue ray) DVD substrate. The inset image shows the distribution of AuNPs on the substrate. (B) Characteristic SERS signal intensities scattered from the mixture of albumin, creatinine and urea when mixed in different ratio (This figure has been reproduced with permission from ( Chamuah et al., 2019) Copyright (2019) Sensors and Actuators B: Chemical).
Figure 17.
Figure 17.. Silica-based disposable substrate for SERS-based sensing (i). Graphical abstract of mesoporous Ag-TiO 2 nanocage for biosensing application (This figure has been reproduced with permission from ( S. Das et al., 2022), Copyright from (2022) Optical Materials), (ii) (A) SEM images of AuNPs on square glass coverslips coated with 4 nm and annealed for different time periods (a) 1 h, (b) 3 h, (c) 6 h, and (d) 9 h at 550°C, (B) SERS spectra of (1,2-bis-(4-pyridyl)-ethene) BPE molecules of different concentrations (10 −3, 10 −5, 10 −7, 10 −9, and 10 −12 M) using 4 nm gold-coated coverslips annealed at 550°C for 3 h on a hot plate. Inset-photo of a coverslip after the deposition of five different BPE concentrations (This figure has been reproduced with permission from ( L. Zhou et al., 2019), Copyright from (2019) Biosensors).
Figure 18.
Figure 18.. (A) Schematic diagram of AuNP@ZIF-8 synthesis, (B) Schiff’s base reaction of capture aldehyde vapors and covalent linkage with the GSPs. (C) SEM of gold superparticles (GSPs) from monodispersed AuNPs (D avg ≈ 5.8 nm), (D) SEM images of GSPs@ZIF-8 (This figure has been reproduced with permission from ( Qiao et al., 2018), Copyright from (2017) Advanced Materials).
Figure 19.
Figure 19.. (A) Synthesis of AuNPs@MSF at air-water interface, (B) UV-Visible absorption spectra of AuCl 4- silica films before and after UV irradiation exposure (C) SERS spectra of AuNPs @MSF mixed with 2,4-D and 2,4-D solid respectively (D) SERS spectra of AuNPs@MSF mixed with pymetrozine and pymetrozine solid respectively (E) SERS spectra of AuNPs@MSF mixed with thiamethoxam and thiomethoxam solid respectively (This figure has been reproduced with permission from ( Y. Xu, Kutsanedzie, et al., 2020b), Copyright (2020) Food Chemistry).
Figure 20.
Figure 20.. (A) Illustration demonstrating synthesis of polymer-AuNP-aptamer substrates for the SERS based detection of malathion (B) Comparison of SERS detection of malathion at 495 cm -1 peak with polymer-AuNPs aptamer substrates 16.5 μg/mL of malathion (A) 3.3 μg/mL of malathion (B) and blank buffer solution (C) Spectra are offset for clarity.
(This figure has been reproduced with permission from ( Barahona et al., 2013), Copyright from (2013) Industrial Biotechnology).
Figure 21.
Figure 21.. (i) Schematic illustration of dual-reporter SERS immunoassays for the detection of two proteins labelled with dual prostate-specific antigen (PSA) markers for simultaneous detection from the two SERS tags (This figure has been reproduced with permission from ( P. Li et al., 2020), Copyright from (2020) Current opinion in Biomedical Engineering). (ii) Representation of SERS based nanosensor to monitor the cellular secretion. The SERS nanosensor is positioned under the Raman microscope and monitored in real-time detection for the molecules diffused from the MDCKII epithelial cells. (This figure has been reproduced with permission from ( Lussier et al., 2016), Copyright (2016) ACS Nano letters).
Figure 22.
Figure 22.. Disposable SERS system for specific detection of pesticides and chemicals (i) (a) Preparation of the SERS substrate for the detection of food contaminants (thiram and melamine from apple juice and milk respectively), (d, e) SEM images of the dendritic silver nanostructures, (g-f) SERS spectra of thiram (peak at 1384 cm -1) and melamine (peak at 695 cm -1) at varying concentrations, in unprocessed apple juice and milk samples (This figure has been reproduced with permission from ( Dies et al., 2018), Copyright from (2018) Sensors), (ii) (A) Schematic of the paper-based SERS substrates for the detection of methyl parathion on the fruit peels surface, (B) SERS spectra of methyl parathion (MP) (concentration range-0.018 μg/cm 2 to 35.368 μg/cm 2) with a paper-based substrate, and (C) SERS spectra of MP on the surface of apple using the paper-based substrate (This figure has been reproduced with permission from ( J. Xie et al., 2020), Copyright from (2020) Spectrochimica Acta Part A: Molecular and Biomolecular Spectroscopy).
Figure 23.
Figure 23.. (A) Photographs of (a) pure PMMA film, (b) Au/PMMA-1 film, (c) A/PMMA-2 film, (d) Au/PMMA=3 film, (e) Au/PMMA-4 film; (B, D) D Photographs of the SERS-based detection of (B) Ciprofloxacin and (C) Chloramphenicol on chicken wings with flexible Au-NSs/PMMA SERS substrate using 532 nm laser and (D, E) their corresponding SERS spectra (This figure has been reproduced with permission from ( Riswana Barveen et al., 2022), Copyright (2022) Chemical Engineering Journal).
Figure 24.
Figure 24.. (A) Schematic illustration of the SERS based detection of Hg 2+ ion on the Au NRs@Thymine (This figure has been reproduced with permission from ( H. Yang et al., 2017), Copyright from (2017) Nanomaterials). (B) TEM image of the Au NRs@T adsorbed with Hg 2+ ions, (C) SERS spectra of the Au NRs@T with varying Hg 2+ ion concentrations.
Figure 25.
Figure 25.. (A) Detailed schematic of the 3D paper-based microfluidic device for the detection method of miR-29a in a 3D paper-based microfluidic device; (B) Sample readout images with both colorimetric and SERS for samples with (+ve) and without miR-29a (−ve). and (C) SERS spectra representing the 18 pg μL −1 (blue) and 360 pg μL −1 (red) concentrations of miR-29a, highlighting three signature methyl green isothiocyanate (MGITC) peaks.
(This figure has been reproduced with permission from ( Mabbott et al., 2020), Copyright from (2019) Analyst).
Figure 26.
Figure 26.. (a) Schematic illustration of DMF-SERS-based immunoassay and bottom side of the DMF chip, (b) Characteristic peaks of 4-MBA on the DMF-SERS chip, (c) DMF chip (side-view) with a droplet on the magnetic beads, (d) Immunocomplex functionalized with SERs tags on magnetic beads, (e) SERS spectra of increasing concentrations (0-5000 pg/mL) of H 5N 1 sample, and (f) Cross-sensitivity of the DMF-SERS method (H5N1, 0.085 nM; PSA, CRP, HbsAg, 0.85 nM; cTnT, 0.135 nM) (This figure has been reproduced with permission from ( Y. Wang, Ruan, et al., 2018b), Copyright from (2018) Analytical Chemistry).
Figure 27.
Figure 27.. Disposable SERS systems for specific detection of whole cells (i) Schematics of (A) conventional LFA strip (B) SERS-based LFA strip. (C) Images of three strips and (D) SERS signal intensity for  Y. pestisF. tularensis, and  B. anthracis. (This figure has been reproduced with permission from ( R. Wang, Kim, et al., 2018b), Copyright from (2018) Sensors and Actuators B: Chemical), (ii) (A) Overview of SERS-microfluidic droplet platform for single-cell encapsulation and simultaneous detection of three metabolites produced by a single cell using Fe 3O 4@AgNPs nanocomposite, (B) Fe 3O 4@AgNPs nanocomposite for solo metabolite detection (ATP (731 cm –1), lactate (1030 cm –1), and pyruvate (1342 cm –1), respectively), (C) SERS of cellular metabolites content in SGC, HepG2, and MCF-7 cells (one to five cells from bottom to top, respectively) encapsulated in individual droplet. (This figure has been reproduced with permission from ( D. Sun et al., 2019), Copyright from (2019) ACS Analytical Chemistry).
Figure 28.
Figure 28.. Portable SERS-based sensing systems (i) Schematic representation of SERS measurements with portable SERS system (left) and corresponding SERS spectra of Sudan I in paprika extracts (right) (This figure has been reproduced with permission from ( F. Gao et al., 2015), Copyright (2015) Talanta) (ii) (A) Melamine detection in milk on nanofinger substrate chips using the custom-built Raman spectrometer, (B) SERS spectra comparison of 1 ppm melamine in milk using custom-built Raman spectrometer (black) and portable SERS system (red).
(This figure has been reproduced with permission from ( A. Kim et al., 2012), Copyright (2012) Analytical Chemistry).

Similar articles

  • Large-Area Nanogap Platforms for Surface-Enhanced Raman Spectroscopy Toward Sensing Applications: Comparison Between Ag and Au.
    Alagurasu A, Behera S, Yang JM, Kim DS, Namgung S. Alagurasu A, et al. Biosensors (Basel). 2025 Jun 9;15(6):369. doi: 10.3390/bios15060369. Biosensors (Basel). 2025. PMID: 40558451 Free PMC article.
  • Management of urinary stones by experts in stone disease (ESD 2025).
    Papatsoris A, Geavlete B, Radavoi GD, Alameedee M, Almusafer M, Ather MH, Budia A, Cumpanas AA, Kiremi MC, Dellis A, Elhowairis M, Galán-Llopis JA, Geavlete P, Guimerà Garcia J, Isern B, Jinga V, Lopez JM, Mainez JA, Mitsogiannis I, Mora Christian J, Moussa M, Multescu R, Oguz Acar Y, Petkova K, Piñero A, Popov E, Ramos Cebrian M, Rascu S, Siener R, Sountoulides P, Stamatelou K, Syed J, Trinchieri A. Papatsoris A, et al. Arch Ital Urol Androl. 2025 Jun 30;97(2):14085. doi: 10.4081/aiua.2025.14085. Epub 2025 Jun 30. Arch Ital Urol Androl. 2025. PMID: 40583613 Review.
  • Short-Term Memory Impairment.
    Cascella M, Al Khalili Y. Cascella M, et al. 2024 Jun 8. In: StatPearls [Internet]. Treasure Island (FL): StatPearls Publishing; 2025 Jan–. 2024 Jun 8. In: StatPearls [Internet]. Treasure Island (FL): StatPearls Publishing; 2025 Jan–. PMID: 31424720 Free Books & Documents.
  • Sexual Harassment and Prevention Training.
    Cedeno R, Bohlen J. Cedeno R, et al. 2024 Mar 29. In: StatPearls [Internet]. Treasure Island (FL): StatPearls Publishing; 2025 Jan–. 2024 Mar 29. In: StatPearls [Internet]. Treasure Island (FL): StatPearls Publishing; 2025 Jan–. PMID: 36508513 Free Books & Documents.
  • Interventions to reduce harm from continued tobacco use.
    Lindson-Hawley N, Hartmann-Boyce J, Fanshawe TR, Begh R, Farley A, Lancaster T. Lindson-Hawley N, et al. Cochrane Database Syst Rev. 2016 Oct 13;10(10):CD005231. doi: 10.1002/14651858.CD005231.pub3. Cochrane Database Syst Rev. 2016. PMID: 27734465 Free PMC article.

References

    1. Abidin U, Daud NASM, Le Brun V: Replication and leakage test of polydimethylsiloxane (PDMS) microfluidics channel. 2019;020064. 10.1063/1.5086611 - DOI
    1. Acquarelli J, Laarhoven T, Gerretzen J, et al. : Convolutional neural networks for vibrational spectroscopic data analysis. Anal. Chim. Acta. 2017;954:22–31. 10.1016/j.aca.2016.12.010 - DOI - PubMed
    1. Agarwal NR, Lucotti A, Tommasini M, et al. : SERS detection and DFT calculation of 2-naphthalene thiol adsorbed on Ag and Au probes. Sensors Actuators B Chem. 2016;237:545–555. 10.1016/j.snb.2016.06.143 - DOI
    1. Ahmad MM, Abdel-Wahab EA, El-Maaref AA, et al. : Irradiation of silver and agar/silver nanoparticles with argon, oxygen glow discharge plasma, and mercury lamp. SpringerPlus. 2014;3(1):443. 10.1186/2193-1801-3-443 - DOI - PMC - PubMed
    1. Akagi T, Baba M, Akashi M: Preparation of nanoparticles by the self-organization of polymers consisting of hydrophobic and hydrophilic segments: Potential applications. Polymer. 2007;48(23):6729–6747. 10.1016/j.polymer.2007.08.038 - DOI

MeSH terms

LinkOut - more resources