

Development and validation of hierarchical signature for precision individualized therapy based on the landscape associated with necroptosis in clear cell renal cell carcinoma
- PMID: 40255563
- PMCID: PMC12006085
- DOI: 10.3389/fphar.2025.1470145
Development and validation of hierarchical signature for precision individualized therapy based on the landscape associated with necroptosis in clear cell renal cell carcinoma
Abstract
Background: Increasing evidence is showing that necroptosis has unique clinical significance in the occurrence and development of multiple diseases. Here, we systematically evaluate the role of necroptosis in clear cell renal cell carcinoma (ccRCC) and analyze its regulatory patterns.
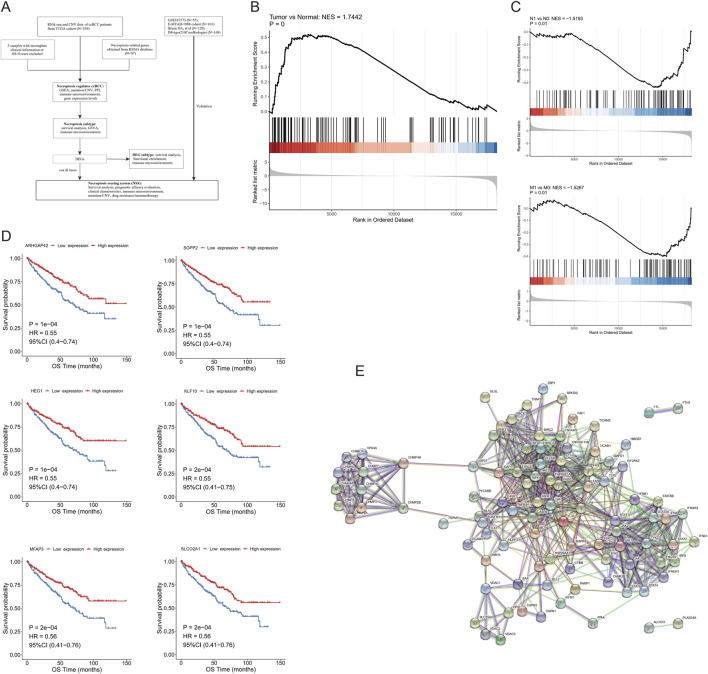
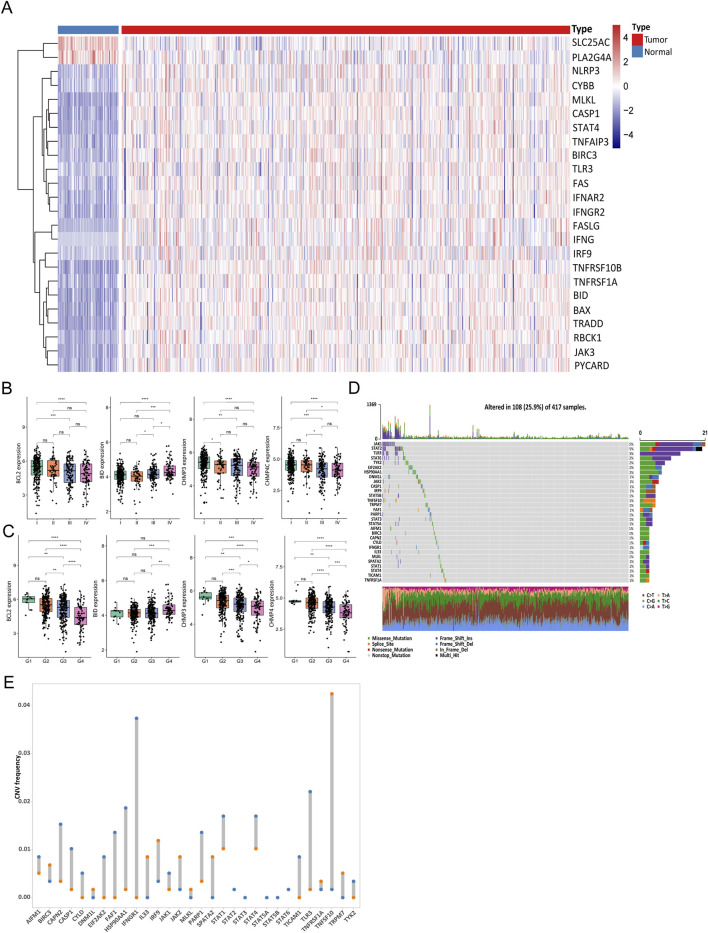
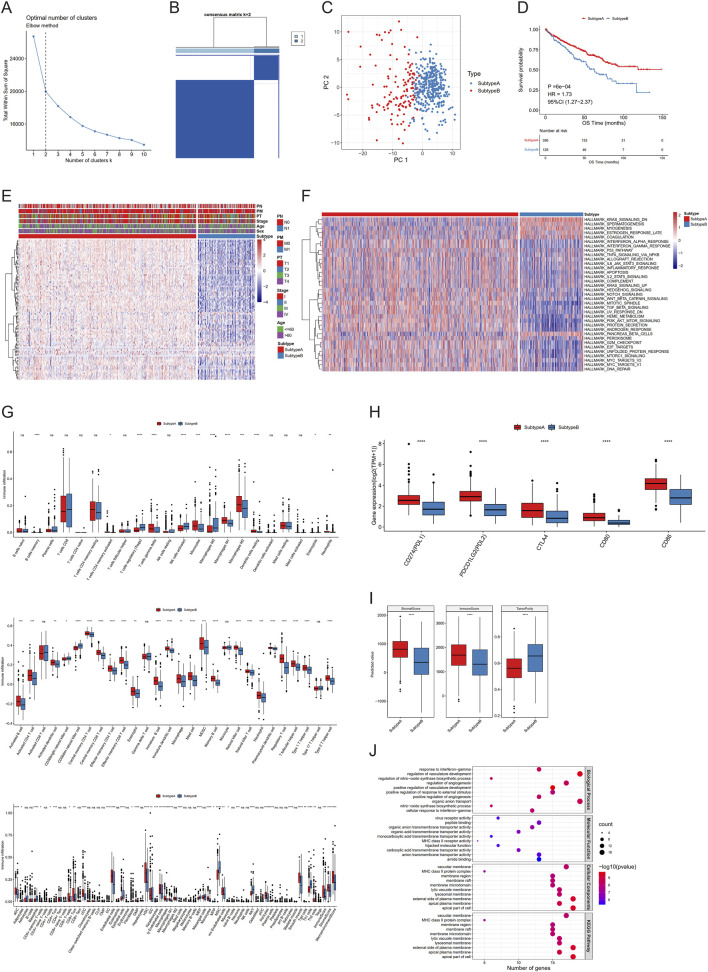
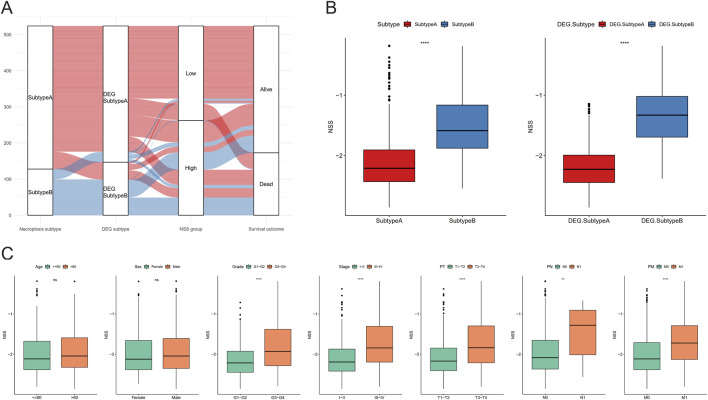
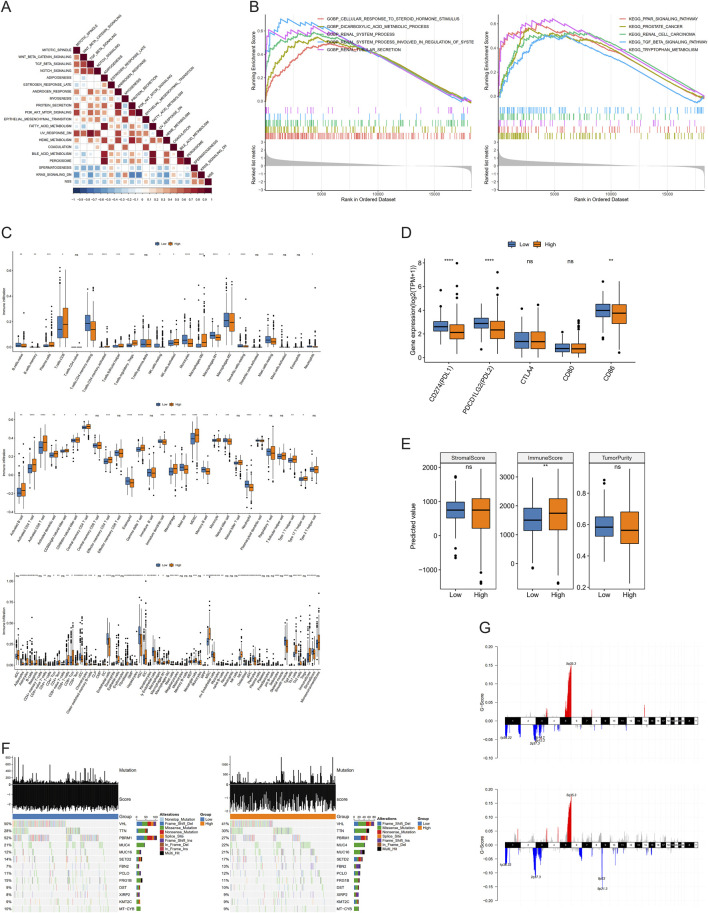
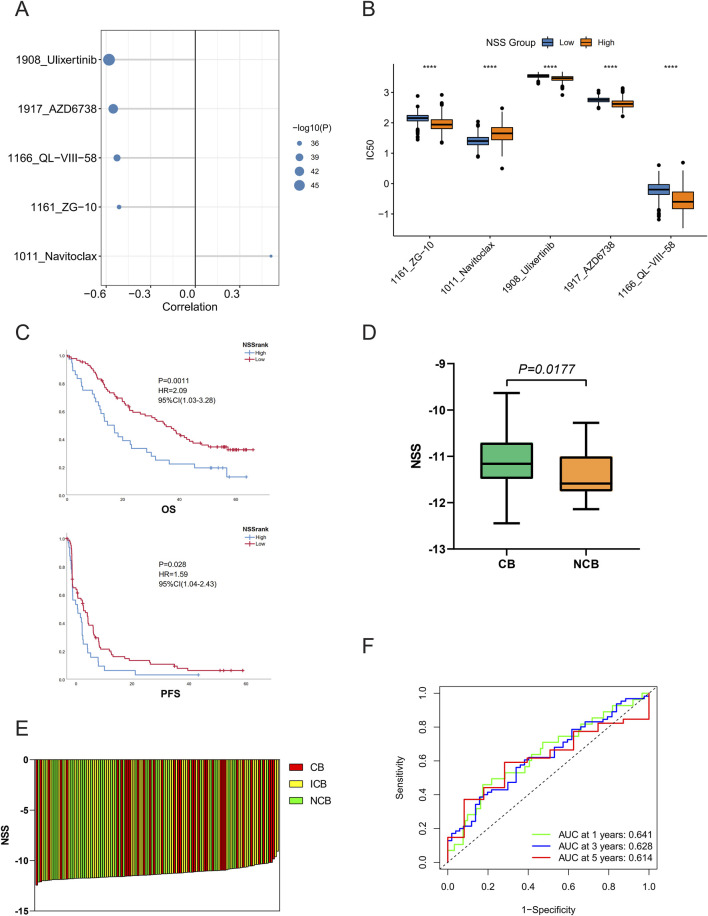
Methods: First, we evaluated the expression and enrichment of necroptotic factors in ccRCC using gene set enrichment analysis (GSEA) and survival analysis in the expression profile from The Cancer Genome Atlas (TCGA) to demonstrate the overall mutation of necroptotic pathway genes. Then, we used unsupervised clustering to divide the samples into two subtypes related to necroptosis with significant differences in overall survival (OS) and subsequently detected the differentially expressed genes (DEGs) between them. Based on this, we constructed the necroptosis scoring system (NSS), which also performed outstandingly in hierarchical data. Finally, we analyzed the association between NSS and clinical parameters, immune infiltration, and the efficacy of immunotherapy containing immune checkpoint inhibitors (ICIs), and we suggested potential therapeutic strategies.
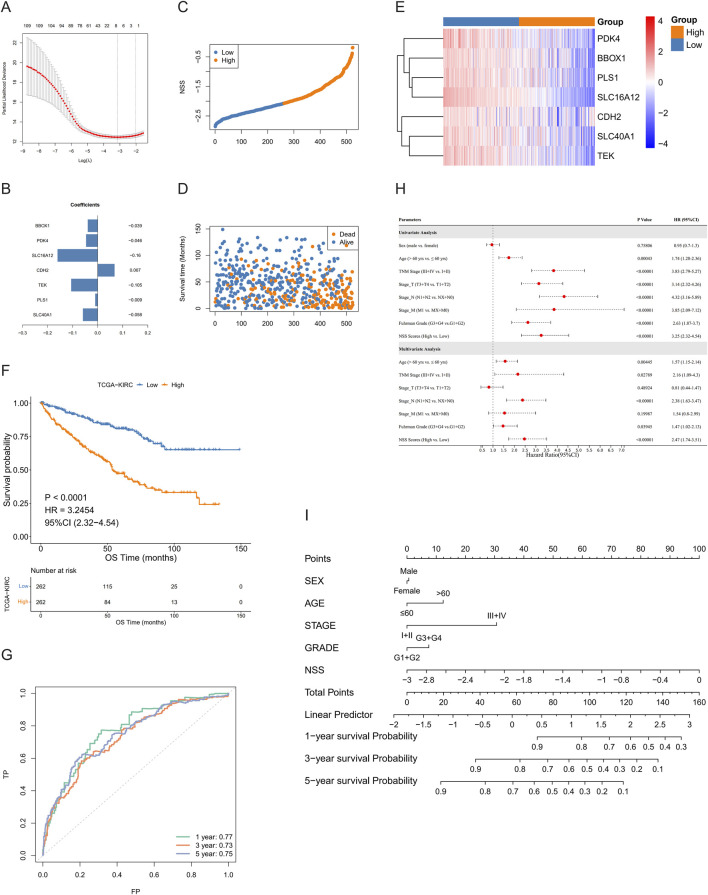
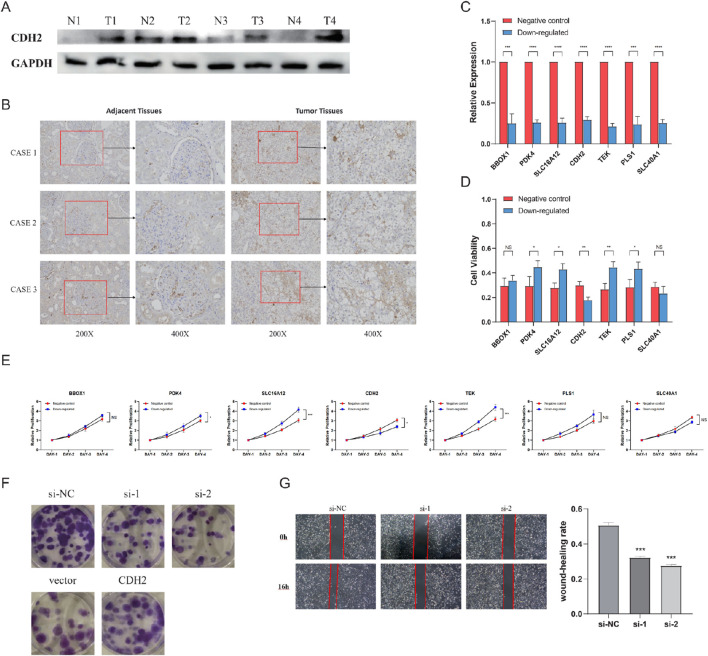
Results: We screened 97 necroptosis-related genes and demonstrated that they were dysregulated in ccRCC. Using Cox analysis and least absolute shrinkage and selection operator (LASSO) regression, a prognostic prediction signature of seven genes was built. Receiver operating characteristic (ROC) curves and Kaplan-Meier (KM) analyses both showed that the model was accurate, and univariate/multivariate Cox analysis showed that as an independent prognostic factor, the higher the risk score, the poorer the survival outcome. Furthermore, the predicted scores based on the signature were observably associated with immune cell infiltration and the mutation of specific genes. In addition, the risk score could potentially predict patients' responsiveness to different chemotherapy regimens. Specifically, Nivolumab is more effective for patients with higher scores.
Conclusion: The necroptosis-related signature we constructed can accurately predict the prognosis of ccRCC patients and further provide clues for targeted, individualized therapy.
Keywords: clear cell renal cell carcinoma; necroptosis; necroptosis scoring system; precise treatment; survival analysis.
Copyright © 2025 Yao, Dai, Fu, Lin, Tan, Dai, Chen, Luo and Wei.
Conflict of interest statement
The authors declare that the research was conducted in the absence of any commercial or financial relationships that could be construed as a potential conflict of interest.
Figures
Similar articles
-
Construction and Validation of an Autophagy-Related Prognostic Risk Signature for Survival Predicting in Clear Cell Renal Cell Carcinoma Patients.Front Oncol. 2020 May 5;10:707. doi: 10.3389/fonc.2020.00707. eCollection 2020. Front Oncol. 2020. PMID: 32432045 Free PMC article.
-
A novel necroptosis-related long noncoding RNA model for predicting clinical features, immune characteristics, and therapeutic response in clear cell renal cell carcinoma.Front Immunol. 2023 Aug 2;14:1230267. doi: 10.3389/fimmu.2023.1230267. eCollection 2023. Front Immunol. 2023. PMID: 37600792 Free PMC article.
-
Comprehensive analysis of necroptosis-related lncRNA signature with potential implications in tumor heterogeneity and prediction of prognosis in clear cell renal cell carcinoma.Eur J Med Res. 2023 Jul 14;28(1):236. doi: 10.1186/s40001-023-01194-4. Eur J Med Res. 2023. PMID: 37452355 Free PMC article.
-
Identification of cuproptosis-related subtypes, construction of a prognosis model, and tumor microenvironment landscape in gastric cancer.Front Immunol. 2022 Nov 21;13:1056932. doi: 10.3389/fimmu.2022.1056932. eCollection 2022. Front Immunol. 2022. PMID: 36479114 Free PMC article.
-
A new CCCH-type zinc finger-related lncRNA signature predicts the prognosis of clear cell renal cell carcinoma patients.Front Genet. 2022 Sep 30;13:1034567. doi: 10.3389/fgene.2022.1034567. eCollection 2022. Front Genet. 2022. PMID: 36246657 Free PMC article.
References
-
- Afonso M. B., Rodrigues P. M., Mateus-Pinheiro M., Simao A. L., Gaspar M. M., Majdi A., et al. (2021). RIPK3 acts as a lipid metabolism regulator contributing to inflammation and carcinogenesis in non-alcoholic fatty liver disease. Gut 70 (12), 2359–2372. 10.1136/gutjnl-2020-321767 - DOI - PMC - PubMed
LinkOut - more resources
Full Text Sources