. 2025 Mar 28:12:100295.
doi: 10.1016/j.jmccpl.2025.100295. eCollection 2025 Jun.

Matured hiPSC-derived cardiomyocytes possess dematuration plasticity

Affiliations

Matured hiPSC-derived cardiomyocytes possess dematuration plasticity

Fang Meng et al. J Mol Cell Cardiol Plus. .

Abstract

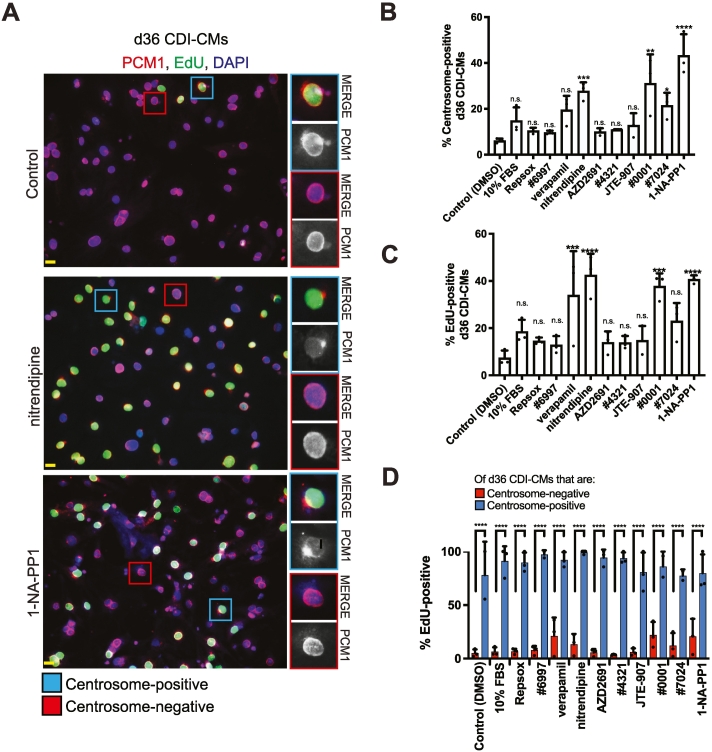
Human induced Pluripotent Stem Cell-derived cardiomyocytes (hiPSC-CMs) are increasingly used to identify potential factors capable of inducing endogenous cardiomyocyte proliferation to regenerate the injured heart. L-type calcium channel blockers have previously been identified as a class of factors capable of inducing matured hiPSC-CMs to proliferate. However, the mechanism by which L-type calcium channel blockers promote hiPSC-CM proliferation remains unclear. Here we provide evidence that matured hiPSC-CMs possess plasticity to undergo dematuration in response to certain pharmacological compounds. Consistent with primary cardiomyocyte maturation during perinatal development, we found that centrosome disassembly occurs in hiPSC-CMs during plate-based, temporal, maturation. A small molecule screen identified nitrendipine, an L-type calcium channel blocker, and 1-NA-PP1, a Src kinase inhibitor, as factors capable of inducing centrosome reassembly in a subpopulation of hiPSC-CMs. Furthermore, centrosome-positive hiPSC-CMs were more likely to exhibit cell cycle activity than centrosome-negative hiPSC-CMs. In contrast, neither nitrendipine or 1-NA-PP1 induced centrosome reassembly, or cell cycle activity, in neonatal rat ventricular myocytes (NRVMs). Differential bulk transcriptome analysis indicated that matured hiPSC-CMs, but not NRVMs, treated with nitrendipine or 1-NA-PP1 undergo dematuration. ScRNA transcriptome analysis supported that matured hiPSC-CMs treated with either nitrendipine or 1-NA-PP1 undergo dematuration. Collectively, our results indicate that matured hiPSC-CMs, but not primary NRVMs, possess plasticity to undergo dematuration in response to certain pharmacological compounds such as L-type calcium channel blockers and Src-kinase inhibitors. This study shows that once mature, hiPSC-CMs may not maintain their maturity under experimental conditions which may have implications for experimental systems where the state of hiPSC-CM maturation is relevant.

Keywords: Cardiomyocyte; Centrosome; Differentiation; Drug discovery; Maturation; Proliferation; Regeneration; Stem cell; hiPSC.


Conflict of interest statement

D.S., A.W., H. A., and Q.D.W. are employees of AstraZeneca. D.C.Z. was employed by AstraZeneca while conducting a portion of the work for this manuscript. D.C.Z. is no longer affiliated with AstraZeneca. D.C.Z. is an employee of GenKardia. A.H. was employed by AstraZeneca while conducting a portion of the work for this manuscript. A.H. is no longer affiliated with AstraZeneca.

Figures

Unlabelled Image
Graphical abstract
Fig. 1
Fig. 1
Centrosome integrity reflects the state of maturation in hiPSC-CMs (A) Schematic for centrosome disassembly in cardiomyocytes during perinatal development. (B) Representative images of d15 and d30 AICS-CMs. (C) Quantitation of centrosome-positive AICS-CMs. (D) Images of d36 CDI-CMs. (E) Quantitation of centrosome-positive CDI-CMs. (F) Images of d15 and d30 AICS-CMs. Ki67-positive nuclei indicate AICS-CMs in the cell cycle. Yellow asterisk denotes centrosome-positive hiPSC-CMs. (G) Quantitation of AICS-CMs in the cell cycle. (H) Quantitation of d30 centrosome-positive and centrosome-negative AICS-CMs that are in the cell cycle. (I) Images of d36 CDI-CMs in the cell cycle. Yellow asterisk denotes centrosome-positive hiPSC-CMs. (J) Quantitation of d36 CDI-CMs in the cell cycle. (K) Quantitation of centrosome-positive and centrosome-negative d36 CDI-CMs that are in the cell cycle. Yellow asterisk denotes centrosome-positive hiPSC-CMs. Yellow scale bars = 10 μm. Data are presented as +/− SEM. *P < 0.05, **P < 0.005, ***P < 0.0005, ns = not significant. Statistics were determined using a 2-tailed, unpaired Student's t-test. AICS-CM results are from 3 independent experiments from 3 independent differentiations, > 100 cardiomyocytes from 3 different 20× fields were scored per experiment. CDI-CM results are from 3 independent experiments from 3 different lot numbers, > 100 cardiomyocytes from 3 different 20× fields were scored per experiment. (For interpretation of the references to colour in this figure legend, the reader is referred to the web version of this article.)
Fig. 1
Fig. 1
Centrosome integrity reflects the state of maturation in hiPSC-CMs (A) Schematic for centrosome disassembly in cardiomyocytes during perinatal development. (B) Representative images of d15 and d30 AICS-CMs. (C) Quantitation of centrosome-positive AICS-CMs. (D) Images of d36 CDI-CMs. (E) Quantitation of centrosome-positive CDI-CMs. (F) Images of d15 and d30 AICS-CMs. Ki67-positive nuclei indicate AICS-CMs in the cell cycle. Yellow asterisk denotes centrosome-positive hiPSC-CMs. (G) Quantitation of AICS-CMs in the cell cycle. (H) Quantitation of d30 centrosome-positive and centrosome-negative AICS-CMs that are in the cell cycle. (I) Images of d36 CDI-CMs in the cell cycle. Yellow asterisk denotes centrosome-positive hiPSC-CMs. (J) Quantitation of d36 CDI-CMs in the cell cycle. (K) Quantitation of centrosome-positive and centrosome-negative d36 CDI-CMs that are in the cell cycle. Yellow asterisk denotes centrosome-positive hiPSC-CMs. Yellow scale bars = 10 μm. Data are presented as +/− SEM. *P < 0.05, **P < 0.005, ***P < 0.0005, ns = not significant. Statistics were determined using a 2-tailed, unpaired Student's t-test. AICS-CM results are from 3 independent experiments from 3 independent differentiations, > 100 cardiomyocytes from 3 different 20× fields were scored per experiment. CDI-CM results are from 3 independent experiments from 3 different lot numbers, > 100 cardiomyocytes from 3 different 20× fields were scored per experiment. (For interpretation of the references to colour in this figure legend, the reader is referred to the web version of this article.)
Fig. 2
Fig. 2
Small molecule screen for hiPSC-CM dematuration factors (A) Representative images of centrosome-positive and centrosome-negative d36 CDI-CMs in EdU-incorporation cell cycle activity assay. Yellow and Red boxes provide examples of centrosome-positive and centrosome-negative CDI-CMs, respectively. (B) Quantitation of centrosome-positive d36 CDI-CMs based on PCM1 location. (C) Quantitation of d36 CDI-CMs in the cell cycle based on EdU incorporation. (D) Quantitation of centrosome-positive and centrosome-negative d36 CDI-CMs that are in the cell cycle. (E) Representative images of centrosome-positive and centrosome-negative d36 CDI-CMs cultures in presence of araC. Yellow asterisks indicate centrosome-positive CDI-CMs. (F) Representative images of centrosome-positive and centrosome-negative d36 CDI-CMs cultures in presence of abemaciclib. Yellow asterisks indicate centrosome-positive CDI-CMs. (G) Quantitation of centrosome-positive d36 CDI-CMs in presence of cell cycle inhibitors compared to Control. Yellow scale bars = 10 μm. Data are presented as +/− SEM. *P < 0.05, **P < 0.005, ***P < 0.0005, ****P < 0.00005, ns = not significant. Statistics were determined using 1-way ANOVA followed by Dunnett's test in (B) and (C) and a 2-tailed, unpaired Student's t-test in (D) and (G). CDI-CM results are from 3 independent experiments from 3 different lot numbers, > 100 cardiomyocytes from 3 different 20× fields were scored per experiment. (For interpretation of the references to colour in this figure legend, the reader is referred to the web version of this article.)
Fig. 2
Fig. 2
Small molecule screen for hiPSC-CM dematuration factors (A) Representative images of centrosome-positive and centrosome-negative d36 CDI-CMs in EdU-incorporation cell cycle activity assay. Yellow and Red boxes provide examples of centrosome-positive and centrosome-negative CDI-CMs, respectively. (B) Quantitation of centrosome-positive d36 CDI-CMs based on PCM1 location. (C) Quantitation of d36 CDI-CMs in the cell cycle based on EdU incorporation. (D) Quantitation of centrosome-positive and centrosome-negative d36 CDI-CMs that are in the cell cycle. (E) Representative images of centrosome-positive and centrosome-negative d36 CDI-CMs cultures in presence of araC. Yellow asterisks indicate centrosome-positive CDI-CMs. (F) Representative images of centrosome-positive and centrosome-negative d36 CDI-CMs cultures in presence of abemaciclib. Yellow asterisks indicate centrosome-positive CDI-CMs. (G) Quantitation of centrosome-positive d36 CDI-CMs in presence of cell cycle inhibitors compared to Control. Yellow scale bars = 10 μm. Data are presented as +/− SEM. *P < 0.05, **P < 0.005, ***P < 0.0005, ****P < 0.00005, ns = not significant. Statistics were determined using 1-way ANOVA followed by Dunnett's test in (B) and (C) and a 2-tailed, unpaired Student's t-test in (D) and (G). CDI-CM results are from 3 independent experiments from 3 different lot numbers, > 100 cardiomyocytes from 3 different 20× fields were scored per experiment. (For interpretation of the references to colour in this figure legend, the reader is referred to the web version of this article.)
Fig. 3
Fig. 3
Bulk Transcriptome analysis of hiPSC-CMs and NRVMs (A) Schematic illustrating strategy for differential analysis between hiPSC-CM and P6 NRVM transcriptomes. Shared and Unique refers to genes shared between nitrendipine and 1-NA-PP1 stimulation, and genes unique to hiPSC-CMs (i.e. not expressed in NRVMs). (B) Enriched GO Biological Processes (by Fisher's exact test P-value) among common up- and downregulated genes, respectively, specific to hiPSC-CMs treated with either nitrendipine or 1-NA-PP1. (C) Enriched transcription factors (by Fold Enrichment and Enrichment False Discovery Rate) based on co-expression data from the ARCHS4 database (https://maayanlab.cloud/archs4/), among common up- and downregulated genes, respectively, specific to hiPSC-CMs treated with either nitrendipine or 1-NA-PP1.
Fig. 4
Fig. 4
Single Cell RNA sequencing of iPSC-CMs confirms iPSC-CM dematuration. (A) Left: Highly variable gene based low-dimensional UMAP embedding of single cells colored by treatment before filtering. Cells annotated as cardiomyocytes are marked by a dotted circle. Right: scaled log expression of the sarcomere related cardiomyocyte TNNT2 and TNNC1 genes. (B) Highly variable gene based UMAP representation after filtering for hiPSC-CMs based on TNNT2 and TNNC1 expression. (C) Gene Ontology analysis based on top100 differentially induced genes in each cluster for Louvain based clustering of cardiomyocytes. Colors represent different Louvain clusters. qscore represents the -log10 value of adjusted p-value for the term. (D) Scaled Log expression of cardiomyocyte maturation associated genes. (E) Dot plots of gene expression for cardiomyocyte maturation markers in control, 1-NA-PP1, and nitrendipine treated hiPSC-CMs. Dot size indicates percentage of cells expression a given gene, and the colour indicates the average log scaled expression level in the cells. Mean expression is visualized using the viridis gradient, transitioning from dark purple indicating low expression towards bright yellow indicating high expression. (For interpretation of the references to colour in this figure legend, the reader is referred to the web version of this article.)

References

    1. Hnatiuk A.P., Briganti F., Staudt D.W., Mercola M. Human iPSC modeling of heart disease for drug development. Cell Chem Biol. 2021;28(3):271–282. - PMC - PubMed
    1. Wang P.H., Fang Y.H., Liu Y.W., Yeh M.L. Merits of hiPSC-derived cardiomyocytes for in vitro research and testing drug toxicity. Biomedicines. 2022;10(11) - PMC - PubMed
    1. Khan J.M., Lyon A.R., Harding S.E. The case for induced pluripotent stem cell-derived cardiomyocytes in pharmacological screening. Br J Pharmacol. 2013;169(2):304–317. - PMC - PubMed
    1. Kadota S., Tanaka Y., Shiba Y. Heart regeneration using pluripotent stem cells. J Cardiol. 2020;76(5):459–463. - PubMed
    1. Sullivan M.F., Ruemmler P.S., Buschbom R.L. Influence of iron on plutonium absorption by the adult and neonatal rat. Toxicol Appl Pharmacol. 1986;85(2):239–247. - PubMed

LinkOut - more resources