Isolation and Analysis of Matched Osteoarthritic Cartilage Progenitor Cells and Bone Marrow Mesenchymal Stem Cells
- PMID: 40255792
- PMCID: PMC12007902
- DOI: 10.7759/cureus.80844
Isolation and Analysis of Matched Osteoarthritic Cartilage Progenitor Cells and Bone Marrow Mesenchymal Stem Cells
Abstract
Introduction: Osteoarthritis (OA) is a chronic degenerative disorder that impacts synovial joints, leading to the degradation of articular cartilage and alterations in bone structure. As the most prevalent type of polyarthritis, its occurrence is increasing, particularly in Western countries. Current treatment options for OA involve various pharmacological therapies and prosthetic devices, which come with numerous limitations. Consequently, there is a growing interest among both patients and health care professionals in biological therapies, particularly the use of stem and progenitor cells for cartilage regeneration.
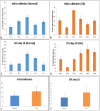
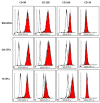
Methods: We extract articular cartilage progenitor cells (CPCs) and bone marrow mesenchymal stem cells (MSCs) from the femoral side of the knee joint of OA patients undergoing total knee arthroplasty. To isolate CPCs, digested full-depth chondrocytes from the femoral condyle undergo a fibronectin adhesion assay, while we separate bone marrow MSCs using the Ficoll™ density gradient centrifugation method. We expand both cell types in culture and measure their growth kinetics over 80 days. Additionally, we evaluate proliferation potential and senescence through bromodeoxyuridine incorporation and the senescence-associated β-galactosidase assay, respectively. Further, we analyze the expression of specific MSC markers in articular CPCs and bone marrow MSCs using flow cytometry. Results: We successfully isolated CPCs and bone marrow MSCs from matched osteoarthritic donors. The isolated CPCs and MSCs exhibit similar morphology and proliferation ability. Moreover, both cell types show positive expression for MSC markers CD-90, CD-105, and CD-166, while expressing low or no levels of CD-34 (a marker for hematopoietic stem cells) and exhibiting tri-lineage differentiation potential. Conclusion: We successfully isolate CPCs and bone marrow MSCs from the knee joints of osteoarthritic donors. Our findings indicate that both cell types demonstrate comparable morphology and growth kinetics, concurrently marking for classical MSC markers and exhibiting differentiation potential. These results are promising for the field of regenerative medicine. In this study, we outline the isolation of a rare group of matching mesenchymal stem/progenitor cells collected from the articular cartilage and bone marrow of patients undergoing total knee arthroplasty. This discovery lays the groundwork for comparative analyses, in that these cell types are primary candidates for cartilage-based regenerative therapies.
Keywords: articular cartilage; chondroprogenitor cells; osteoarthritis; regenerative medicine; stem cells.
Copyright © 2025, Esa et al.
Conflict of interest statement
Human subjects: Consent for treatment and open access publication was obtained or waived by all participants in this study. South East Wales Research Ethics Committee issued approval 09/WSE04/35. Animal subjects: All authors have confirmed that this study did not involve animal subjects or tissue. Conflicts of interest: In compliance with the ICMJE uniform disclosure form, all authors declare the following: Payment/services info: All authors have declared that no financial support was received from any organization for the submitted work. Financial relationships: All authors have declared that they have no financial relationships at present or within the previous three years with any organizations that might have an interest in the submitted work. Other relationships: All authors have declared that there are no other relationships or activities that could appear to have influenced the submitted work.
Figures


Similar articles
-
Senescent chondrogenic progenitor cells derived from articular cartilage of knee osteoarthritis patients contributes to senescence-associated secretory phenotype via release of IL-6 and IL-8.Acta Histochem. 2022 Apr;124(3):151867. doi: 10.1016/j.acthis.2022.151867. Epub 2022 Feb 19. Acta Histochem. 2022. PMID: 35192993
-
Comparative analysis of human bone marrow mesenchymal stem cells, articular cartilage derived chondroprogenitors and chondrocytes to determine cell superiority for cartilage regeneration.Acta Histochem. 2021 May;123(4):151713. doi: 10.1016/j.acthis.2021.151713. Epub 2021 Apr 21. Acta Histochem. 2021. PMID: 33894479
-
Harnessing knee joint resident mesenchymal stem cells in cartilage tissue engineering.Acta Biomater. 2023 Sep 15;168:372-387. doi: 10.1016/j.actbio.2023.07.024. Epub 2023 Jul 21. Acta Biomater. 2023. PMID: 37481194 Review.
-
Chondrogenic Progenitor Cells Exhibit Superiority Over Mesenchymal Stem Cells and Chondrocytes in Platelet-Rich Plasma Scaffold-Based Cartilage Regeneration.Am J Sports Med. 2019 Jul;47(9):2200-2215. doi: 10.1177/0363546519854219. Epub 2019 Jun 13. Am J Sports Med. 2019. PMID: 31194571
-
[Effects of cartilage progenitor cells and microRNA-140 on repair of osteoarthritic cartilage injury].Zhongguo Xiu Fu Chong Jian Wai Ke Za Zhi. 2019 May 15;33(5):650-658. doi: 10.7507/1002-1892.201806060. Zhongguo Xiu Fu Chong Jian Wai Ke Za Zhi. 2019. PMID: 31090363 Free PMC article. Review. Chinese.
References
-
- Esa A. PhD Thesis, Cardiff University. Cardiff University; 2015. Characterising the Role of Articular Cartilage Progenitor Cells in Osteoarthritis.
-
- Wnt signaling and osteoarthritis. Luyten FP, Tylzanowski P, Lories RJ. Bone. 2009;44:522–527. - PubMed
-
- Stem cells and cartilage development: complexities of a simple tissue. Hollander AP, Dickinson SC, Kafienah W. http://10.1002/stem.534. Stem Cells. 2010;28:1992–1996. - PMC - PubMed
-
- Osteoarthritis: National Clinical Guideline for care and management in adults. Royal College of Physicians. [ Jan; 2025 ]. 2008. https://pubmed.ncbi.nlm.nih.gov/21290638/ https://pubmed.ncbi.nlm.nih.gov/21290638/ - PubMed
-
- National Clinical Guideline Centre (UK) Arthritis. Arthritis and Musculoskeletal Alliance. London, UK: National Institute for Health and Care Excellence; 2014. Osteoarthritis: Care and Management in Adults. - PubMed
LinkOut - more resources
Full Text Sources
Research Materials
