Review
. 2025 Mar 24;7(10):2818-2886.
doi: 10.1039/d5na00195a. eCollection 2025 May 13.

Biotransformation and biological fate of magnetic iron oxide nanoparticles for biomedical research and clinical applications

Affiliations
Review

Biotransformation and biological fate of magnetic iron oxide nanoparticles for biomedical research and clinical applications

Carlos Jacinto et al. Nanoscale Adv. .

Abstract

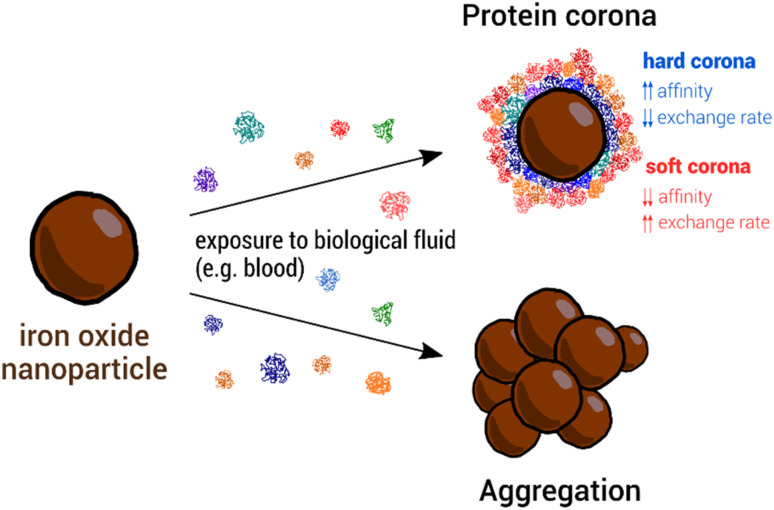
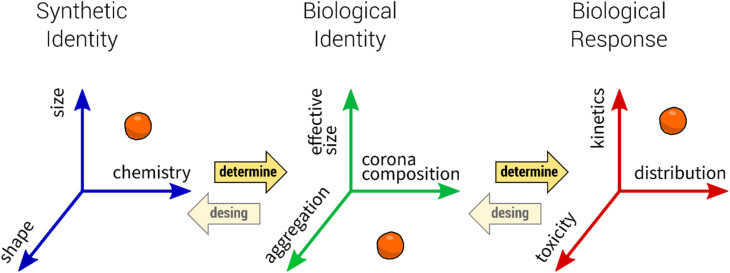
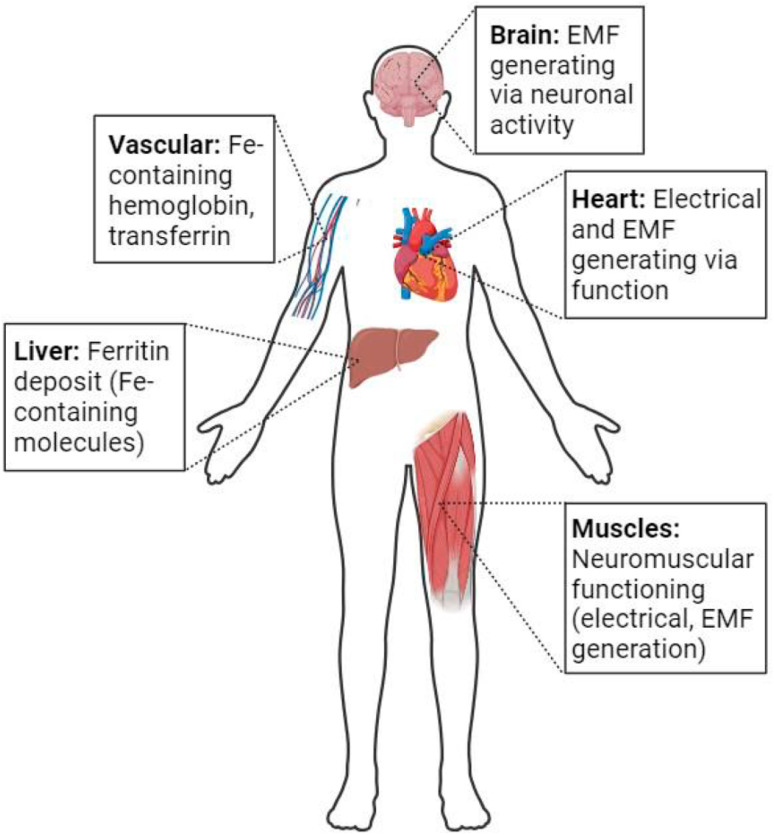
Safe implementation of nanotechnology-based products in biomedical applications necessitates an extensive understanding of the (bio)transformations that nanoparticles undergo in living organisms. The long-term fate in the body is a crucial consideration because it governs potential risks for human health. To accurately predict the life cycle of nanoparticles, their fate after administration into the body-including their (bio)transformations, persistence, and biodegradation-needs to be thoroughly evaluated. Magnetic iron oxide nanoparticles (MIONPs) can enter the body through various routes, including inhalation, ingestion, dermal absorption, and injection. Microscale and nanoscale studies are performed to observe nanomaterial biotransformations and their effect on clinically relevant properties. Researchers are utilizing high-resolution TEM for nanoscale monitoring of the nanoparticles while microscale follow-up approaches comprise quantification tools at the whole organism level and the molecular level. Nanoparticle-cell interactions, including cellular uptake and intracellular trafficking, are key to understanding nanoparticle accumulation in cells and organs. Prolonged accumulation may induce cell stress and nanoparticle toxicity, often mediated through oxidative stress and inflammation. In this review article, the journey of nanoparticles in the body is depicted and their biotransformations and final fate are discussed. Immunohistochemical techniques are particularly valuable in tracking nanoparticle distribution within tissues and assessing their impact at the cellular level. A thorough description of a wide range of characterization techniques is provided to unveil the fate and biotransformations of clinically relevant nanoparticles and to assist in their design for successful biomedical applications.


Conflict of interest statement

There are no conflicts to declare.

Figures

Fig. 1
Fig. 1. (a) TEM images of typical iron oxide nanomaterials: polydisperse NPs prepared by co-precipitation routes (left), multicore NPs (center), and monodisperse nanocubes prepared by thermal decomposition (right), (b) chemical transformations of magnetite NPs in the presence of oxygen at different temperatures and main properties of the associated iron oxides. Reproduced from ref. under a Creative Commons (CC BY 3.0) License; reproduced from ref. under a Creative Commons (CC BY 4.0) License; reproduced from ref. with permission from American Chemical Society, copyright 2019.
Fig. 2
Fig. 2. The mechanism of reactive oxygen species (ROS) production by MIONPs. The process begins with the NP, which contains metal atoms at its core. These metal atoms have a nucleus surrounded by discrete energy levels. When the NP absorbs energy in the form of photons (), electrons in the metal atoms can be excited from the valence band to the conduction band, leaving an energy gap between these two bands. This electron excitation creates a situation where the conduction band has an excess electron. In contrast, the valence band has a positive charge due to the missing electron (referred to as a hole). The positively charged hole in the valence band can interact with water molecules (H2O), forming hydroxyl radicals (OH˙). Meanwhile, the electron in the conduction band can react with oxygen molecules (O2) to form superoxide anions (O2˙). These ROS, such as hydroxyl radicals and superoxide anions, are highly reactive and can cause oxidative damage to biological systems. The generation of ROS by MIONPs is a crucial aspect of their behavior and can have significant biological implications, depending on the context of their use or exposure. Reproduced from ref. under a Creative Commons (CC BY) Licence from the Beilstein Institute for the Advancement of Chemical Sciences, Copyright [2020] CC-BY adapted from Correa et al. © 2020 CC-BY.
Fig. 3
Fig. 3. Regulation of BAX/BAK activation and oligomerization by BCL-2 family proteins. (a) The mitochondrial pathway of apoptosis, a critical cellular process that balances survival and programmed cell death. At the center of this pathway are BCL-2 family proteins, which are divided into three main groups: pro-apoptotic, anti-apoptotic, and BH3-only proteins. BH3-only proteins serve as upstream sensors of cellular stress and damage, which can activate either pro-apoptotic or anti-apoptotic proteins depending on the signals received. Pro-apoptotic proteins promote mitochondrial outer membrane permeabilization (MOMP) by oligomerizing and forming pores in the mitochondrial membrane. This results in the release of cytochrome c into the cytosol, a pivotal step in the apoptotic cascade. Cytochrome c interacts with apoptotic protease-activating factor-1 (Apaf-1) to form the apoptosome, leading to the activation of caspases—proteolytic enzymes that dismantle the cell in a controlled manner. In contrast, anti-apoptotic proteins counteract this process by inhibiting the activity of pro-apoptotic proteins, thereby maintaining mitochondrial integrity and promoting cell survival. The balance between these opposing forces determines whether the cell undergoes apoptosis or survives. (b) Mitochondrial dynamics and their regulation in apoptosis and metabolism. The outer (OMM) and inner (IMM) membranes are key sites for fission, fusion, and permeability transitions. Fission, mediated by DRP1, is balanced by fusion-promoting proteins MFN1/2 and OPA1, maintaining mitochondrial morphology and function. Anti-apoptotic BCL-XL stabilizes membranes, while pro-apoptotic BAX and BAK promote permeabilization. The mitochondrial permeability transition pore (MPTP), involving VDAC, ANT, and ATP synthase, responds to stress and can trigger cell death if dysregulated. TOM40 and TOM50 import proteins critical for the electron transport chain (ETC) and ATP synthesis. BID and cleaved MCL-1 regulate apoptosis and remodeling, while OPA1 optimizes cristae structure for ETC function. The balance of fission, fusion, and permeabilization is essential for energy, survival, and cell death. (c) Unfolded protein response (UPR) and its link to apoptosis and cellular regulation, focusing on key pathways activated during endoplasmic reticulum (ER) stress. The UPR is mediated by three ER membrane sensors: ATF6, PERK, and IRE1α, each contributing to stress adaptation or apoptosis depending on the severity of stress. PERK phosphorylates eIF2α, reducing global protein synthesis while allowing selective translation of ATF4. ATF4 upregulates pro-apoptotic factors like CHOP, PUMA, and BIM while suppressing anti-apoptotic BCL-2, promoting apoptosis under prolonged stress. IRE1α, through its RNase activity, splices XBP1 mRNA to produce XBP1s, aiding in adaptive responses. However, if stress persists, IRE1α interacts with TRAF and ASK1 to activate JNK, leading to phosphorylation of BCL-2 and BCL-XL, shifting the balance toward apoptosis. IP3R, involved in calcium signaling, can further amplify stress by facilitating mitochondrial calcium uptake, contributing to apoptotic processes mediated by BAX, BAK, and BH3-only proteins like PUMA, BIM, and BID. Reproduced from ref. with permission from Springer Nature, Copyright 2017.
Fig. 4
Fig. 4. The in vitro cytotoxicity of various MIONPs coated with either SEI or PEG from the study of Feng et al. The cell viability of RAW264.7 macrophages (A) and SKOV-3 cells (B) was evaluated using the MTS assay after 48 h of treatment with different concentrations of MIONPs. (C) Representative fluorescent microscopic images illustrate the mode of cell death induced by different MIONPs in SKOV-3 cells. The cells were treated with SEI-10 (17 nm, 5 μg mL−1), SMG-10 (17 nm, 400 μg mL−1), or SMG-30 (36 nm, 400 μg mL−1) for 16 h, followed by staining with Hoechst 33342 (blue) and PI (red). Abbreviations SEI-10, SMG-10, and SMG-30 are based on their uncoated particle sizes. Reproduced from ref. under a Creative Commons (CC-BY) Licence from Springer Nature, Copyright 2020.
Fig. 5
Fig. 5. NP outcomes in biological fluids: upon contact with biological fluids containing proteins (e.g., blood) NPs adsorbs proteins (represented as compact colored coils in the figure) from the media. The formed protein corona presents two different regions, one constituted by proteins with high affinity for the surface and low exchange rate with the medium, called hard corona, and another comprising protein with low affinity and high exchange rate, named soft corona. In parallel, NPs can aggregate in biological fluids. This can be a consequence of the high ionic strength exhibited by the latter and/or triggered by the adsorption of proteins. For the specific case of MIONPs, they also can aggregate owing to magnetic interactions.
Fig. 6
Fig. 6. Scheme showing the relation between the synthetic identity of a NP (as prepared in the lab), its biological identity (when in contact with biological fluid) and the biological response that triggers (in the biological organism). For more details, see the text above. Reproduced from ref. with permission from the Royal Society of Chemistry (RSC), Copyright 2012.
Fig. 7
Fig. 7. Structures of commonly used ligands of MIONPs for enhanced cellular uptake. (A) Zwitterionic and (B) polymeric ligands. Polyvinyl alcohol (PVA) is a neutral, hydrophilic polymer with no inherent charge at physiological pH, making it non-ionic. Conversely, polyacrylic acid (PAA) may carry a negative charge when carboxyl groups are ionized under physiological conditions. Polylactic-co-glycolic acid (PLGA) is generally neutral, with a slightly hydrophobic character due to its ester linkages, but it may not carry a significant charge. In contrast, poly-l-lysine (PLL) may be positively charged, as its amine groups are protonated at physiological pH, resulting in a cationic character that strongly influences its interaction with negatively charged biological molecules.
Fig. 8
Fig. 8. Human organs and organ systems where magnetic particles and electrical and electromagnetic fields (EMF) are naturally found. Reproduced from ref. with under a Creative Commons (CC BY 3.0) License from MDPI, Basel Switzerland, 2024.
Fig. 9
Fig. 9. Biodistribution of intravenously administered MIONPs in male Wistar rats. Bioaccumulation patterns of MIONPs in different organs of Wistar rat (A–H): spleen (A), blood (B), liver (C), kidney (D), lungs (E), heart (F), brain (G), and testis (H) treated with varying doses of MIONPs. All the organs studied showed dose-dependent accumulation of MIONPs that was statistically significant (p < 0.05), except for the brain and testis, where substantial distribution was only seen in the high-dose (30 mg kg−1) group. The following letters indicate significant inter-group differences (p < 0.05): a (against control), b (vs. 7.5 mg kg−1 MIONPs), and c (vs. 15 mg kg−1 MIONPs). Organ coefficients—organ weight (g) divided by the animal body weight (g)—of Wistar rats given varying IONP injection dosages in comparison to the control group (I). The groups that received NP injections and the control group did not differ significantly (p < 0.05). Results are presented as mean ± standard deviation (n = 6) with standard deviation error bars. Tukey's test was used to do multiple comparisons and one-way analysis of variance to establish statistical significance. Reproduced from ref. with under a Creative Commons (CC BY 3.0) License from Dove Medical Press Limited, 2019.
Fig. 10
Fig. 10. Comparative analysis of SPIONs and TPP-SPIONs in HepG2 Cells. (A) Assessment of cell viability in HepG2 cells coincubated with SPIONs and TPP-SPIONs using the MTS colorimetric assay. (B) Quantification of time-dependent uptake of SPIONs and TPP-SPIONs. (C) Analysis of dose-dependent cell viability in HepG2 cells subjected to magnetic hyperthermia with SPIONs and TPP-SPIONs. Bio-TEM images of HepG2 cells after incubation with 50 μg mL−1 of SPIONs and TPP-SPIONs for 12 h. Arrows in (D) indicate NP accumulation in the endo/lysosomes, while arrows in (E) highlight the localization of mito-targeted NPs within the mitochondria. Reproduced from ref. with permission from American Chemical Society, copyright 2019.
Fig. 11
Fig. 11. Various aspects of studying protein corona formation and colloidal stability of NPs in biological media, along with the commonly used techniques for each case. The proposed grouping of binding parameters, structural features, colloidal stability, and corona composition is logical, but it should be noted that other articles may present different categorizations. Acronyms: CD, circular dichroism; DCS, differential centrifugal sedimentation; DLS, dynamic light scattering; FCS, fluorescence correlation spectroscopy; ITC, isothermal titration calorimetry; LC-MS, liquid chromatography-mass spectrometry; SAXS, small angle X-ray scattering; SDS-PAGE, sodium dodecyl sulfate polyacrylamide gel electrophoresis; TEM, transmission electron microscopy.
Fig. 12
Fig. 12. Biodegradation of polymer functionalized nano-cubes; biotransformation of (a) amphiphilic, (b) PEG, coated iron oxide nano-cubes in the model lysosome-like medium. The rate of nano-cubes modulation over time for (c) amphiphilic, (d) PEG coatings. (e and f) In vivo distribution and recycling of nanocubes. Reproduced from ref. with permission from American Chemical Society, Copyright 2013.
Fig. 13
Fig. 13. Variation in AC magnetic susceptibility with temperature of spleen indicating the role of different iron-based species, (A) in-phase component, (B) out of phase component. Reproduced from ref. with permission from American Chemical Society, copyright 2022.
Fig. 14
Fig. 14. Schematic view of ACB setup used for MNP detection and quantification. A phase-sensitive amplifier (lock-in—Stanford Research Systems SR830) (light grey), an electrical signal of 0.7 V at a frequency of 10 kHz is generated and is amplified by power amplifiers (−3 dB) (dark gray), in which the resulting current is applied to the excitation coils. Reproduced from ref. under a Creative Commons (CC BY) Licence from MDPI, Copyright 2022.
Fig. 15
Fig. 15. (A) ACB and (B) ESR data for MNP biodistribution in G1, G2, and G3. (C and D) Comparison between G3 and G4 for the ACB (C) and ESR (D). (E and F) Biodistribution results and changes due to time for ACB (E) and ESR (F). The results are expressed as mean and standard deviation. Same letters represent no significant difference, whereas different letters indicate significant differences between groups (p = 0.05). Reproduced from ref. under a Creative Commons (CC BY) Licence from Springer Nature, Copyright 2017.
Fig. 16
Fig. 16. Biodistribution results for all organs of interest of the Cit-MnFe2O4 over the period from 1 h to 60 days (left panel); elimination via feces every five days (right panel). For statistical analysis, the Mann–Whitney U test was used. It was found no significant difference between the days (p < 0.05). Reproduced from ref. under a Creative Commons (CC BY) Licence from MDPI, Copyright 2022.
Fig. 17
Fig. 17. Physical principles of MRI: (a) a strong magnetic field (B0) is applied in the longitudinal direction and a perturbing RF field pulse is applied in the transverse direction, (b) the relaxation of the longitudinal (M1) and transverse (M2) magnetization has characteristic times (T1 and T2 respectively) and (c) magnetic field inhomogeneities produced by CAs are responsible for variations in the relaxation rates. Basics of MPI: (d) spectral response at a given location of the magnetic tracer within the selection field: the tracer is located at the FFP (upper panel), the tracer is placed in a point within the selection field such that it reaches the saturated magnetization state (lower panel). Reproduced from ref. with permission from American Chemical Society, Copyright 2015.
Fig. 18
Fig. 18. Main XRM techniques: (a) X-ray μ-tomography; (b) scanning X-ray microscopy including STXM and SXFM; (c) full-field X-ray microscopy; (d) X-ray phychography.
Fig. 19
Fig. 19. Examples of XRM used for the study of the Fe content on biological systems. (a) Iron oxide nanoparticle localisation inside a mammalian cell by full-field X-ray microscopy. Reproduced from ref. under a Creative Commons (CC BY) license from Springer Nature, Copyright 2016. (b) Individual core–shell nanoparticle of silica@iron oxide localised on a mammalian cell by ptychography. Reproduced from ref. under a Creative Commons (CC BY) license from Springer Nature, Copyright 2017. (c) Chemical characterisation by X-ray spectroscopy ptychography of individual magnetosomes inside bactéria. Reproduced from ref. under a Creative Commons (CC BY) license from PNAS, Copyright 2016.

Similar articles

Cited by

References

    1. Arms L. Smith D. W. Flynn J. Palmer W. Martin A. Woldu A. Hua S. Advantages and Limitations of Current Techniques for Analyzing the Biodistribution of Nanoparticles. Front. Pharmacol. 2018;9:802. doi: 10.3389/fphar.2018.00802. https://dx.doi.org/10.3389/fphar.2018.00802 - DOI - DOI - PMC - PubMed
    1. Gendelman H. Li T. Boska M. McMillan J. Puligujja P. Zhang G. Bronich T. Liu X. Edagwa B. Magnetic resonance imaging of folic acid-coated magnetite nanoparticles reflects tissue biodistribution of long-acting antiretroviral therapy. Int. J. Nanomed. 2015:3779–3790. doi: 10.2147/IJN.S83279. https://dx.doi.org/10.2147/IJN.S83279 - DOI - DOI - PMC - PubMed
    1. Shakeri-Zadeh A. Bulte J. W. M. Imaging-guided precision hyperthermia with magnetic nanoparticles. Nat. Rev. Bioeng. 2024:245–260. doi: 10.1038/s44222-024-00257-3. https://dx.doi.org/10.1038/s44222-024-00257-3 - DOI - DOI - PMC - PubMed
    1. Rümenapp C. Gleich B. Haase A. Magnetic Nanoparticles in Magnetic Resonance Imaging and Diagnostics. Pharm. Res. 2012;29:1165–1179. doi: 10.1007/s11095-012-0711-y. https://dx.doi.org/10.1007/s11095-012-0711-y - DOI - DOI - PubMed
    1. Bin Na H. Song I. C. Hyeon T. Inorganic Nanoparticles for MRI Contrast Agents. Adv. Mater. 2009;21:2133–2148. doi: 10.1002/adma.200802366. https://dx.doi.org/10.1002/adma.200802366 - DOI - DOI

LinkOut - more resources