. 2025 Apr;15(4):101106.
doi: 10.1016/j.jpha.2024.101106. Epub 2024 Sep 19.

Targeting ceramide-induced microglial pyroptosis: Icariin is a promising therapy for Alzheimer's disease

Affiliations

Targeting ceramide-induced microglial pyroptosis: Icariin is a promising therapy for Alzheimer's disease

Hongli Li et al. J Pharm Anal. 2025 Apr.

Abstract

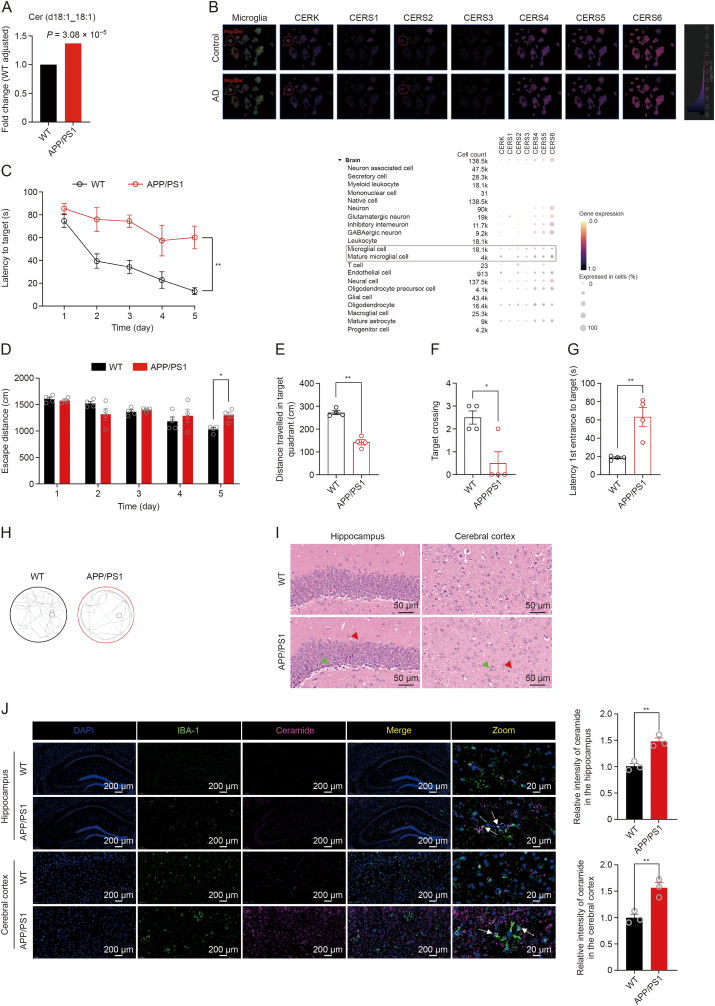
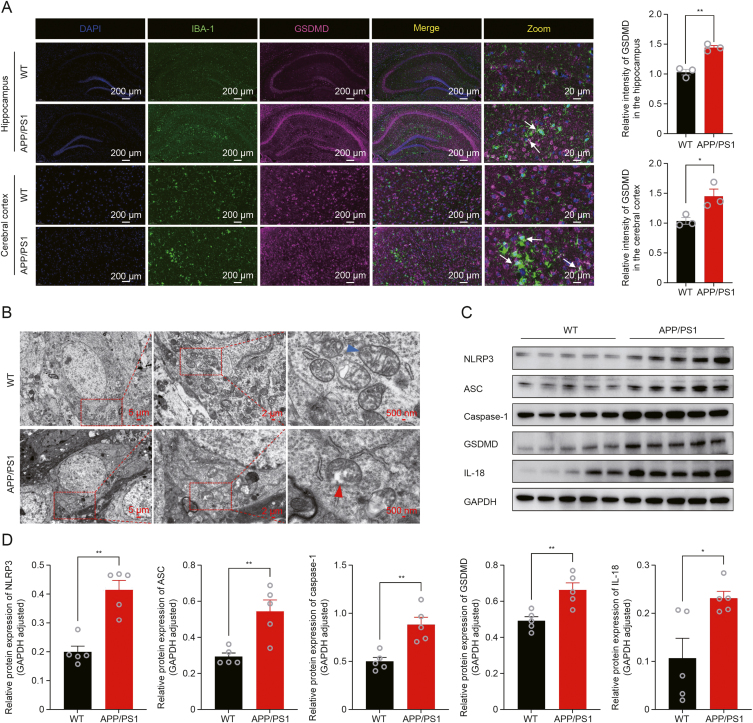
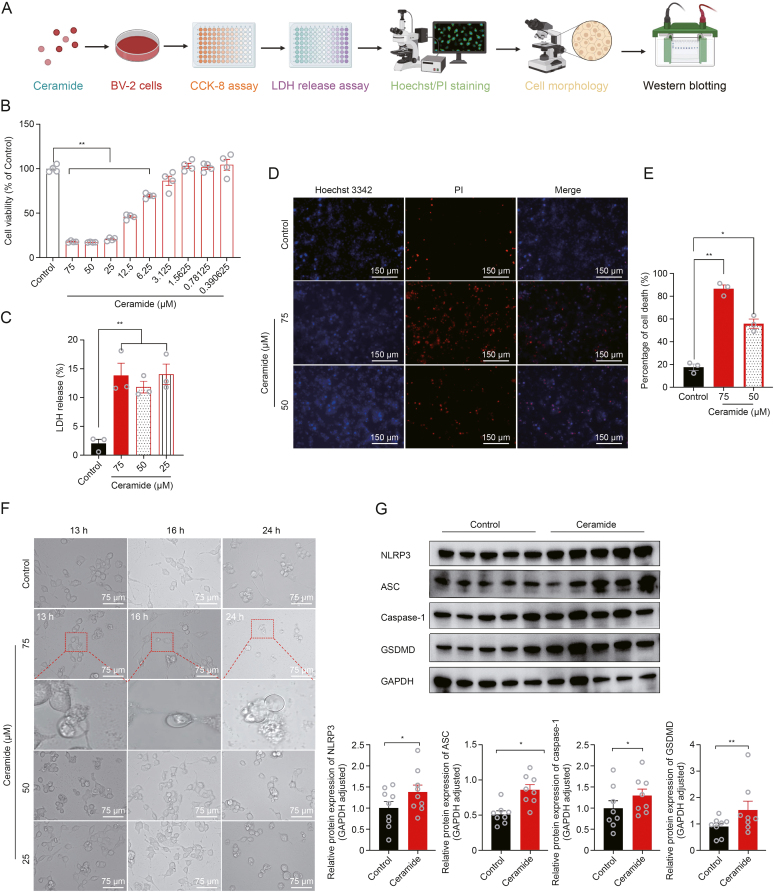
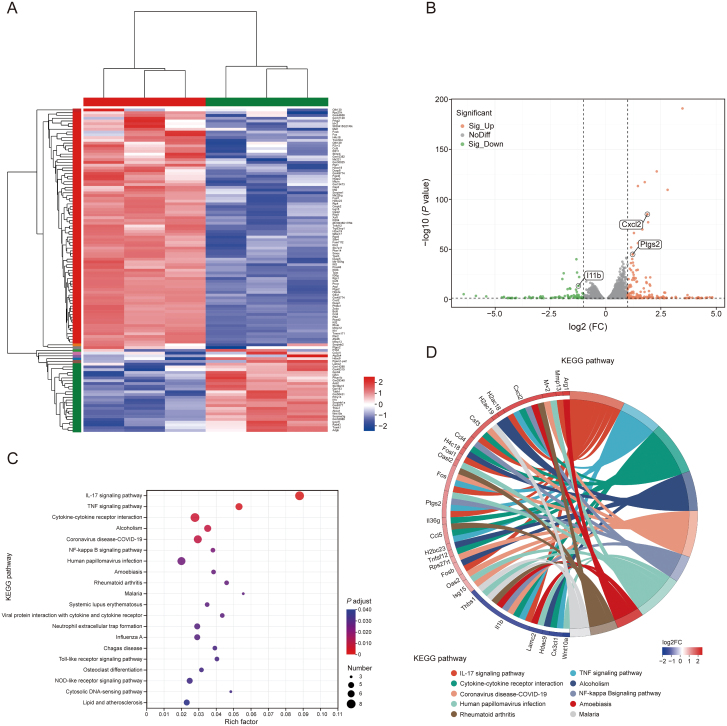
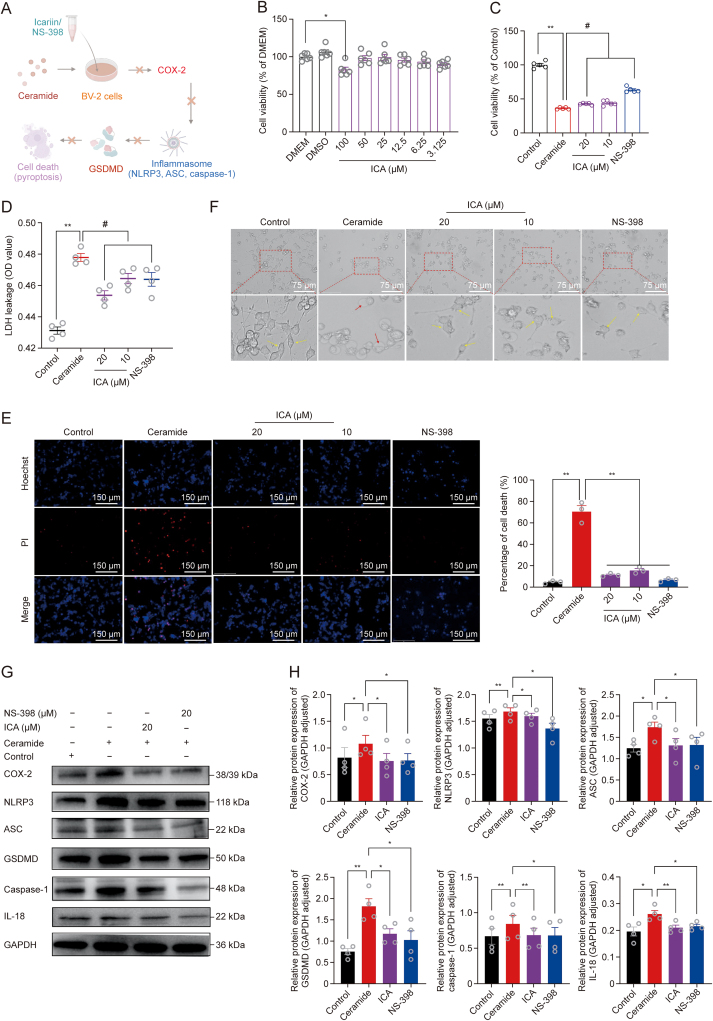
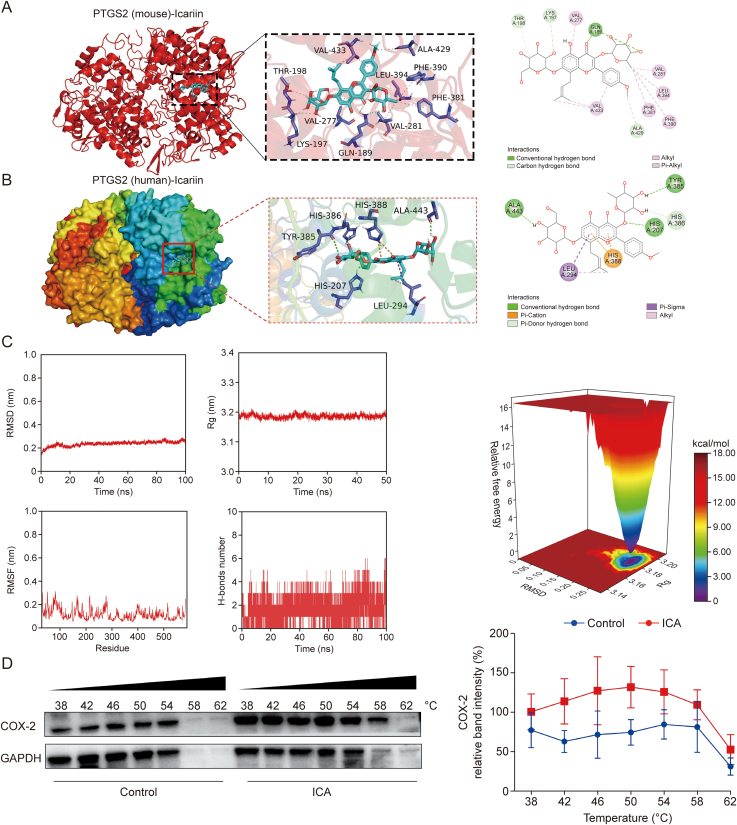
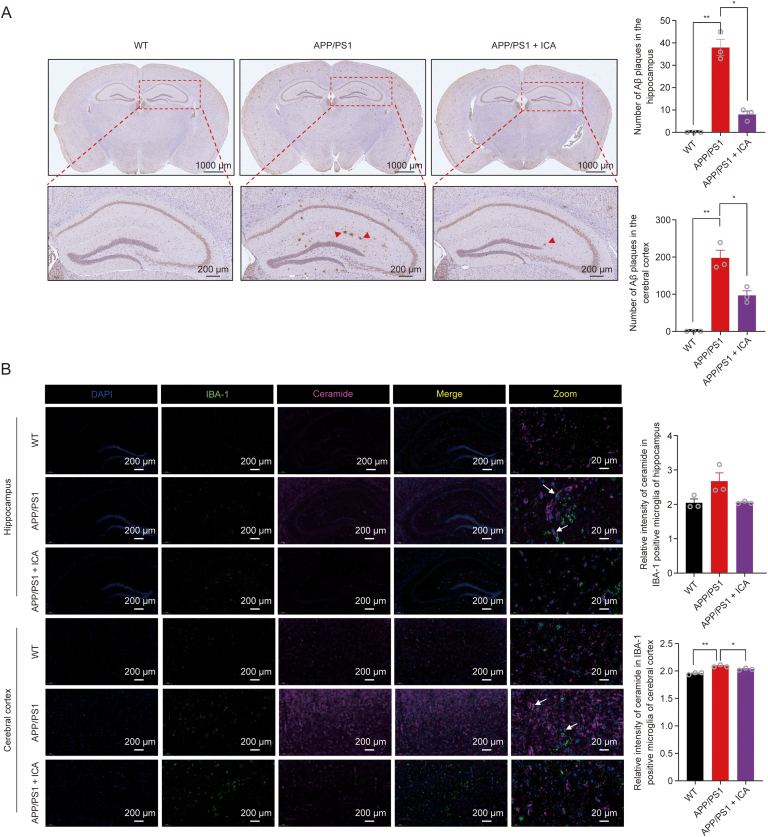
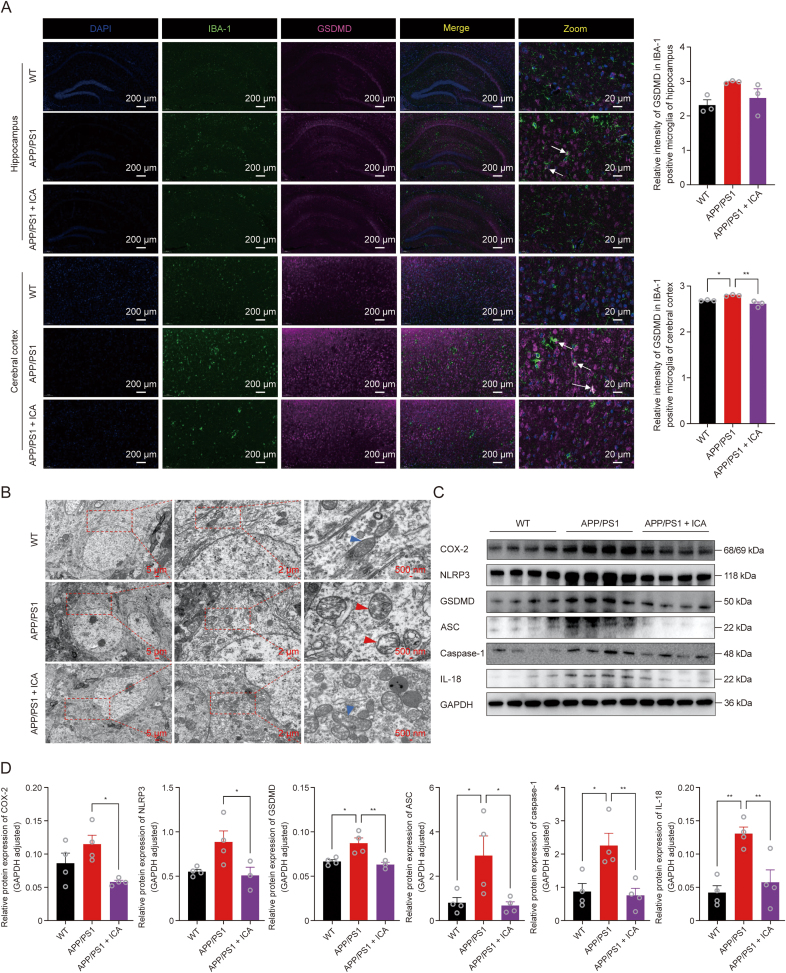
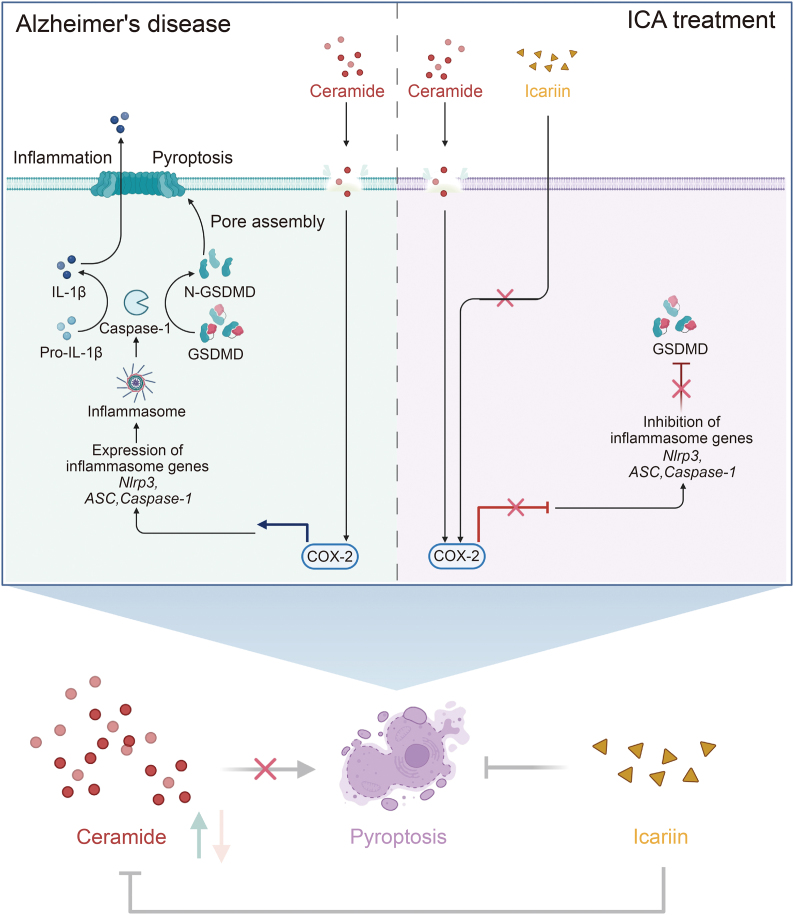
Alzheimer's disease (AD), a progressive dementia, is one of the most common neurodegenerative diseases. Clinical trial results of amyloid-β (Aβ) and tau regulators based on the pretext of straightforward amyloid and tau immunotherapy were disappointing. There are currently no effective strategies for slowing the progression of AD. Herein, we spotlight the dysregulation of lipid metabolism, particularly the elevation of ceramides (Cers), as a critical yet underexplored facet of AD pathogenesis. Our study delineates the role of Cers in promoting microglial pyroptosis, a form of programmed cell death distinct from apoptosis and necroptosis, characterized by cellular swelling, and membrane rupture mediated by the NLRP3 inflammasome pathway. Utilizing both in vivo experiments with amyloid precursor protein (APP)/presenilin 1 (PS1) transgenic mice and in vitro assays with BV-2 microglial cells, we investigate the activation of microglial pyroptosis by Cers and its inhibition by icariin (ICA), a flavonoid with known antioxidant and anti-inflammatory properties. Our findings reveal a significant increase in Cers levels and pyroptosis markers (NOD-like receptor family, pyrin domain containing 3 (NLRP3), apoptosis-associated speck-like protein containing a caspase recruitment domain, caspase-1, gasdermin D (gasdermin D (GSDMD)), and interleukin-18 (IL-18)) in the brains of AD model mice, indicating a direct involvement of Cers in AD pathology through the induction of microglial pyroptosis. Conversely, ICA treatment effectively reduces these pyroptotic markers and Cer levels, thereby attenuating microglial pyroptosis and suggesting a novel therapeutic mechanism of action against AD. This study not only advances our understanding of the pathogenic role of Cers in AD but also introduces ICA as a promising candidate for AD therapy, capable of mitigating neuroinflammation and pyroptosis through the cyclooxygenase-2 (COX-2)-NLRP3 inflammasome-gasdermin D (GSDMD) axis. Our results pave the way for further exploration of Cer metabolism disorders in neurodegenerative diseases and highlight the therapeutic potential of targeting microglial pyroptosis in AD.

Keywords: Alzheimer's disease; COX2; Ceramides; Icariin; Microglia pyroptosis; NLRP3 inflammasome.


Conflict of interest statement

The authors declare that there are no conflicts of interest.

Figures

Image 1
Graphical abstract
Fig. 1
Fig. 1
Elevated ceramide (Cer) levels in amyloid precursor protein (APP)/presenilin 1 (PS1) mice. (A) Cer levels in the brains of APP/PS1 mice. (B) Uniform manifold approximation and projection (UMAP) plot of expression distribution of genes involved in Cer metabolism in single-nucleus RNA sequencing data from the Seattle Alzheimer's Disease Cell Atlas (upper panel, sourced from public database data on the human brain). Darker colors indicate higher expression levels, with red circles indicating microglial cells. Heatmap of the genes involved in Cer metabolism (lower panel, sourced from public database data on the human brain). (C, D) The escape latency (C) and escape distance (D) during acquisition phase of the morris water maze (MWM) test (escape latency: two-way analysis of variance (ANOVA), interaction between time and group, F (4,24) = 2.942, P = 0.0412; effect of group, F (1,6) = 16.57, P = 0.0066; escape distance: two-way ANOVA, interaction between time and group, F (4,24) = 3.527, P = 0.0212; effect of group, F (1,6) = 0.5932, P = 0.0469). (E–G) The distance travelled in the target quadrant (E) (two-tailed unpaired t-test: t = 3.464, d.f. = 6, P = 0.0134), number of platform crossings (F) (two-tailed unpaired t-test: t = 9.094, d.f. = 6, P < 0.0001), and the latency 1st entrance to target (G) (two-tailed unpaired t-test: t = 4.265, d.f. = 6, P = 0.0053) in the probe trial of the MWM test on day 6. (H) Representative swimming trails of the two groups. (I) Representative images of hematoxylin and eosin (HE) staining in the brain of APP/PS1 and wild type (WT) mice. The green arrows indicate pyknosis, and the red arrows signify obscured nuclear boundaries and increased cytoplasm. (J) Representative immunofluorescent staining of Cer and ionized calcium binding adapter molecule 1 (IBA-1) in the brain of APP/PS1 and WT mice. Higher magnification images are presented (hippocampus: two-tailed unpaired t-test: t = 5.733, d.f. = 4, P = 0.0046; cerebral cortex: two-tailed unpaired t-test: t = 4.780, d.f. = 4, P = 0.0088). P < 0.05, ∗∗P < 0.01 versus WT group. AD: Alzheimer's disease; CERK: ceramide kinase; DAPI: 4′,6-diamidino-2-phenylindole.
Fig. 2
Fig. 2
Microglial pyroptosis in amyloid precursor protein (APP)/presenilin 1 (PS1) mice. (A) Representative immunofluorescent staining of gasdermin D (GSDMD) and ionized calcium-binding adaptor molecule 1 (IBA-1) in the brain of APP/PS1 and wild type (WT) mice. Higher magnification images are presented (hippocampus: two-tailed unpaired t-test: t = 7.048, d.f. = 4, P = 0.0021; cerebral cortex: two-tailed unpaired t-test: t = 3.103, d.f. = 4, P = 0.0361). (B) Representative transmission electron microscopy (TEM) images showing morphological changes of mitochondria. Higher magnification images are presented. Blue arrows indicating normal mitochondrial morphology, and red arrows indicating abnormal mitochondrial morphology, including rounded mitochondria, swelling, and blurred cristae. (C) The protein expression of NOD-like receptor family, pyrin domain containing 3 (NLRP3), apoptosis-associated speck-like protein containing a caspase recruitment domain (ASC), caspase-1, GSDMD and interleukin-18 (IL-18) in hippocampus was detected by Western blot assays. (D) Quantitative analysis of Western blot (NLRP3: two-tailed unpaired t-test: t = 5.594, d.f. = 8, P = 0.0005; ASC: t = 3.850, d.f. = 8, P = 0.0049; caspase-1: t = 4.234, d.f. = 8, P = 0.0029; GSDMD: t = 3.761, d.f. = 8, P = 0.0055; IL-18: t = 2.861, d.f. = 8, P = 0.0211). P < 0.05, ∗∗P < 0.01 versus WT group. DAPI: 4′,6-diamidino-2-phenylindole; GAPDH: glyceraldehyde-3-phosphate dehydrogenase.
Fig. 3
Fig. 3
Ceramide (Cer) induces pyroptosis in BV-2 microglial cells. (A) Schematic diagram illustrating Cer treatment leading to microglial pyroptosis. (B) Cell viability was assessed by the cell counting kit-8 (CCK-8) assay (one-way analysis of variance (ANOVA), F (9, 30) = 3.113, P < 0.0001; Dunnett's multiple comparisons: Control versus 75, P < 0.0001; Control versus 50, P < 0.0001; Control versus 25, P = 0.014; Control versus 12.5, P < 0.0001; Control versus 6.25, P < 0.0001; Control versus 3.125, P = 0.0203). (C–E) Cell membrane integrity was assessed by lactate dehydrogenase (LDH) release assay (one-way ANOVA, F (2, 6) = 0.1357, P < 0.0001; Dunnett's multiple comparisons: Control versus 75, P = 0.0015; Control versus 50, P = 0.0049; Control versus 25, P = 0.014) (C) and Hoechst/propidium iodide (PI) staining (D, E) (one-way analysis of variance (ANOVA), F (3, 8) = 0.2482, P = 0.0015; Dunnett's multiple comparisons: Control versus 75, P < 0.0001; Control versus 50, P = 0.0004). (F) Cell morphology changes assessed by light microscopy. The bottom image represents a magnified view (× 5.25) of the area marked by the red box in the top image. (G) The protein expression of NOD-like receptor family, pyrin domain containing 3 (NLRP3), apoptosis-associated speck-like protein containing a caspase recruitment domain (ASC), caspase-1, and gasdermin D (GSDMD) in BV-2 microglia was detected by Western blot assays (NLRP3: two-tailed paired t-test: t = 2.451, d.f. = 8, P = 0.0399; ASC: t = 4.182, d.f. = 4, P = 0.0139; caspase-1: t = 2.437, d.f. = 7, P = 0.0449; GSDMD: Wilcoxon matched-pairs signed rank test: P = 0.0078). P < 0.05, ∗∗P < 0.01 versus Control group. GAPDH: glyceraldehyde-3-phosphate dehydrogenase.
Fig. 4
Fig. 4
Ceramide (Cer) may induce BV-2 microglial cell pyroptosis by upregulating cyclooxygenase-2 (COX-2). (A, B) Heatmap (A) and volcano plot (B) of differentially expressed genes detected in BV-2 microglial cells after Cer treatment. (C) Kyoto Encyclopedia of Genes and Genomes (KEGG) pathway enrichment of differentially expressed genes. (D) Circular pathway diagram illustrating the relationship between pathways and genes. Unpaired Student's t-test was used for statistical analysis. n = 3–5 per group.
Fig. 5
Fig. 5
Icariin (ICA) and NS-398 alleviate ceramide (Cer)-induced pyroptosis in BV-2 microglial cells. (A) Schematic representation illustrating the protective role of ICA and NS-398 against Cer-induced pyroptosis in BV-2 microglial cells. (B) Cell viability of BV-2 microglial cells evaluated via the cell counting kit-8 (CCK-8) assay to determine non-toxic dosage of ICA on BV-2 microglial cells (one-way analysis of variance (ANOVA), F (7, 40) = 0.1995, P < 0.0001; Dunnett's multiple comparisons, DMEM versus 100, P = 0.0010). (C) Assessment of BV-2 cell viability using the CCK-8 assay, examining the effects of NS-398 and ICA on Cer-treated BV-2 cells (one-way ANOVA, F (4, 20) = 1.253, P < 0.0001; Dunnett's multiple comparisons, Ceramide versus Control, P < 0.0001; Ceramide versus 20, P = 0.0203; Ceramide versus 10, P = 0.0058; Ceramide versus NS-398, P < 0.0001). (D) Analysis of cell membrane integrity through the lactate dehydrogenase (LDH) release assay (one-way ANOVA, F (4, 15) = 0.6154, P < 0.0001; Dunnett's multiple comparisons: Ceramide versus Control, P < 0.0001; Ceramide versus 20, P < 0.0001; Ceramide versus 10, P < 0.0001; Ceramide versus NS-398, P < 0.0001). (E) Hoechst/propidium iodide (PI) staining to evaluate cell membrane integrity (One-way ANOVA, F (4, 10) = 1.628, P < 0.0001; Dunnett's multiple comparisons: Ceramide versus Control, P < 0.0001; Ceramide versus 20, P < 0.0001; Ceramide versus 10, P < 0.0001; Ceramide versus NS-398, P < 0.0001). Observation of cellular morphological alterations via light microscopy. (F) Observation of cellular morphological alterations via light microscopy. The bottom image represents a magnified view (× 3) of the area marked by the red box in the top image. (G) The protein expression of inflammatory and pyroptosis-associated proteins (cyclooxygenase-2 (COX-2), NOD-like receptor family, pyrin domain containing 3 (NLRP3), apoptosis-associated speck-like protein containing a caspase recruitment domain (ASC), gasdermin D (GSDMD), caspase-1, and interleukin-18 (IL-18)) in BV-2 microglia was detected by Western blot assays. (H) Quantitative analysis of Western blot (one-way ANOVA with Dunnett's multiple comparisons: Ceramide versus Control, P = 0.0401 (COX-2), P = 0.0030 (NLRP3), P = 0.0359 (ASC), P = 0.0088 (GSDMD), P = 0.0056 (caspase-1), P = 0.0209 (IL-18); Ceramide versus ICA, P = 0.0244 (COX-2), P = 0.0390 (NLRP3), P = 0.0479 (ASC), P = 0.0229 (GSDMD), P = 0.0087 (caspase-1), P = 0.0022 (IL-18); Ceramide versus NS-398, P = 0.0114 (COX-2), P = 0.0333 (NLRP3), P = 0.0259 (ASC), P = 0.0279 (GSDMD), P = 0.0218 (caspase-1), P = 0.0157 (IL-18)). #P < 0.05, P < 0.05, ∗∗P < 0.01 versus Ceramide group. OD: optical density; DMEM: Dulbecco's modified Eagle medium; DMSO: dimethyl sulfoxide; GAPDH: glyceraldehyde-3-phosphate dehydrogenase.
Fig. 6
Fig. 6
Icariin (ICA) may inhibit microglial pyroptosis by targeting cyclooxygenase-2 (COX-2). (A, B) 3D molecular docking analysis of ICA (blue) and COX-2 (mouse: red; human: multicolored). (C) Molecular dynamics simulations demonstrating the strong binding affinity between ICA and COX-2. The root mean square deviation (RMSD) curve provides an indicator of the stability of the protein-ligand complex, with a smoother RMSD curve indicating higher stability; The root mean square fluctuation (RMSF) curve represents the extent of fluctuations of amino acid residues throughout the simulation, with higher RMSF values indicating greater fluctuations and vice versa; The radius of gyration (Rg) measures the compactness and stability of the structure, with larger Rg values indicating significant expansion and lower values suggesting a more compact and stable system during the simulation; The number of stabilizing H-bonds between the ligand and protein at the binding site is quantified; The free energy landscape (FEL) depicts the conformations with the lowest energy throughout the dynamic simulation process. A weak or unstable interaction between the protein and ligand is indicated by the presence of multiple, rough energy minima clusters, whereas a strong and stable interaction is characterized by nearly single, smooth energy clusters. (D) Cellular thermal shift assay (CETSA) experiment confirmed the binding capability of ICA to COX-2. One-way analysis of variance (ANOVA) was used for statistical analysis followed by Tukey's multiple comparisons test. GAPDH: glyceraldehyde-3-phosphate dehydrogenase.
Fig. 7
Fig. 7
Icariin (ICA) improves cognitive dysfunction in amyloid precursor protein (APP)/presenilin 1 (PS1) mice. (A) Schematic diagram of the oral administration of ICA to APP/PS1 mice, observing changes in animal cognitive function and the inhibitory effect on microglial pyroptosis. (B) The body weight (Two-way analysis of variance (ANOVA) with repeated measures: interaction between time and group, F (9, 36) = 0.08049, P = 0.9998; effect of group, F (3,12) = 0.02690, P = 0.9937). (C, D) The escape latency (C) and escape distance (D) during acquisition phase of morris water maze (MWM test) (escape latency: two-way ANOVA with repeated measures, interaction between time and group, F (12, 48) = 0.9392, P = 0.5172; effect of time, F (2.826, 33.91) = 21.91, P < 0.0001; effect of group, F (3, 12) = 7.058, P = 0.0055; escape distance: two-way ANOVA with repeated measures: interaction between time and group, F (12, 48) = 2.264, P = 0.0228; effect of group, F (3, 12) = 7.058, P = 0.0363). (E–G) The latency 1st entrance to the target (E), the distance travelled in the target quadrant (F) and the number of platform crossings (G) in the probe trial of the MWM test (entrance to the target: one-way ANOVA, F (3, 12) = 1.825, P = 0.0002; Tukey's multiple comparisons test, APP/PS1 versus wild type (WT), P = 0.0006; WT versus WT + ICA, P = 0.9704; APP/PS1 versus APP/PS1 + ICA, P = 0.0009; the distance travelled in the target quadrant: F (3, 12) = 0.2397, P = 0.0003; APP/PS1 versus WT, P = 0.0007; WT versus WT + ICA, P = 0.9999; APP/PS1 versus APP/PS1 + ICA, P = 0.0013; the number of platform crossings: F (3, 12) = 1.207, P = 0.0169; APP/PS1 versus WT, P = 0.0363; WT versus WT + ICA, P = 0.9914; APP/PS1 versus APP/PS1 + ICA, P = 0.0469). (H) Representative swimming trails of three groups. (I) Swimming speed (one-way ANOVA, F (3, 12) = 0.9075, P = 0.7746). (J) Total distance (one-way ANOVA, F (3, 12) = 0.8059, P = 0.9838). (K) Representative images of hematoxylin and eosin (HE) staining in the brain among three group. the green arrows indicate pyknosis, and the red arrows signify obscured nuclear boundaries and increased cytoplasm. P < 0.05, ∗∗P < 0.01 versus APP/PS1 group, #P < 0.05, ##P < 0.01 versus WT group. TEM: transmission electron microscopy.
Fig. 8
Fig. 8
Icariin (ICA) may improve cognitive dysfunction in amyloid precursor protein (APP)/presenilin 1 (PS1) mice by reducing amyloid beta (Aβ) deposition and cerebral ceramide (Cer) levels. (A) Representative Immunohistochemistry (IHC) images illustrate Aβ distribution in the brain among three groups (hippocampus: one-way analysis of variance (ANOVA), F (3, 12) = 1.825, P < 0.0001. Tukey's multiple comparisons test, APP/PS1 versus wild type (WT), P < 0.0001; APP/PS1 versus APP/PS1 + ICA, P = 0.0002; cortex: One-way ANOVA, F (2, 6) = 0.9036, P = 0.0002. Tukey's multiple comparisons test, APP/PS1 versus WT, P = 0.0001; APP/PS1 versus APP/PS1+ICA, P = 0.0041). (B) Representative immunofluorescent staining of Cer and ionized calcium-binding adaptor molecule 1 (IBA-1) in the brain among three group. Higher magnification images are presented (hippocampus: one-way ANOVA, F (2, 6) = 0.5736, P = 0.0460; cerebral cortex: one-way ANOVA, F (2, 6) = 0.0007694, P = 0.0006. Tukey's multiple comparisons test, APP/PS1 versus WT, P = 0.0004; APP/PS1 versus APP/PS1 + ICA, P = 0.0270). P < 0.05, ∗∗P < 0.01 versus APP/PS1 group. DAPI: 4′,6-diamidino-2-phenylindole.
Fig. 9
Fig. 9
Icariin (ICA) may improve cognitive dysfunction in amyloid precursor protein (APP)/presenilin 1 (PS1) mice by inhibiting microglial pyroptosis. (A) Representative immunofluorescent staining of gasdermin D (GSDMD) and ionized calcium-binding adaptor molecule 1 (IBA-1) in the brain among three group. Higher magnification images are presented (hippocampus: one-way analysis of variance (ANOVA), F (2, 6) = 1.098, P = 0.0911; cerebral cortex: one-way ANOVA, F (2, 6) = 1.571, P = 0.0055. Tukey's multiple comparisons test, APP/PS1 versus wild type (WT), P = 0.0367; APP/PS1 versus APP/PS1 + ICA, P = 0.0034). (B) Representative transmission electron microscopy (TEM) images showing morphological changes of mitochondria. Higher magnification images are presented. Blue arrows indicating normal mitochondrial morphology, and red arrows indicating abnormal mitochondrial morphology, including rounded mitochondria, swelling, and blurred cristae. (C) The protein expression of cyclooxygenase-2 (COX-2), NOD-like receptor family, pyrin domain containing 3 (NLRP3), GSDMD, apoptosis-associated speck-like protein containing a caspase recruitment domain (ASC), caspase-1, and interleukin-18 (IL-18) in hippocampus was detected by Western blot assays. (D) Quantitative analysis of Western blot (COX-2: one-way ANOVA, F (2, 9) = 3.492, P = 0.0257. Tukey's multiple comparisons test, APP/PS1 versus WT, P = 0.2094; APP/PS1 versus APP/PS1 + ICA, P = 0.0152; NLRP3: one-way ANOVA, F (2, 8) = 1.825, P = 0.0370. Tukey's multiple comparisons test, APP/PS1 versus WT, P = 0.0507; APP/PS1 versus APP/PS1+ICA, P = 0.0418; GSDMD: one-way ANOVA, F (2, 8) = 6.558, P = 0.0078. Tukey's multiple comparisons test, APP/PS1 versus WT, P = 0.0138; APP/PS1 versus APP/PS1 + ICA, P = 0.0087; ASC: one-way ANOVA, F (2, 9) = 15.23, P = 0.0289. Tukey's multiple comparisons test, APP/PS1 versus WT, P = 0.0398; APP/PS1 versus APP/PS1 + ICA, P = 0.0305; caspase-1: one-way ANOVA, F (2, 9) = 0.1516, P = 0.0079. Tukey's multiple comparisons test, APP/PS1 versus WT, P = 0.0131; APP/PS1 versus APP/PS1 + ICA, P = 0.0084; IL-18: one-way ANOVA, F (2, 9) = 0.3374, P = 0.0029. Tukey's multiple comparisons test, APP/PS1 versus WT, P = 0.0025; APP/PS1 versus APP/PS1 + ICA, P = 0.0080). P < 0.05, ∗∗P < 0.01 versus APP/PS1 group. GAPDH: glyceraldehyde-3-phosphate dehydrogenase.
Fig. 10
Fig. 10
A schematic diagram illustrating the occurrence of microglial pyroptosis and the protective effects of icariin (ICA) on ceramide (Cer)-induced microglia pyroptosis. Elevated Cer levels stimulate microglial cells, triggering the cyclooxygenase-2 (COX-2)/NOD-like receptor family, pyrin domain containing 3 (NLRP3) inflammasome/gasdermin D (GSDMD) signaling pathway, leading to increased inflammation, cell membrane rupture, and the occurrence of pyroptosis. ICA treatment can inhibit pyroptosis by reducing Cer levels and targeting COX-2.ASC: apoptosis-associated speck-like protein containing a caspase recruitment domain; IL-1β: interleukin-1β.

Similar articles

References

    1. Jia J., Ning Y., Chen M., et al. Biomarker changes during 20 years preceding Alzheimer's disease. N. Engl. J. Med. 2024;390:712–722. - PubMed
    1. Congdon E.E., Ji C., Tetlow A.M., et al. Tau-targeting therapies for Alzheimer disease: Current status and future directions. Nat. Rev. Neurol. 2023;19:715–736. - PMC - PubMed
    1. Kosoy R., Fullard J.F., Zeng B., et al. Genetics of the human microglia regulome refines Alzheimer's disease risk loci. Nat. Genet. 2022;54:1145–1154. - PMC - PubMed
    1. Singh D. Astrocytic and microglial cells as the modulators of neuroinflammation in Alzheimer's disease. J. Neuroinflammation. 2022;19 - PMC - PubMed
    1. Gao Z., Luo K., Hu Y., et al. Melatonin alleviates chronic stress-induced hippocampal microglia pyroptosis and subsequent depression-like behaviors by inhibiting Cathepsin B/NLRP3 signaling pathway in rats. Transl. Psychiatry. 2024;14 - PMC - PubMed

LinkOut - more resources