. 2025 Mar 28;28(5):112316.
doi: 10.1016/j.isci.2025.112316. eCollection 2025 May 16.

Deciphering aging-associated prognosis and heterogeneity in gastric cancer through a machine learning-driven approach

Affiliations

Deciphering aging-associated prognosis and heterogeneity in gastric cancer through a machine learning-driven approach

Jiang Li et al. iScience. .

Abstract

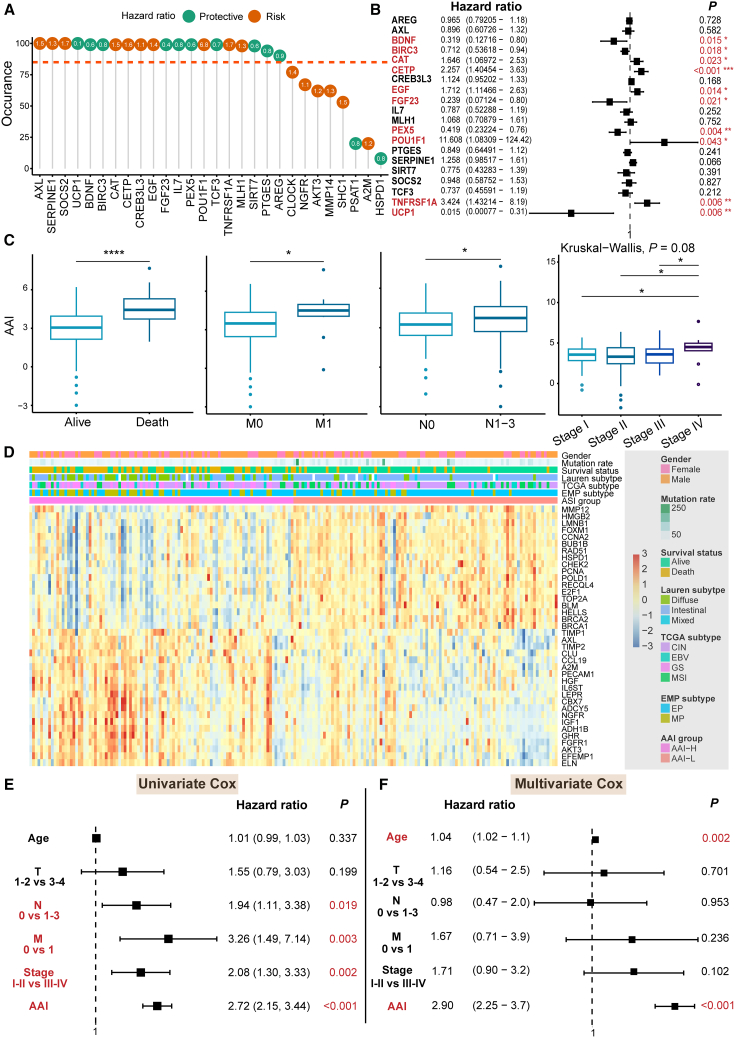
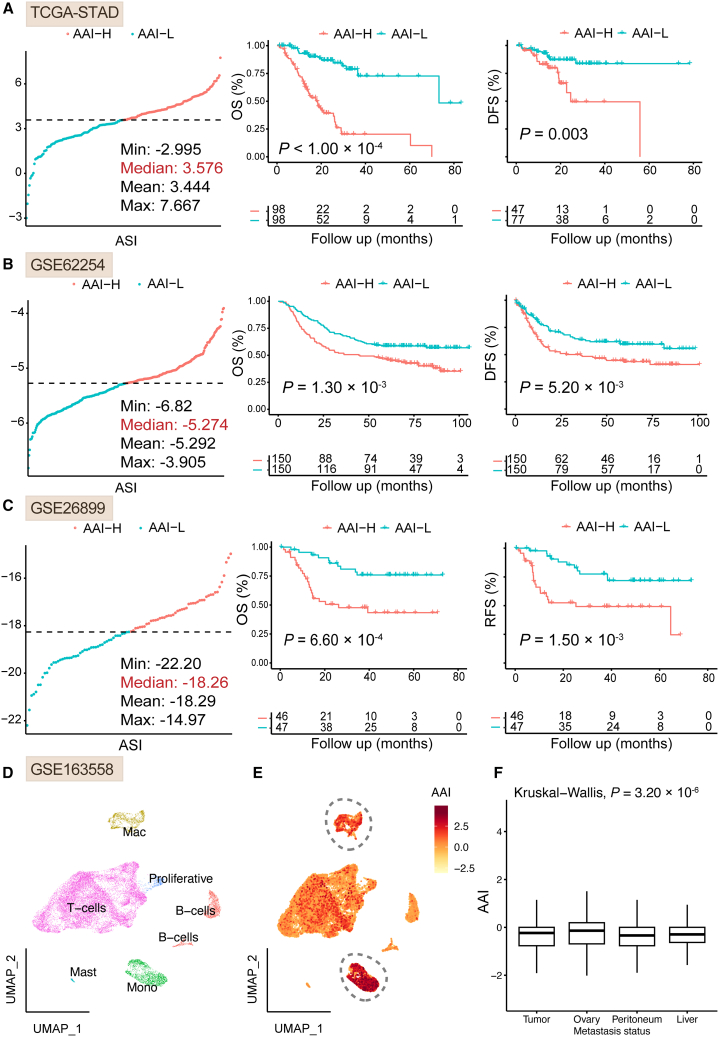
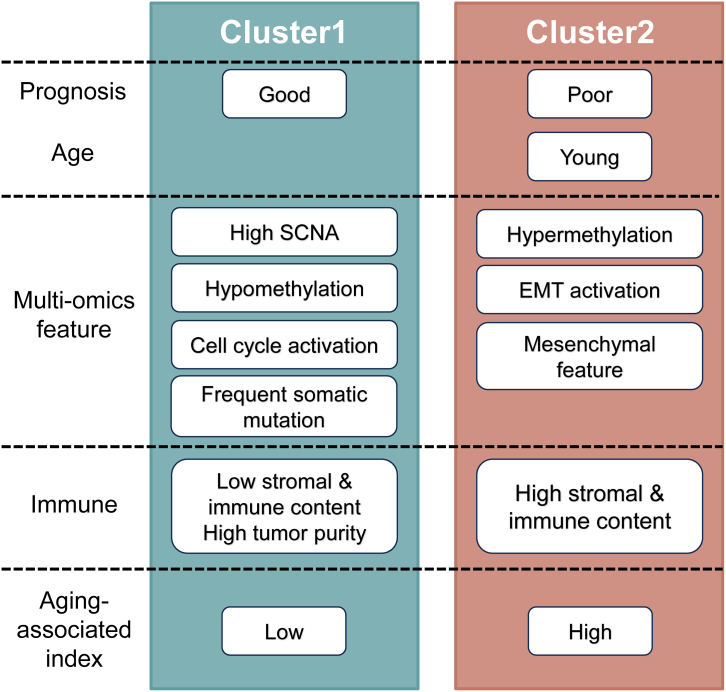
Gastric cancer (GC) is a prevalent malignancy with a high mortality rate and limited treatment options. Aging significantly contributes to tumor progression, and GC was confirmed as an aging-related heterogeneous disease. This study established an aging-associated index (AAI) using a machine learning-derived gene panel to stratify GC patients. High AAI scores associated with poor prognosis and indicated potential benefits from adjuvant chemotherapy, while showing resistance to immunotherapy. Single-cell transcriptome analysis revealed that AAI was enriched in monocyte cells within the tumor microenvironment. Two distinct molecular subtypes of GC were identified through unsupervised clustering, leading to the development of a subtype-specific regulatory network highlighting SOX7 and ELK3 as potential therapeutic targets. Drug sensitivity analyses indicated that patients with high ELK3 expression may respond to FDA-approved drugs (axitinib, dacarbazine, crizotinib, and vincristine). Finally, a user-friendly Shiny application was created to facilitate access to the prognostic model and molecular subtype classifier for GC.

Keywords: Chemistry; Computer science; Drugs.


Conflict of interest statement

The authors declare no competing interests.

Figures

None
Graphical abstract
Figure 1
Figure 1
The schematic workflow of this study, and the variate landscape of aging-associated genes in GC patients (A) Flowchart for comprehensive analysis of aging patterns in GC patients. (B) Heatmap of differentially expressed aging-associated genes between tumor and adjacent normal samples in the TCGA-STAD dataset. (C) Volcano plot showed the DEGs between tumor and adjacent normal samples. Points with gene symbols are obvious DEGs (BH-adjusted p < 0.001 and |log2 fold change| > 3). (D) The genomic location, gene expression profiles, and DNA methylation levels of aging-associated DEGs in the TCGA-STAD dataset. (E and F) Functional annotations on DEGs of (E) GO terms and (F) KEGG analysis. (G) The somatic mutation landscape of aging-associated genes. The top20 mutated genes were presented in the oncoplot.
Figure 2
Figure 2
The aging-associated index was established for GC patients (A) A 20-gene panel was prioritized using machine learning method. (B) The prognostic significances of selected genes using multi-variate Cox regression model. (C) The AAI significantly associated with several clinicopathological factors, such as survival status, tumor metastasis, lymph node metastasis, and tumor stage. Data are represented as mean ± SEM. (D) A heatmap showed the significant aging-associated DEGs between high and low AAI group (stratified by the median value of AAI). The AAI served as a significant independent prognostic factor when combined with other clinical information in (E) univariate Cox and (F) multi-variate Cox regression analysis. The Wilcoxon test was used for comparisons between two groups and statistical significance was indicated with asterisks: ∗ p < 0.05, ∗∗ p < 0.01, ∗∗∗ p < 0.001; ns denotes not significant. A p value of <0.05 was considered statistically significant.
Figure 3
Figure 3
The AAI could be utilized as a prognosis and metastasis predictor of GC patients in multiple datasets (A–C) The GC patients with higher AAI scores showed poorer OS and RFS in (A) the TCGA-STAD discovery dataset, and two other independent validation datasets, (B) GSE62254 and (C) GSE26899 (patients were stratified by the median value of AAI, separately). (D) UMAP plot visualization of cell subtypes from seven GC patients. Cell subtypes were annotated by marker expression levels. (E) UMAP plot visualization of the distribution of the AAI in GC cells. (F) Violin plot of the AAI value in different tumor status of GC patients. Data are represented as mean ± SEM. Survival curves were compared via log rank test.
Figure 4
Figure 4
A two-class molecular subtypes were identified using unsupervised clustering (A) GC patients were classified into two molecular clusters using gene expression profiles in the TCGA-STAD discovery dataset. (B) The silhouette analysis demonstrated that the two identified subtypes were identical internally. (C) The PCA analysis showed that the two subtypes could be clearly separated. The Cluster2 subtype exhibited poorer OS and RFS compared to the Cluster1 subtype, and significantly associated with other GC molecular subtypes in the (D) TCGA-STAD, (E) GSE62254 and (F) GSE26899 datasets. Survival curves were compared via log rank test.
Figure 5
Figure 5
The multi-omics characteristics of the identified GC molecular subtypes (A–C) The Cluster2 subtype patients had significant (A) younger population, (B) higher DNA methylation levels, and (C) less SCNA numbers. Data are represented as mean ± SEM. (D and E) The Cluster1 subtype had higher somatic mutated genes, compared to the Cluster2 subtype. (F) The gene set mRNA enrichment analysis showing signatures of special interest of GC patients in different molecular subtypes, including characteristic gene signatures, canonical pathways, immune signatures, metabolic pathways as well as immune and stromal cell admixture in tumor samples (inferred by the ESTIMATE algorithm). (G) The Cluster2 subtype associated with higher immune infiltration contents, compared to the Cluster1 subtype. Data are represented as mean ± SEM. (H) The Cluster1 subtype had higher tumor purity content, whereas the Cluster2 subtype had higher immune and stromal cell admixtures. Data are represented as mean ± SEM. The Wilcoxon test was used for comparisons between two groups and statistical significance was indicated with asterisks: ∗ p < 0.05, ∗∗ p < 0.01, ∗∗∗ p < 0.001; ns denotes Not Significant. A p value of <0.05 was considered statistically significant.
Figure 6
Figure 6
The transcription factor regulatory network was established to identify subtype-specific potential target TF (A) A regulatory network inference was established using the expression profiles of TF and mRNA. (B) Univariate Cox analysis revealed two prognostically significant potential TFs. (C) Patients with higher expression levels of SOX7 showed poorer OS (patients stratified by optional value). (D) Patients with higher expression levels of ELK3 showed poorer OS (patients stratified by optional value). Survival curves were compared via log rank test. (E and F) The identified TFs, (E) ELK3 and (F) SOX7 were upregulated in the Cluster2 subtype (Data are represented as mean ± SEM), (G) could serve as diagnostic biomarkers, and (H) further detected at protein expression levels in HPA database (scale bar: 200 μm). The Wilcoxon test was used for comparisons between two groups and statistical significance was indicated with asterisks: ∗ p < 0.05, ∗∗ p < 0.01, ∗∗∗ p < 0.001; ns denotes not significant. A p value of <0.05 was considered statistically significant.
Figure 7
Figure 7
Drug sensitivity analysis evaluating the predictive values of the two identified TFs (A) The heatmap showed the correlations between the drug sensitivity scores and the TF expression levels. (B and C) The drug sensitivity analysis of (B) ELK3 and (C) SOX7. (D) The correlations between the two TFs and drug sensitivity scores.
Figure 8
Figure 8
Overview of aging-associated molecular subtypes of GC We identified two molecular subtypes utilizing aging-associated patterns in GC, and the clinical differences, multi-omics characteristics, and immune infiltration of the two subtypes were comprehensively explored.

References

    1. Sung H., Ferlay J., Siegel R.L., Laversanne M., Soerjomataram I., Jemal A., Bray F. Global cancer statistics 2020: GLOBOCAN estimates of incidence and mortality worldwide for 36 cancers in 185 countries. CA Cancer J. Clin. 2021;71:209–249. - PubMed
    1. Joshi S.S., Badgwell B.D. Current treatment and recent progress in gastric cancer. CA Cancer J. Clin. 2021;71:264–279. - PMC - PubMed
    1. Smyth E.C., Nilsson M., Grabsch H.I., van Grieken N.C., Lordick F. Gastric cancer. Lancet. 2020;396:635–648. - PubMed
    1. Ho S.W.T., Tan P. Dissection of gastric cancer heterogeneity for precision oncology. Cancer Sci. 2019;110:3405–3414. - PMC - PubMed
    1. López-Otín C., Blasco M.A., Partridge L., Serrano M., Kroemer G. Hallmarks of aging: An expanding universe. Cell. 2023;186:243–278. - PubMed

LinkOut - more resources