

A Clinical Risk Score Based on Albumin and Electrolyte Levels for Predicting Death Risk in Hospitalized Elderly COVID-19 Patients
- PMID: 40256421
- PMCID: PMC12007163
- DOI: 10.2147/IJGM.S510647
A Clinical Risk Score Based on Albumin and Electrolyte Levels for Predicting Death Risk in Hospitalized Elderly COVID-19 Patients
Abstract
Background: The Omicron subvariants of SARS-CoV-2 spread rapidly since 2021. Following China's relaxation of containment measures in December 2022, a surge in COVID-19 cases poses a public health threat. Early identification of elderly COVID-19 patients at death risk is crucial for optimizing treatment and resource use.
Objective: To develop a clinical score for predicting death risk in elderly COVID-19 patients at hospital admission, based on a cohort from the Second Hospital of Shandong University.
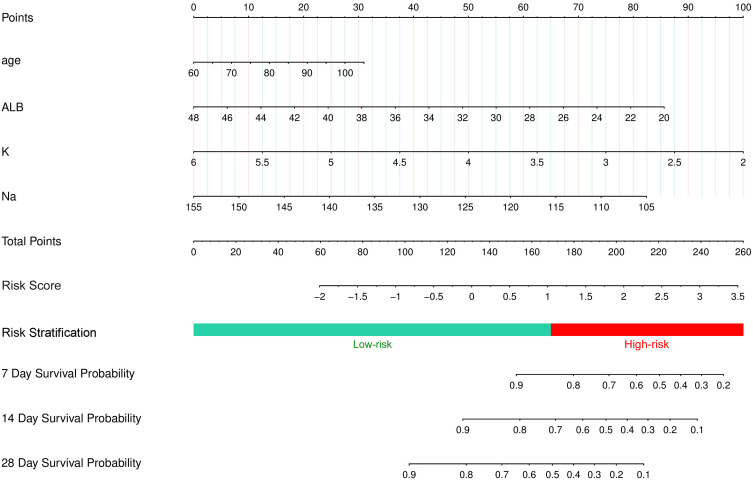
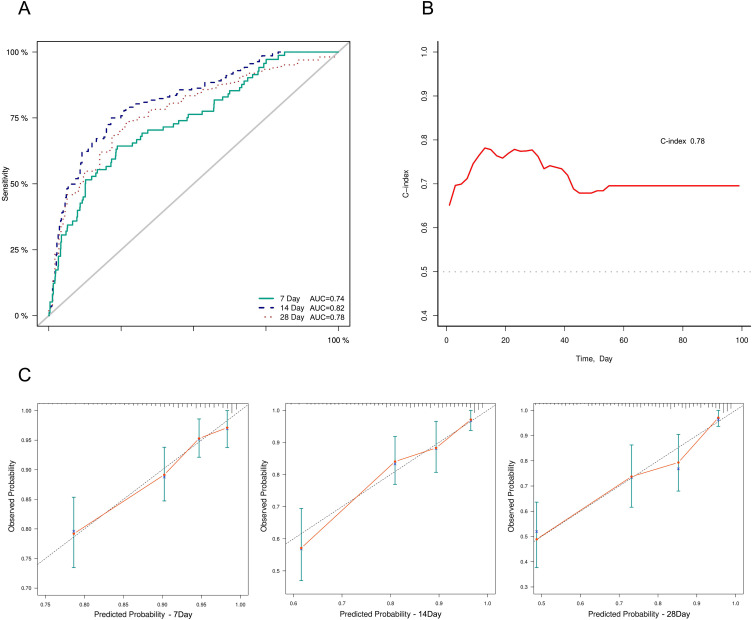
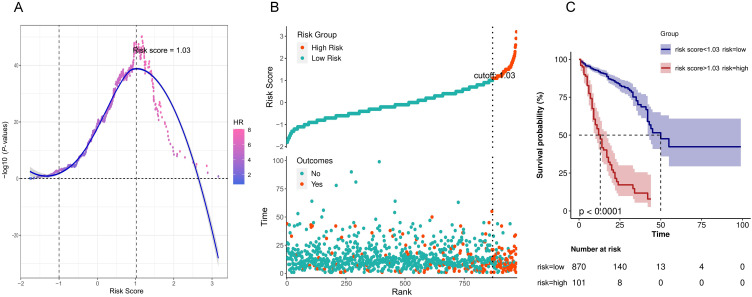
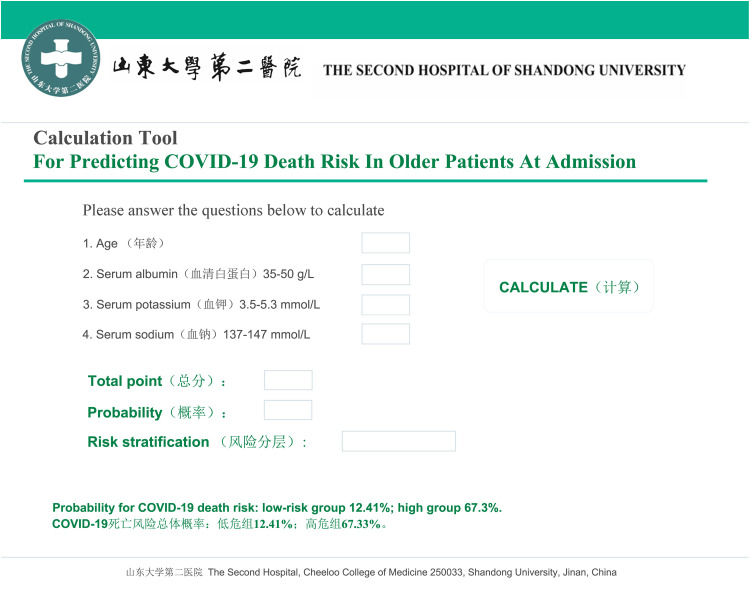
Methods: We established a retrospective cohort of hospitalized COVID-19 patients from November 1, 2022, to March 31, 2023. Cox regression identified prognostic factors, leading to the development of a nomogram-based prediction model and a clinical risk score. Patients were classified into low- and high-risk groups using optimal segmentation thresholds, with survival curves generated by the Kaplan-Meier method. An online risk calculator was developed to facilitate real-time risk assessment in clinical settings.
Results: The cohort included 1413 hospitalized COVID-19 patients. Elderly patients (≥60 years, N = 971) had a high mortality rate of 18.13%. Four independent predictors of mortality were identified: age (HR = 1.07), serum albumin (HR = 0.88), serum potassium (HR = 0.35), and serum sodium (HR = 0.91). The developed risk score demonstrated strong predictive performance and effectively stratified patients into risk categories.
Conclusion: We developed a validated clinical risk score integrating age, serum albumin, potassium, and sodium levels to predict mortality in hospitalized elderly COVID-19 patients. This scoring system enables early risk stratification, assisting clinicians in decision-making and optimizing patient management.
Keywords: albumin; clinical risk score; death risk; electrolyte levels; hospitalized elder patients with COVID-19.
© 2025 Wang et al.
Conflict of interest statement
The authors have no competing Interest to declare in this work.
Figures
Similar articles
-
Development and Validation of a Clinical Risk Score to Predict the Occurrence of Critical Illness in Hospitalized Patients With COVID-19.JAMA Intern Med. 2020 Aug 1;180(8):1081-1089. doi: 10.1001/jamainternmed.2020.2033. JAMA Intern Med. 2020. PMID: 32396163 Free PMC article.
-
A Clinical Risk Score to Predict In-hospital Mortality from COVID-19 in South Korea.J Korean Med Sci. 2021 Apr 19;36(15):e108. doi: 10.3346/jkms.2021.36.e108. J Korean Med Sci. 2021. PMID: 33876588 Free PMC article.
-
Development and evaluation of a machine learning-based in-hospital COVID-19 disease outcome predictor (CODOP): A multicontinental retrospective study.Elife. 2022 May 17;11:e75985. doi: 10.7554/eLife.75985. Elife. 2022. PMID: 35579324 Free PMC article.
-
Effectiveness of azvudine against severe outcomes among hospitalized COVID-19 patients in Xinjiang, China: a single-center, retrospective, matched cohort study.Expert Rev Anti Infect Ther. 2024 Jul;22(7):569-577. doi: 10.1080/14787210.2024.2362900. Epub 2024 Jun 27. Expert Rev Anti Infect Ther. 2024. PMID: 38822541
-
External validation of six COVID-19 prognostic models for predicting mortality risk in older populations in a hospital, primary care, and nursing home setting.J Clin Epidemiol. 2024 Apr;168:111270. doi: 10.1016/j.jclinepi.2024.111270. Epub 2024 Feb 2. J Clin Epidemiol. 2024. PMID: 38311188
References
-
- World Health Organization. WHO Coronavirus Disease (COVID-19) dashboard. Available from: https://covid19.who.int/. Accessed April 9, 2025.
LinkOut - more resources
Full Text Sources
Miscellaneous
