Study of a Nanostructured Co-Doped SnO2 Sensor for Hydrogen Peroxide Vapor Detection Using Impedance Spectroscopy
- PMID: 40256500
- PMCID: PMC12004179
- DOI: 10.1021/acsomega.5c00917
Study of a Nanostructured Co-Doped SnO2 Sensor for Hydrogen Peroxide Vapor Detection Using Impedance Spectroscopy
Abstract
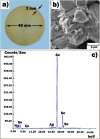
A hydrogen peroxide vapor (HPV) sensor based on SnO2 doped with 1.3 at. % Co thin film has been fabricated using the high-frequency magnetron sputtering method. The thickness of the SnO2 ⟨Co⟩ thin film was measured and the surface morphology was examined using the thickness measurement profilometer and scanning electron microscopy, respectively. The crystalline properties of the sensing material were revealed by transmission electron microscopy. The response, current-voltage, and impedance characteristics of the sensor were measured in the air and in the presence of various concentrations of HPV at 25-200 °C. An equivalent electrical circuit for the manufactured sensor structure was proposed, and the parameters of its constituent elements were determined. Furthermore, fitting frequency dependences of impedance were calculated. It was shown that charge transfer in the SnO2 ⟨Co⟩ thin film was regulated by the processes mainly occurring at the grain boundaries of the gas-sensing film.
© 2025 The Authors. Published by American Chemical Society.
Conflict of interest statement
The authors declare no competing financial interest.
Figures


Similar articles
-
Room Temperature Detection of Hydrogen Peroxide Vapor by Fe2O3:ZnO Nanograins.Nanomaterials (Basel). 2022 Dec 26;13(1):120. doi: 10.3390/nano13010120. Nanomaterials (Basel). 2022. PMID: 36616029 Free PMC article.
-
Effect of thickness on nanostructured SnO2 thin films by spray pyrolysis as highly sensitive H2S gas sensor.J Nanosci Nanotechnol. 2012 Aug;12(8):6192-201. doi: 10.1166/jnn.2012.6424. J Nanosci Nanotechnol. 2012. PMID: 22962726
-
Quantitative SEM characterisation of ceramic target prior and after magnetron sputtering: a case study of aluminium zinc oxide.J Microsc. 2021 Mar;281(3):190-201. doi: 10.1111/jmi.12961. Epub 2020 Sep 28. J Microsc. 2021. PMID: 32926411 Free PMC article.
-
Electrolytically exfoliated graphene-loaded flame-made Ni-doped SnO2 composite film for acetone sensing.ACS Appl Mater Interfaces. 2015 Feb 11;7(5):3077-92. doi: 10.1021/acsami.5b00161. Epub 2015 Jan 29. ACS Appl Mater Interfaces. 2015. PMID: 25602118
-
Ultralow detection limit and ultrafast response/recovery of the H2 gas sensor based on Pd-doped rGO/ZnO-SnO2 from hydrothermal synthesis.Microsyst Nanoeng. 2022 Jun 16;8:67. doi: 10.1038/s41378-022-00398-8. eCollection 2022. Microsyst Nanoeng. 2022. PMID: 35721374 Free PMC article.
References
-
- Moseley P. T. Progress in the Development of Semiconducting Metal Oxide Gas Sensors: A Review. Meas. Sci. Technol. 2017, 28, 082001.10.1088/1361-6501/aa7443. - DOI
-
- Malik R.; Tomer V. K.; Mishra Y. K.; Lin L. Functional Gas Sensing Nanomaterials: A Panoramic View. Appl. Phys. Rev. 2020, 7 (2), 021301.10.1063/1.5123479. - DOI
-
- Yang B.; Myung N. V.; Tran T.-T. 1D Metal Oxide Semiconductor Materials for Chemiresistive Gas Sensors: A Review. Adv. Electron. Mater. 2021, 7 (9), 2100271.10.1002/aelm.202100271. - DOI
LinkOut - more resources
Full Text Sources
