. 2025 Apr 2;10(14):13860-13867.
doi: 10.1021/acsomega.4c07531. eCollection 2025 Apr 15.

Infrared Free-Electron Laser: A Versatile Molecular Cutter for Analyzing Solid-State Biomacromolecules

Affiliations

Infrared Free-Electron Laser: A Versatile Molecular Cutter for Analyzing Solid-State Biomacromolecules

Takayasu Kawasaki et al. ACS Omega. .

Abstract

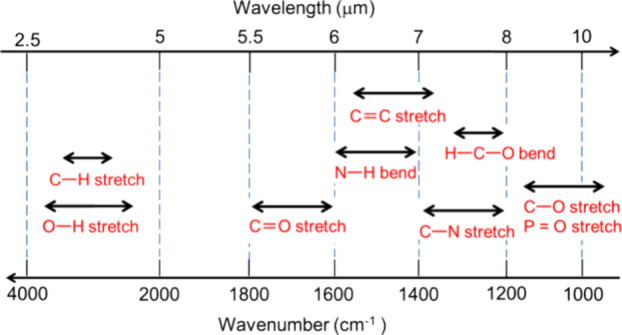
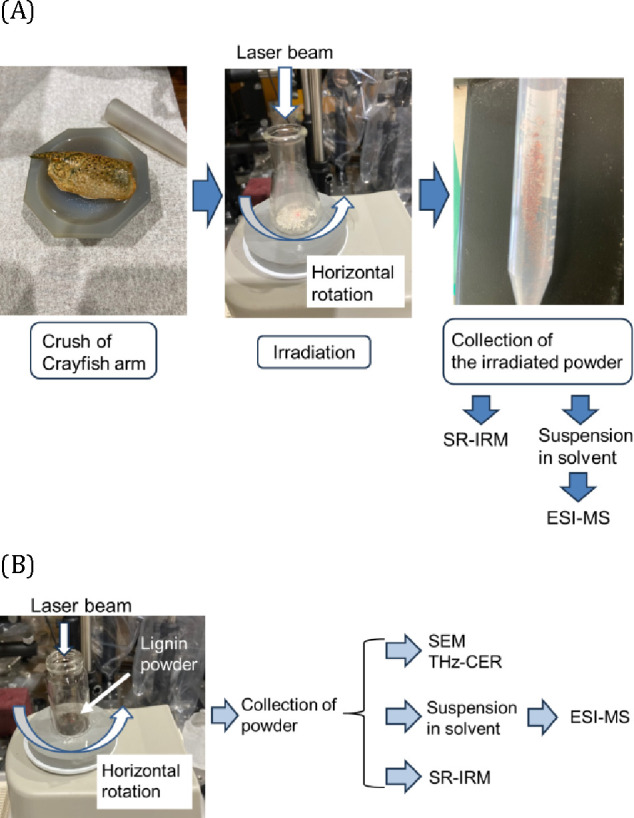
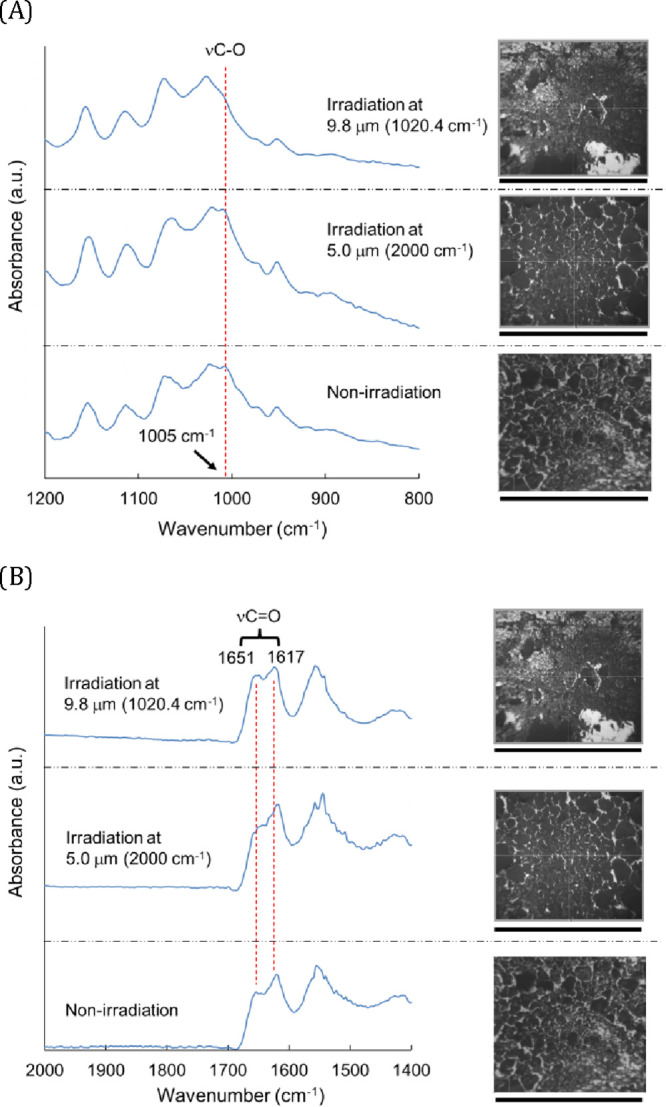
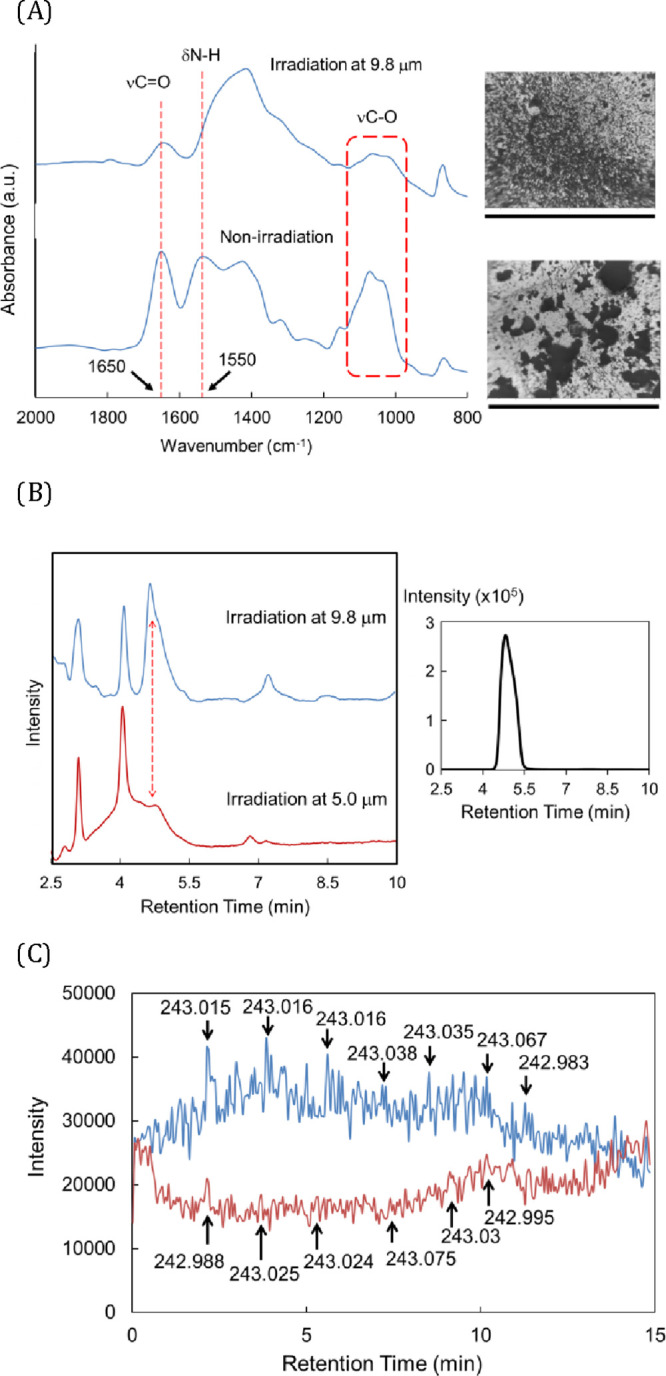
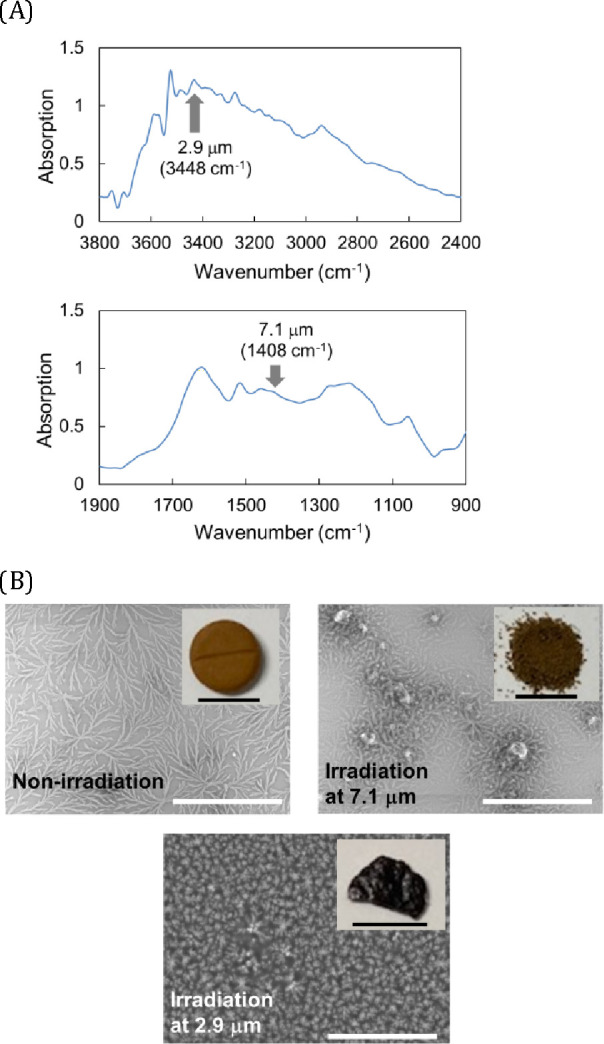
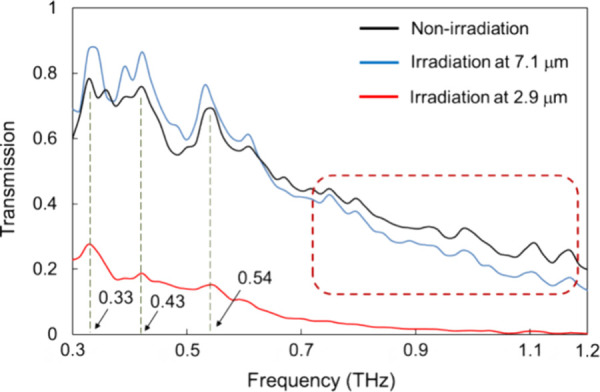
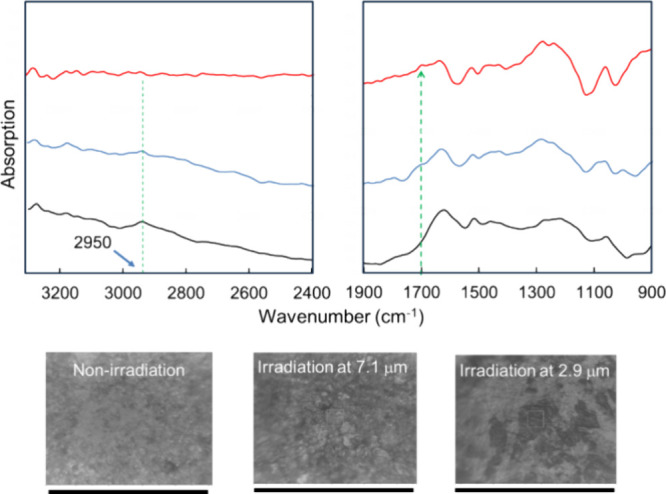
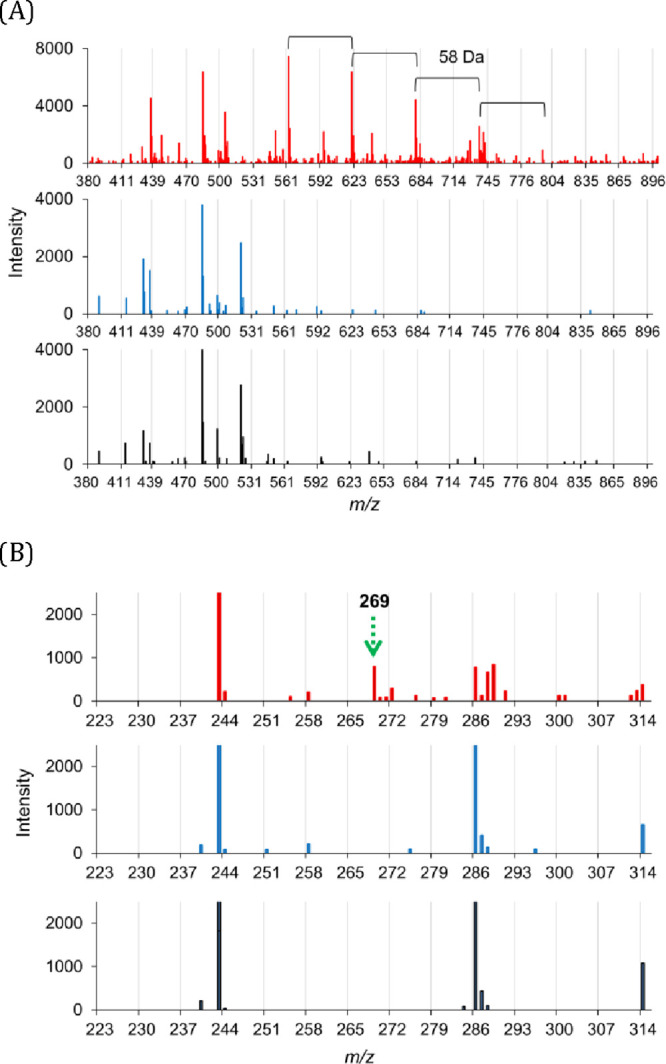
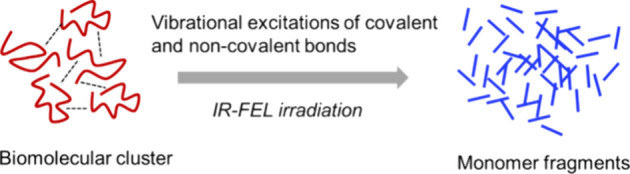
Free-electron lasers that oscillate in the infrared (IR) range of 1000 (10 μm) to 4000 cm-1 (2.5 μm) were applied to irradiate solid-phase polysaccharides and aromatic biomacromolecules. Synchrotron radiation IR microscopy (SR-IRM) and electrospray ionization mass spectroscopy (ESI-MS) analyses showed that N-acetyl glucosamine was isolated from the powdered exoskeleton of crayfish by irradiation at 1020 cm-1 (9.8 μm), resonating with the C-O stretching mode (νC-O). Irradiation at 3448 cm-1 (2.9 μm), which is resonant with the O-H stretching vibration (νO-H) of sulfonated lignin, dissociates the aggregate state and releases coniferyl aldehyde substituted with sulfinate, as shown by scanning electron microscopy, terahertz-coherent edge radiation spectroscopy, SR-IRM, and ESI-MS. These vibrational excitation reactions proceed at room temperature in the absence of solvent. Current and previous studies have demonstrated that intense IR lasers can be used as versatile tools for unveiling the internal structures of persistent biomacromolecules.


Conflict of interest statement

The authors declare no competing financial interest.

Figures

Figure 1
Figure 1
Various vibrational modes in the near- and mid-IR region from 1000 to 4000 cm–1 (below) and 2.5 to 10 μm (upper).
Figure 2
Figure 2
IR-FEL oscillation system. The system consists of three major parts: a linear accelerator, periodic magnetic field, and optical cavity. The IR-FEL beamline was transported through a reflective mirror to the laboratory in the experimental room.
Figure 3
Figure 3
Experimental scheme from sample preparation to structural analysis. (A) Crayfish arms. (B) SL.
Figure 4
Figure 4
Irradiation effect of IR-FEL on chitin. (A) SR-IRM spectra of chitin before (bottom) and after irradiations at 9.8 μm (top) and 5.0 μm (middle) from 800 to 1200 cm–1. The photographs on the right show microscopic images of the measurement area on the sample surface. Black bar: 1 mm. (B) SR-IRM spectra of chitin before (bottom) and after irradiations at 9.8 (upper) and 5.0 μm (middle) from 1400 to 2000 cm–1. Photographs on the right are the same as those in (A).
Figure 5
Figure 5
Irradiation effect of IR-FEL on outer shells of crayfish. (A) SR-IRM spectra of outer shell of crayfish before (bottom) and after irradiation at 9.8 μm (upper) from 800 to 2000 cm–1. The photographs on the right show microscopic images of the measurement area on the sample surface. Black bar: 1 mm. (B) Liquid chromatography (LC) profiles of the outer shells of crayfish after IR-FEL irradiation (left panel) and N-acetyl glucosamine treatment alone (right panel). (C) ESI-MS chromatograms of 243 Da after irradiations at 9.8 μm (blue) and 5.0 μm (red).
Figure 6
Figure 6
Effect of IR-FEL irradiation on SL. (A) SR-IRM spectra before irradiation at 900–1900 (bottom) and 2400–3800 cm–1 (upper). The gray arrows indicate the irradiation wavelengths. (B) SEM images before (upper left) and after irradiations at 7.1 (upper right) and 2.9 μm (below). The small photograph on the right edge of each image shows the optical microscopy image of the lignin sample. White bar: 30 μm; black bar: 1 cm.
Figure 7
Figure 7
THz-CER spectra of SL from 0.3 to 1.2 THz before (black) and after irradiations at 7.1 (blue) and 2.9 μm (red).
Figure 8
Figure 8
SR-IRM spectra of SL from 900 to 3300 cm–1 before (black) and after irradiations at 7.1 (blue) and 2.9 μm (red). Microscopy images of the measurement area of the sample surface are shown along the bottom. Black bar: 1 mm.
Figure 9
Figure 9
(A) ESI-MS profiles of SL in the high-molecular-weight range of 380–896 m/z before (black) and after irradiations at 7.1 μm (blue) and 2.9 μm (red). (B) ESI-MS profiles in the low-molecular-weight range of 223–314 m/z before (black) and after irradiations at 7.1 (blue) and 2.9 μm (red).
Figure 10
Figure 10
IR-FEL mediates the decomposition of biomolecular clusters into their monomeric forms. Biomolecular clusters were formed by covalent and noncovalent bonds (blue dotted lines). The aggregate structure can be dissociated into a nonaggregate state, and the covalent bonds can be cleaved to produce fragmented monomers by IR-FEL irradiation at specific absorption wavelengths.

Similar articles

References

    1. Edwards N. P.; Barden H. E.; van Dongen B. E.; Manning P. L.; Larson P. L.; Bergmann U.; Sellers W. I.; Wogelius R. A. Infrared mapping resolves soft tissue preservation in 50 million year-old reptile skin. Proc. Biol. Sci. 2011, 278 (1722), 3209–18. 10.1098/rspb.2011.0135. - DOI - PMC - PubMed
    1. Song C.; Fan W. H.; Ding L.; Chen X.; Chen Z. Y.; Wang K. Terahertz and infrared characteristic absorption spectra of aqueous glucose and fructose solutions. Sci. Rep. 2018, 8 (1), 8964.10.1038/s41598-018-27310-7. - DOI - PMC - PubMed
    1. Mann D.; Höweler U.; Kötting C.; Gerwert K. Elucidation of Single Hydrogen Bonds in GTPases via Experimental and Theoretical Infrared Spectroscopy. Biophys. J. 2017, 112 (1), 66–77. 10.1016/j.bpj.2016.11.3195. - DOI - PMC - PubMed
    1. Meizyte G.; Brown R. H.; Brewer E. I.; Watson P. D.; Mackenzie S. R. A Combined Infrared and Computational Study of Gas-Phase Mixed-Ligand Rhodium Complexes: Rh(CO)n(N2O)m+ (n = 1–5, m = 1–4). J. Phys. Chem. A 2023, 127 (44), 9220–9228. 10.1021/acs.jpca.3c05078. - DOI - PMC - PubMed
    1. Wang H.; Seemakurthi R. R.; Chen G. F.; Strauss V.; Savateev O.; Hai G.; Ding L.; López N.; Wang H.; Antonietti M. Laser-induced nitrogen fixation. Nat. Commun. 2023, 14 (1), 5668.10.1038/s41467-023-41441-0. - DOI - PMC - PubMed

LinkOut - more resources