

Integrated multi-omics analysis reveals the functional and prognostic significance of lactylation-related gene PRDX1 in breast cancer
- PMID: 40256656
- PMCID: PMC12006012
- DOI: 10.3389/fmolb.2025.1580622
Integrated multi-omics analysis reveals the functional and prognostic significance of lactylation-related gene PRDX1 in breast cancer
Abstract
Background: Breast cancer (BRCA) is a significant threat to women's health worldwide, and its progression is closely associated with the tumor microenvironment and gene regulation. Lactylation modification, as a key epigenetic mechanism in cancer biology, has not yet been fully elucidated in the context of BRCA. This study examines the regulatory mechanisms of lactylation-related genes (LRGs), specifically PRDX1, and their prognostic significance in BRCA.
Methods: We integrated data from multiple databases, including Genome-Wide Association Study (GWAS) summary statistics, single-cell RNA sequencing, spatial transcriptomics, and bulk RNA sequencing data from The Cancer Genome Atlas (TCGA) and Gene Expression Omnibus (GEO) databases. Using Summary-based Mendelian Randomization (SMR) analysis, we identified LRGs associated with BRCA and comprehensively analysed the expression patterns of PRDX1, cell-cell communication networks, and spatial heterogeneity. Furthermore, we constructed and validated a prognostic model based on the gene expression profile of PRDX1-positive monocytes, evaluating it through Cox regression and LASSO regression analyses.
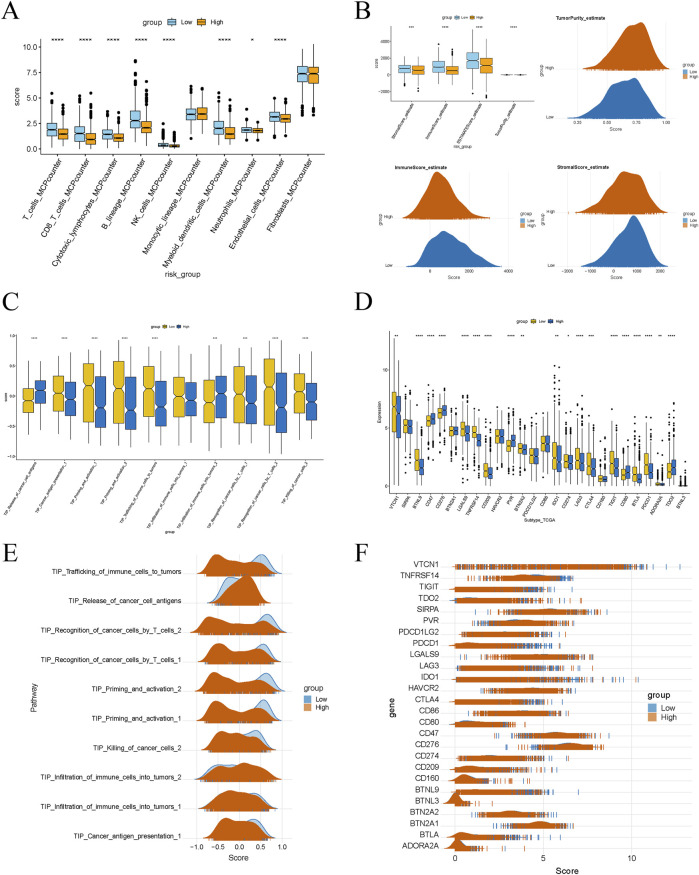
Results: PRDX1 was identified as a key LRG significantly associated with BRCA risk (p_SMR = 0.0026). Single-cell RNA sequencing analysis revealed a significant upregulation of PRDX1 expression in monocytes, with enhanced cell-cell communication between PRDX1-positive monocytes and fibroblasts. Spatial transcriptomics analysis uncovered heterogeneous expression of PRDX1 in the tumor nest regions, highlighting the spatial interaction between PRDX1-positive monocytes and fibroblasts. The prognostic model constructed based on the gene expression profile of PRDX1-positive monocytes demonstrated high accuracy in predicting patient survival in both the training and validation cohorts. High-risk patients exhibited immune-suppressive microenvironment characteristics, including reduced immune cell infiltration and upregulation of immune checkpoint gene expression.
Conclusion: This study reveals the key role of PRDX1 in BRCA progression, mainly through the regulation of the tumor microenvironment and immune escape mechanisms. The survival prediction model based on PRDX1 shows robust prognostic potential, and future research should focus on integrating PRDX1 with other biomarkers to enhance the precision of personalised medicine.
Keywords: PRDX1; breast cancer; lactylation; prognostic model; spatial transcriptomics.
Copyright © 2025 Wu, Cao, Jin, Ma, Niu, Yu, Wang and Xia.
Conflict of interest statement
The authors declare that the research was conducted in the absence of any commercial or financial relationships that could be construed as a potential conflict of interest.
Figures


Similar articles
-
Comprehensive single-cell and bulk transcriptomic analyses to develop an NK cell-derived gene signature for prognostic assessment and precision medicine in breast cancer.Front Immunol. 2024 Oct 23;15:1460607. doi: 10.3389/fimmu.2024.1460607. eCollection 2024. Front Immunol. 2024. PMID: 39507529 Free PMC article.
-
Novel lactylation-related signature to predict prognosis for pancreatic adenocarcinoma.World J Gastroenterol. 2024 May 21;30(19):2575-2602. doi: 10.3748/wjg.v30.i19.2575. World J Gastroenterol. 2024. PMID: 38817665 Free PMC article.
-
Deciphering the role of acetylation-related gene NAT10 in colon cancer progression and immune evasion: implications for overcoming drug resistance.Discov Oncol. 2025 May 15;16(1):774. doi: 10.1007/s12672-025-02617-w. Discov Oncol. 2025. PMID: 40374962 Free PMC article.
-
Spatial and single-cell explorations uncover prognostic significance and immunological functions of mitochondrial calcium uniporter in breast cancer.Cancer Cell Int. 2024 Apr 17;24(1):140. doi: 10.1186/s12935-024-03327-z. Cancer Cell Int. 2024. PMID: 38632642 Free PMC article.
-
Identification of a lactylation-related gene signature to characterize subtypes of hepatocellular carcinoma using bulk sequencing data.J Gastrointest Oncol. 2024 Aug 31;15(4):1636-1646. doi: 10.21037/jgo-24-405. Epub 2024 Aug 14. J Gastrointest Oncol. 2024. PMID: 39279958 Free PMC article.
References
LinkOut - more resources
Full Text Sources
Miscellaneous