

Understanding trends in Zostera research, stressors, and response variables: a global systematic review of the seagrass genus
- PMID: 40256742
- PMCID: PMC12009562
- DOI: 10.7717/peerj.19209
Understanding trends in Zostera research, stressors, and response variables: a global systematic review of the seagrass genus
Abstract
Background: Seagrass meadows are ecologically significant habitats that are globally threatened. Thus, there is increased interest in conservation of seagrasses as they face widespread decline. Biotic and abiotic factors that influence seagrass can be classified as stressors, such as rising temperature and eutrophication. Our study met an imminent need to consolidate data from previous studies to discern knowledge gaps and identify trends in studies, stressors, species, and geographic origination of research for the genus Zostera. For our systematic review, the objectives were to (A) qualitatively assess and summarize the current state of literature focused on seagrass species within the Zostera genus and their stressors; (B) utilize data extracted from full-text articles to identify trends and knowledge gaps for the study of stressors, response variable measurements, species, geography, and study designs; and (C) map the distribution, type, and number of these studies globally.
Methodology: We included articles that focused on stressors associated with Zostera seagrass species, and excluded studies of other seagrasses and non-stressor related articles. We conducted a Web of Science search of all databases, concluding in January of 2021, followed by a standardized review and data extraction protocol using Colandr (colandrapp.com) as our article screening tool. All 15 review participants were trained on the same set of practice articles and decision trees to minimize variation between individuals. After full text extraction, we analyzed our data by frequency and association between species, stressors, and geographic locations studied.
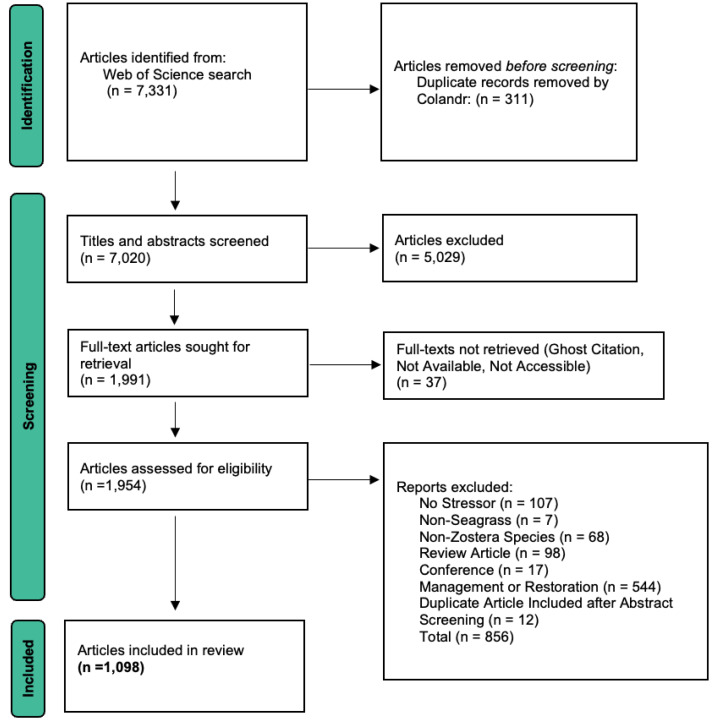
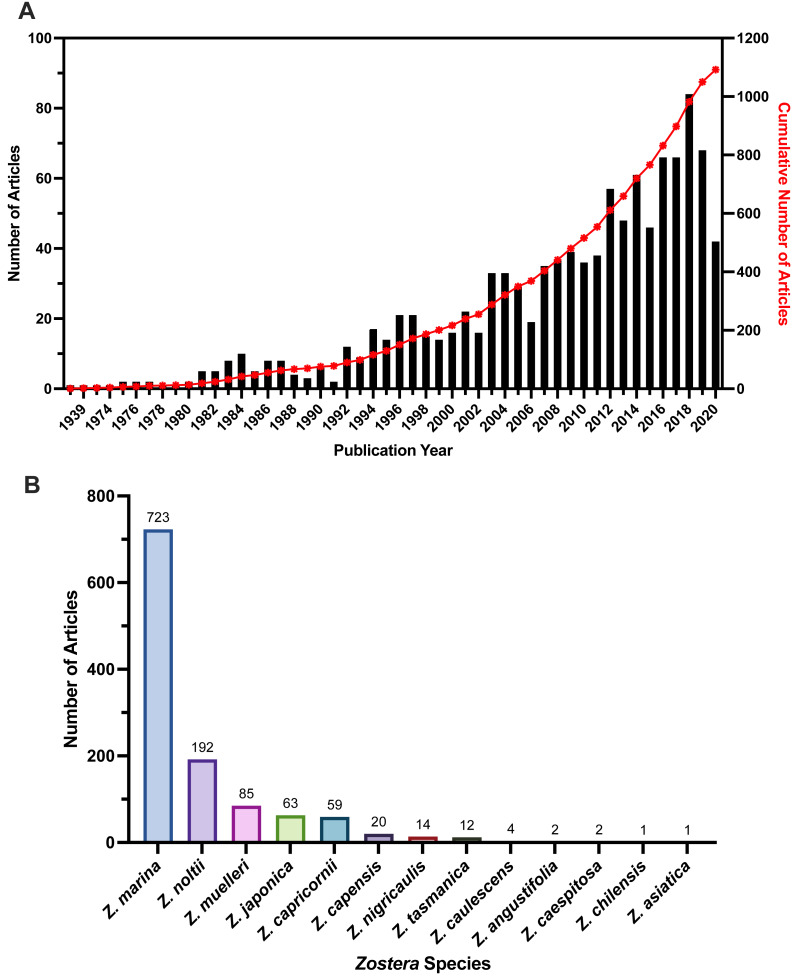
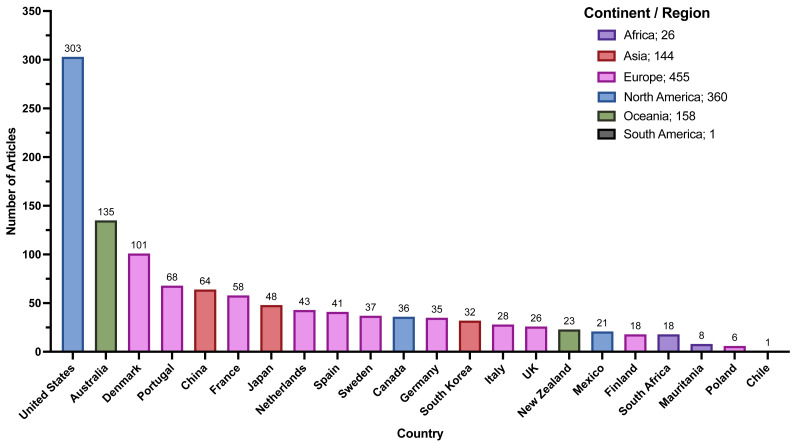
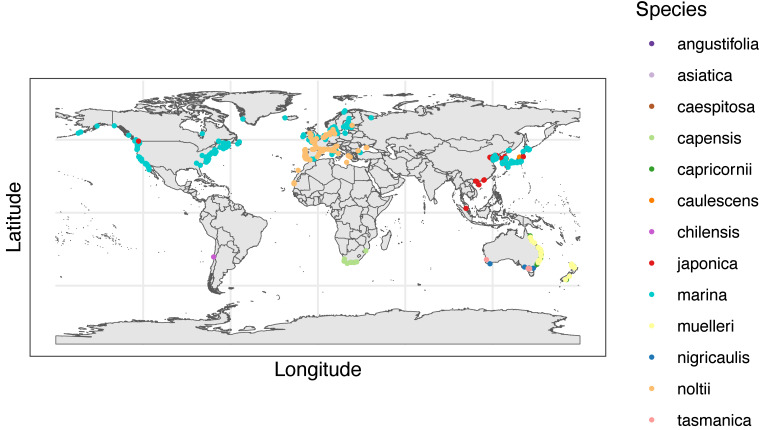
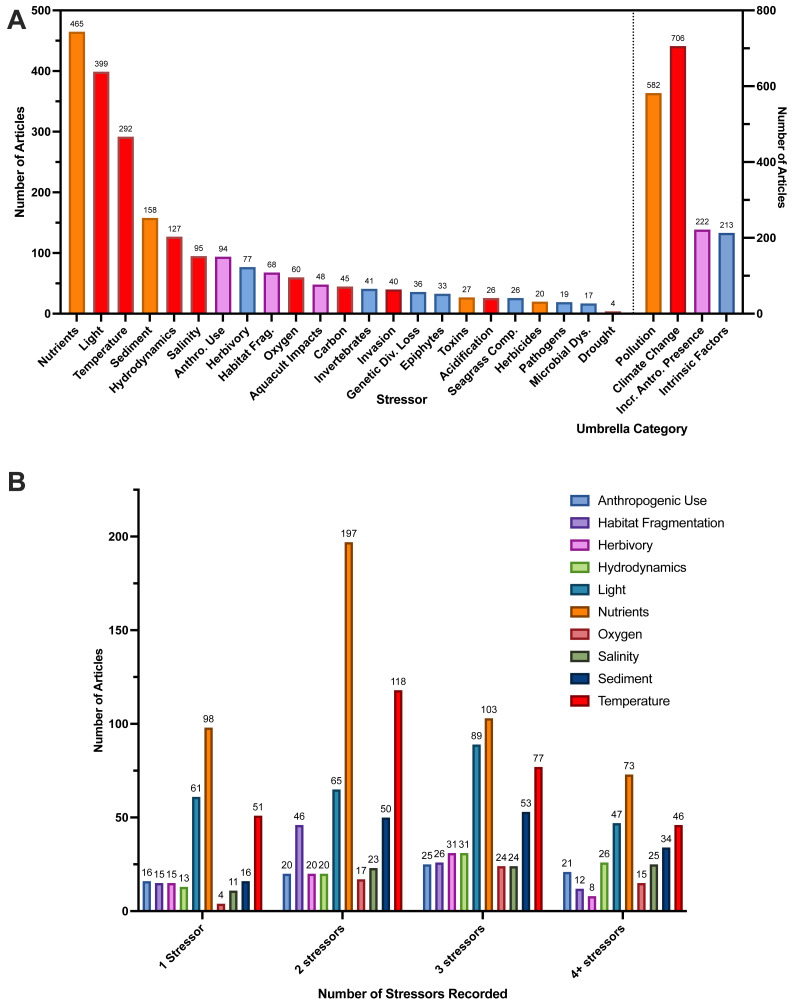
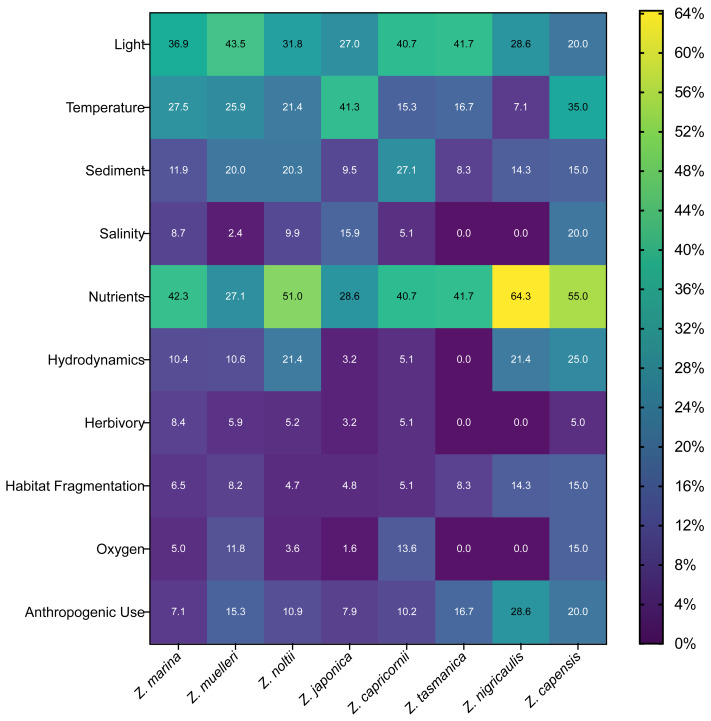
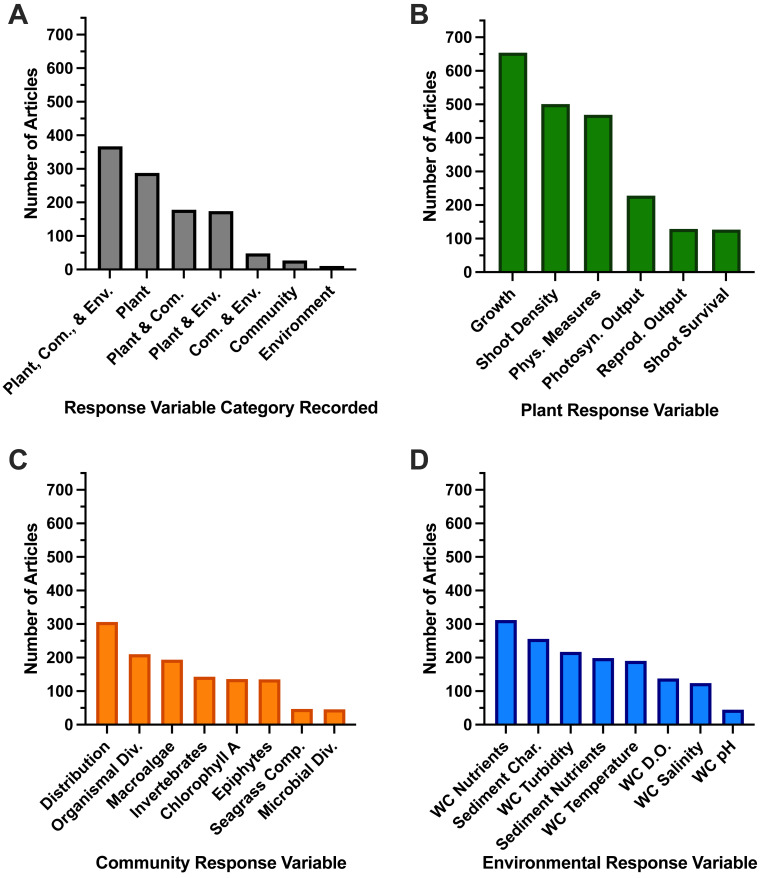
Results: We screened 7,331 titles and abstracts and extracted data from 1,098 full-text articles. We found nutrients, temperature, and light were the most studied stressors. The United States of America produced the most articles in our review, followed by Australia. Zostera marina was most frequently studied, and our review found no stressor studies for five species in the genus. Studies most frequently measured response variables across multiple levels of ecological organization, including the individual plant, biotic community, and environmental conditions. As a part of our review, we made all extracted data publicly available as an interactive map.
Conclusion: Undertaking a review of global studies allowed us to assess more seagrass articles for a single genus than any prior systematic review, summarizing a breadth of stressor studies related to the Zostera genus. A team effort and standardized training minimized bias during screening and data extraction. Evidence limitations may exist due to the single database used in our search protocol, as well as species, geographic, and stressor biases in included studies. Our review creates a centralized knowledge base that serves as a foundational information source for Zostera research, while highlighting existing knowledge gaps in the literature.
Keywords: Coastal ecosystem; Global; Response variables; Seagrass; Stressors; Systematic review; Zostera.
©2025 Lyford et al.
Conflict of interest statement
The authors declare there are no competing interests.
Figures
Similar articles
-
Review of nitrogen and phosphorus metabolism in seagrasses.J Exp Mar Biol Ecol. 2000 Jul 30;250(1-2):133-167. doi: 10.1016/s0022-0981(00)00195-7. J Exp Mar Biol Ecol. 2000. PMID: 10969167
-
Eutrophication overrides warming as a stressor for a temperate African seagrass (Zostera capensis).PLoS One. 2019 Apr 11;14(4):e0215129. doi: 10.1371/journal.pone.0215129. eCollection 2019. PLoS One. 2019. PMID: 30973955 Free PMC article.
-
Global Diversity and Biogeography of the Zostera marina Mycobiome.Appl Environ Microbiol. 2021 May 26;87(12):e0279520. doi: 10.1128/AEM.02795-20. Epub 2021 May 26. Appl Environ Microbiol. 2021. PMID: 33837008 Free PMC article.
-
Trends in seagrass research in the 21st century - are we there yet?Mar Environ Res. 2025 Aug;209:107198. doi: 10.1016/j.marenvres.2025.107198. Epub 2025 Apr 29. Mar Environ Res. 2025. PMID: 40334330 Review.
-
Seagrasses in an era of ocean warming: a review.Biol Rev Camb Philos Soc. 2021 Oct;96(5):2009-2030. doi: 10.1111/brv.12736. Epub 2021 May 20. Biol Rev Camb Philos Soc. 2021. PMID: 34014018 Review.
References
-
- Adams JB. Distribution and status of Zostera capensis in South African estuaries—a review. South African Journal of Botany. 2016;107:63–73. doi: 10.1016/j.sajb.2016.07.007. - DOI
-
- Adams MP, Koh EJ, Vilas MP, Collier CJ, Lambert VM, Sisson SA, Quiroz M, McDonald-Madden E, McKenzie LJ, O’Brien KR. Predicting seagrass decline due to cumulative stressors. Environmental Modelling & Software. 2020;130:104717. doi: 10.1016/j.envsoft.2020.104717. - DOI
-
- Atkinson LZ, Cipriani A. How to carry out a literature search for a systematic review: a practical guide. BJPsych Advances. 2018;24(2):74–82. doi: 10.1192/bja.2017.3. - DOI
-
- Barbier EB, Hacker SD, Kennedy C, Koch EW, Stier AC, Silliman BR. The value of estuarine and coastal ecosystem services. Ecological Monographs. 2011;81(2):169–193. doi: 10.1890/10-1510.1. - DOI
-
- Beng KC, Corlett RT. Applications of environmental DNA (eDNA) in ecology and conservation: opportunities, challenges and prospects. Biodiversity and Conservation. 2020;29:2089–2121. doi: 10.1007/s10531-020-01980-0. - DOI
Further reading
-
- BioRender figures Created with BioRender.com. 2022. https://www.biorender.com https://www.biorender.com
-
- Flourish Figures created with https://flourish.studio 2023.
Publication types
MeSH terms
LinkOut - more resources
Full Text Sources
Research Materials
Miscellaneous
