. 2025 Apr 4:13:1557021.
doi: 10.3389/fbioe.2025.1557021. eCollection 2025.

Autofluorescence lifetime imaging classifies human B and NK cell activation state

Affiliations

Autofluorescence lifetime imaging classifies human B and NK cell activation state

Rebecca L Schmitz et al. Front Bioeng Biotechnol. .

Abstract

New non-destructive tools with single-cell resolution are needed to reliably assess B cell and NK cell function for applications including adoptive cell therapy and immune profiling. Optical metabolic imaging (OMI) is a label-free method that measures the autofluorescence intensity and lifetime of the metabolic cofactors NAD(P)H and FAD to quantify metabolism at a single-cell level. Here, we demonstrate that OMI can resolve metabolic changes between primary human quiescent and IL-4/anti-CD40 activated B cells and between quiescent and IL-12/IL-15/IL-18 activated NK cells. We found that stimulated B and NK cells had an increased proportion of free compared to protein-bound NAD(P)H, a reduced redox state, and produced more lactate compared to control cells. The NAD(P)H mean fluorescence lifetime decreased in the stimulated B and NK cells compared to control cells. Random forest models classified B cells and NK cells according to activation state (CD69+) based on OMI variables with an accuracy of 93%. Our results show that autofluorescence lifetime imaging can accurately assess B and NK cell activation in a label-free, non-destructive manner.

Keywords: B cells; Immune activation; NK cells; autofluorescence; imaging.


Conflict of interest statement

Some authors are listed as inventors on patent applications related to this work filed by Wisconsin Alumni Research Foundation. CMC received honorarium for advisory board membership with Bayer, Nektar Therapeutics and Novartis, and has ownership interest with Elephas for advisory board membership. MCS receives honorarium for advisory board membership with Elephas. These entities had no input in the study design, analysis, manuscript preparation or decision to submit for publication. The remaining authors declare that the research was conducted in the absence of any commercial or financial relationships that could be construed as a potential conflict of interest.

Figures

FIGURE 1
FIGURE 1
OMI is sensitive to metabolic changes between primary human B cells that are quiescent vs activated with IL-4 and anti-CD40. (A) B cells were isolated from human peripheral blood of three different donors (A-C) and stimulated for 72 h with 5 μg/mL anti-CD40 and 20 ng/mL IL-4 or cultured in just Advanced RPMI-1640 + 5%FBS media (control). Media samples were collected after 72 h of culture. (B) IL-6 concentration was measured from media samples of two different donors cultured in stimulated or control conditions for 72 h. (C) Glucose in the media of stimulated B cells was significantly decreased compared to the control cell media after 72 h of culture. (D) Lactate levels in stimulated B cell media were significantly higher than lactate levels in the control B cell media. (E) Representative images of NAD(P)H τm, FAD τm, redox ratio, and anti-CD69 staining in the control and stimulated conditions. (F) Redox ratio normalized to the mean of the quiescent group for each donor significantly increased in activated B cells (CD69+ in stimulated media) compared to quiescent B cells (CD69in control media). (G, H) NAD(P)H τm significantly decreased and NAD(P)H α1 significantly increased in the activated B cells compared to the quiescent B cells. (I) A significant decrease in FAD τm was observed in the activated B cells compared to quiescent B cells. In F-I, data are displayed as box-and-whisker plots, representing the median and interquartile range (IQR), with whiskers at 1.5*IQR Glass’s Delta measure of effect size given for Δ. Plots are overlaid with data points; each point represents 1 cell, color coded by donor (A–C). n = 1,210 cells (461 activated B cells, 749 quiescent B cells). *P<0.05, **** P < 0.0001, two-tailed unpaired T-test.
FIGURE 2
FIGURE 2
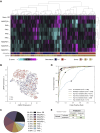
OMI characterizes single cell heterogeneity and accurately classifies activated from quiescent B cells. (A) Heatmap of single-cell OMI variables across all B cell experiments. Hierarchical cell clustering was calculated based on the z-scores (the difference between cell mean and population mean divided by the population standard deviation) for nine OMI variables (NAD(P)H τm, τ1, τ2, α1; FAD τm, τ1, τ2, α1; and quiescent-normalized optical redox ratio). Activated B cells cluster separately from quiescent B cells regardless of donor. (B) UMAP of nine OMI variables visualizes separation between clusters of activated and quiescent B cells. (C) Pie chart of the relative weight of the nine OMI variables included in the “all variables” random forest classifier. (D) Receiver operating characteristic (ROC) curve of random forest classifiers trained on different combinations of OMI variables to classify quiescent and activated B cells, with operating points indicated. “Top variables” classifiers refer to the largest weighted variables in the “all variable” classifier, found in (C). The classifiers using all the variables or only the NAD(P)H variables (NAD(P)H τm, τ1, τ2, α1) performed best (AUC 0.98), followed by the classifier that used the top four OMI variables (AUC 0.97), three of which are NADH(P)H lifetime variables. (E) Confusion matrix of the nine OMI variables random forest classifier shows performance for classification of activated and quiescent B cells with an accuracy score of 0.934. n = 1,210 cells (461 activated B cells, 749 quiescent B cells) with a 70/30 split for training and test sets.
FIGURE 3
FIGURE 3
OMI is sensitive to metabolic changes between primary human NK cells that are quiescent vs activated with IL-12, IL-15, and IL-18. (A) NK cells were isolated from human peripheral blood of three different donors (D-F) and stimulated for 24 h with 10 ng/mL IL-12, 50 ng/mL IL-15, and 50 ng/mL IL-18 or cultured in just TheraPeak X-VIVO-10 medium+10% human serum AB+ 1 ng/mL IL-15 (control). (B) IFN-γ concentration was measured from media samples of two different donors cultured in stimulated or control conditions for 24 h. (C) Glucose in the media of stimulated NK cells was significantly decreased compared to the control cell media after 24 h of culture. (D) Lactate levels in stimulated B cell media were significantly higher than lactate levels in the control cell media. (E) Representative images of NAD(P)H τm, FAD τm, redox ratio, and anti-CD69 staining in the control and stimulated conditions. (F) Redox ratio normalized to the mean of the quiescent group for each donor significantly increased in activated (CD69+ in stimulated media) NK cells compared to quiescent (CD69in control media) NK cells. (G, H) NAD(P)H τm significantly decreased and NAD(P)H α1 significantly increased in the activated NK cells compared to the quiescent NK cells. (I) No change in FAD τm was observed in the activated NK cells compared to quiescent NK cells. In (F–I), data are displayed as box-and-whisker plots, representing the median and interquartile range (IQR), with whiskers at 1.5*IQR. Glass’s Delta measure of effect size given for Δ. Plots are overlaid with data points; each point represents 1 cell, color coded by donor (D–F). n = 1,221 cells (554 activated NK cells, 667 control NK cells). **P<0.01, **** P < 0.0001, two-tailed unpaired T-test. ns = not significant.
FIGURE 4
FIGURE 4
OMI characterizes single cell heterogeneity and accurately classifies activated from quiescent NK cells. (A) Heatmap of single-cell OMI variables across all NK cell experiments. Hierarchical cell clustering was calculated based on the z-scores (the difference between cell mean and population mean divided by the population standard deviation) of nine OMI variables (NAD(P)H τm, τ1, τ2, α1; FAD τm, τ1, τ2, α1; and quiescent-normalized optical redox ratio). (B) UMAP of nine OMI variables displays clustering of activated and quiescent NK cells. (C) Pie chart of the relative weight of the nine OMI variables included in the “all variables” random forest classifier. (D) Receiver operating characteristic (ROC) curve of random forest classifiers trained on different combinations of OMI variables to classify quiescent and activated NK cells, with operating points indicated. “Top variables” classifiers refer to the largest weighted variables in the “all variable” classifier, found in (C). The classifier using the top four OMI variables performed the best (AUC 0.97), followed by the classifier that used all nine OMI variables (AUC 0.96) and the classifier that used only NAD(P)H lifetime variables (NAD(P)H τm, τ1, τ2, α1) (AUC 0.96). (E) Confusion matrix of the nine OMI variables random forest classifier shows performance for classification of activated and quiescent NK cells with an accuracy score of 0.926. n = 1,221 cells (554 activated NK cells, 667 quiescent NK cells) with a 70/30 split for training and test sets.

Update of

References

    1. Akkaya M., Kwak K., Pierce S. K. (2020). B cell memory: building two walls of protection against pathogens. Nat. Rev. Immunol. 20 (4), 229–238. 10.1038/s41577-019-0244-2 - DOI - PMC - PubMed
    1. Alfonso-García A., Smith T. D., Datta R., Luu T. U., Gratton E., Potma E. O., et al. (2016). Label-free identification of macrophage phenotype by fluorescence lifetime imaging microscopy. J. Biomed. Opt. 21 (4), 46005. 10.1117/1.JBO.21.4.046005 - DOI - PMC - PubMed
    1. Assmann N., O’Brien K. L., Donnelly R. P., Dyck L., Zaiatz-Bittencourt V., Loftus R. M., et al. (2017). Srebp-controlled glucose metabolism is essential for NK cell functional responses. Nat. Immunol. 18 (11), 1197–1206. 10.1038/ni.3838 - DOI - PubMed
    1. Bonilla F. A., Oettgen H. C. (2010). Adaptive immunity. J. Allergy Clin. Immunol. 125 (2 Suppl. 2), S33–S40. 10.1016/j.jaci.2009.09.017 - DOI - PubMed
    1. Boonyaratanakornkit J., Taylor J. J. (2019). Techniques to study antigen-specific B cell responses. Front. Immunol. 10, 1694. 10.3389/fimmu.2019.01694 - DOI - PMC - PubMed

LinkOut - more resources