. 2025 Apr;28(4):e70115.
doi: 10.1111/ele.70115.

The Release of Non-Native Gamebirds Is Associated With Amplified Zoonotic Disease Risk

Affiliations

The Release of Non-Native Gamebirds Is Associated With Amplified Zoonotic Disease Risk

Emile Michels et al. Ecol Lett. 2025 Apr.

Abstract

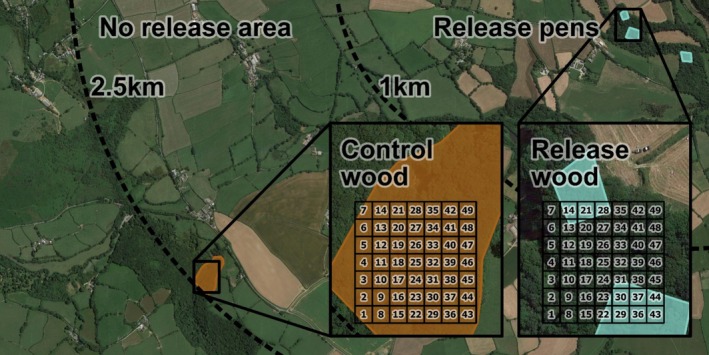
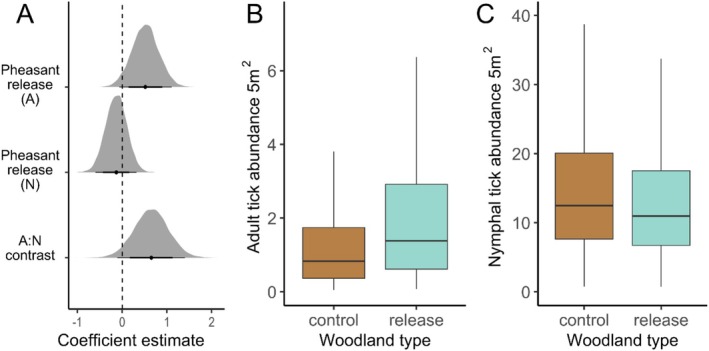
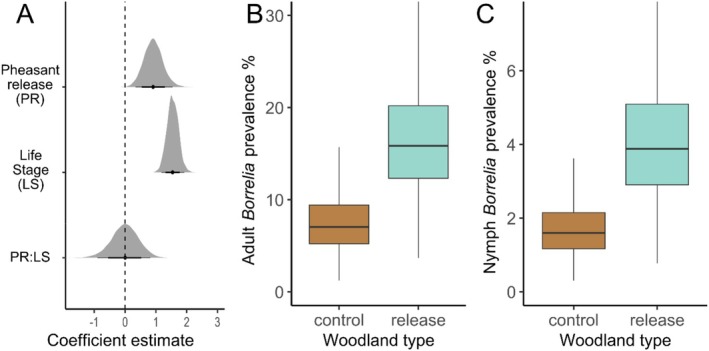
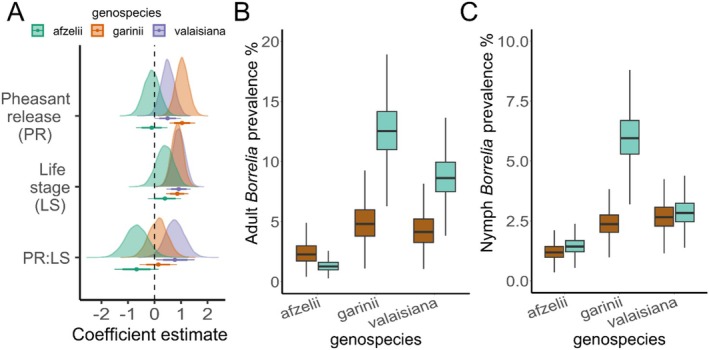
Spillback-where non-native species increase native pathogen prevalence-is potentially an important mechanism by which non-natives contribute to zoonotic disease emergence. However, spillback has not yet been directly demonstrated because it is difficult to disentangle from confounding factors which correlate with non-native species abundance and native pathogen prevalence. Here, we capitalise on replicated, quasi-experimental releases of non-native pheasants (Phasianus colchicus) to compare vector abundance and native pathogen prevalence between sites with similar local conditions but different non-native densities. Prevalence of Borrelia spp. (the causative agent of Lyme disease) in questing ticks was almost 2.5x higher in woods where pheasants are released compared to control woods, with a particularly strong effect on Borrelia garinii, a bird specialist genospecies. Furthermore, adult (but not nymphal) ticks tended to be more abundant at pheasant-release woods. This work provides evidence that non-native species can impact zoonotic pathogen prevalence via spillback in ecologically relevant contexts.

Keywords: Borrelia burgdorferi sensu lato; environmental change; invasive species; one health; spillover; zoonosis.


Conflict of interest statement

The authors declare no conflicts of interest.

Figures

FIGURE 1
FIGURE 1
An aerial map of a representative pheasant shoot. Small blue compartments show the area outline of release pens. 1 km and 2.5 km perimeters are drawn around each release pen. Between the two perimeters is a ‘no pheasant release’ area, within which a control wood is highlighted in brown. Inset maps show zoomed in views of a release and a control wood with a 7 × 7‐cell sampling grid overlaid.
FIGURE 2
FIGURE 2
(A) Posterior distributions outlining the effect of pheasant‐release on Ixodes ricinus abundance, derived by comparing I. ricinus abundances between woods where pheasants are released and control woods where no pheasants are released. From top to bottom, the effect of pheasant‐release on adult tick abundance, the effect of pheasant‐release on nymphal tick abundance and, the difference between the effect of pheasant‐release on nymphs and adults. Black points correspond to the means of posterior distributions and horizontal lines represent 79% and 95% highest probability density intervals. For the upper and middle rows, positive values indicate higher abundance at woods where pheasants are released. (B, C) Predicted abundance of I. ricinus adults (B) and nymphs (C) collected at woods where no pheasants are released (brown boxes) and woods where pheasants are released (blue boxes). Central horizontal lines represent posterior distribution means, boxes and vertical lines encompass all predictions within one and two standard deviations of the mean, respectively. Predictions are conditional on random effects and ecological variables being held at mean values (for more information see Results S1).
FIGURE 3
FIGURE 3
(A) Posterior distributions (from top to bottom) for the average difference in Borrelia sp. prevalence in Ixodes ricinus ticks between woods where pheasants are or are not released (pheasant‐release, PR). Positive values indicate higher prevalence in release woods. The difference in Borrelia sp. prevalence between nymphs and adults (LS), positive values indicate higher prevalence in adults. The difference between the effect of pheasant‐release (PR) on Borrelia sp. prevalence in nymphs and adults (LS). Black points correspond to the means of posterior distributions and horizontal lines represent 79% and 95% HPDI intervals. (B, C) Predicted Borrelia sp. prevalence in I. ricinus adults (B) and nymphs (C) collected at woods where no pheasants are released (brown boxes) and woods where pheasants are released (blue boxes). Central horizontal lines represent posterior distribution means, boxes and vertical lines encompass all predictions within one and two standard deviations of the mean, respectively. Predictions are conditional on random effects and ecological variables being held at mean values (for more information see Results S1). The predicted increase in the relative prevalence of Borrelia sp. infection, associated with pheasant release, is the same for adults and nymphs (2.45 times greater), but the absolute increase in prevalence differs between the two life stages.
FIGURE 4
FIGURE 4
(A) Posterior distributions (from top to bottom) for the difference in Borrelia prevalence in Ixodes ricinus ticks between woods where pheasants are or are not released (PR) for the three most common genospecies in our samples ( Borrelia garinii, B. afzelii, B. valaisiana ), positive values indicate higher prevalence at pheasant‐release woods. The difference in Borrelia prevalence between nymphs and adults (LS), positive values indicate higher prevalence in adults. The difference between the effect of pheasant‐release on Borrelia prevalence in nymphs and adults (PR:LS), positive and negative values indicate greater amplification in adults and nymphs, respectively. Coloured points correspond to the means of posterior distributions and horizontal lines represent 79% and 95% highest probability density intervals. Summaries of posterior distributions and pairwise contrasts are presented in Tables S1 and S2. (B, C) Predicted maximum possible prevalence, for the three most common Borrelia genospecies in our sample ( B. garinii, B. afzelii, B. valaisiana ) in I. ricinus adults (B) and nymphs (C) collected at woods where no pheasants are released (brown boxes) and woods where pheasants are released (blue boxes). Central horizontal lines represent posterior distribution means, whilst boxes and vertical lines encompass all predictions within one and two standard deviations of the mean, respectively. Predictions are conditional on random effects and ecological variables being held at mean values (for more information see Results S1). The genospecies of 25 samples could not be resolved, due to co‐infection or low DNA quality, thus maximum possible prevalence values are approximate.

Similar articles

References

    1. Aebischer, N. J. 2019. “Fifty‐Year Trends in UK Hunting Bags of Birds and Mammals, and Calibrated Estimation of National bag Size, Using GWCT'S National Gamebag Census.” European Journal of Wildlife Research 65, no. 4: 64.
    1. Ayala, A. J. , Yabsley M. J., and Hernandez S. M.. 2020. “A Review of Pathogen Transmission at the Backyard Chicken–Wild Bird Interface.” Frontiers in Veterinary Science 7: 539925. 10.3389/fvets.2020.539925. - DOI - PMC - PubMed
    1. Baguette, M. , and Van Dyck H.. 2007. “Landscape Connectivity and Animal Behavior: Functional Grain as a Key Determinant for Dispersal.” Landscape Ecology 22: 1117–1129.
    1. Balmelli, T. , and Piffaretti J. C.. 1995. “Association Between Different Clinical Manifestations of Lyme Disease and Different Species of Borrelia burgdorferi Sensu Lato .” Research in Microbiology 146, no. 4: 329–340. 10.1016/0923-2508(96)81056-4. - DOI - PubMed
    1. Baranton, G. U. Y. , Postic D., Saint Girons I., et al. 1992. “Delineation of Borrelia Burgdorferi Sensu Stricto, Borrelia garinii sp. nov., and Group VS461 Associated With Lyme Borreliosis.” International Journal of Systematic and Evolutionary Microbiology 42, no. 3: 378–383. - PubMed

LinkOut - more resources