

EEG Spectral Exponents and Visual Chirp Responses Mirror Anti-Seizure Medication Load in Refractory Focal Epilepsy
- PMID: 40256879
- PMCID: PMC12172104
- DOI: 10.1002/acn3.70045
EEG Spectral Exponents and Visual Chirp Responses Mirror Anti-Seizure Medication Load in Refractory Focal Epilepsy
Abstract
Objective: Quantitative markers of cortical excitability may help identify responders to anti-seizure medications (ASMs). We studied the relationship between ASM load and two electroencephalography (EEG) markers of cortical excitability in people with refractory epilepsy.
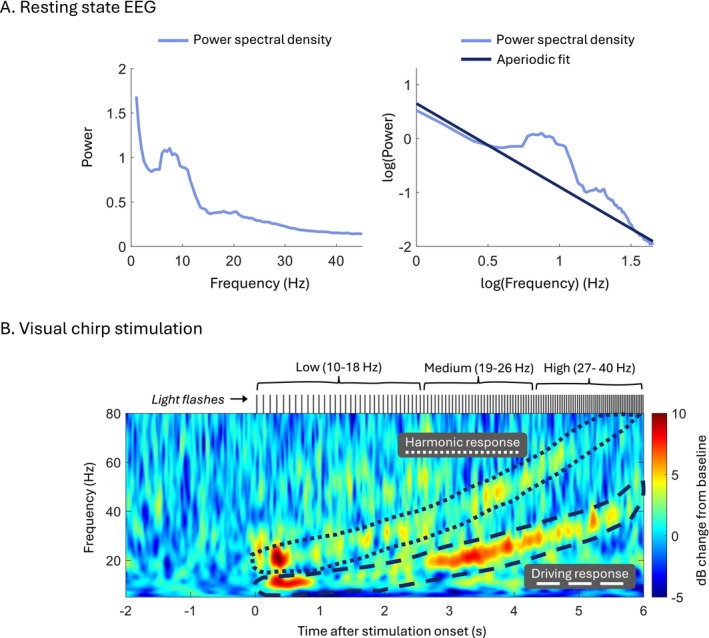
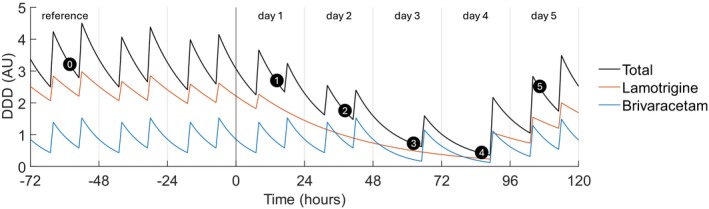
Methods: We included individuals with refractory focal epilepsy undergoing presurgical evaluation, involving ASM tapering and sleep deprivation. We obtained daily resting state EEG and EEG responses to visual stimulation at linearly increasing flash frequency (10-40 Hz chirp). We extracted the aperiodic exponent from resting state EEG power spectra and analysed chirp response at driving and second-order harmonic frequencies. We modelled ASM load, which we related to the EEG markers using linear mixed-effects regression.
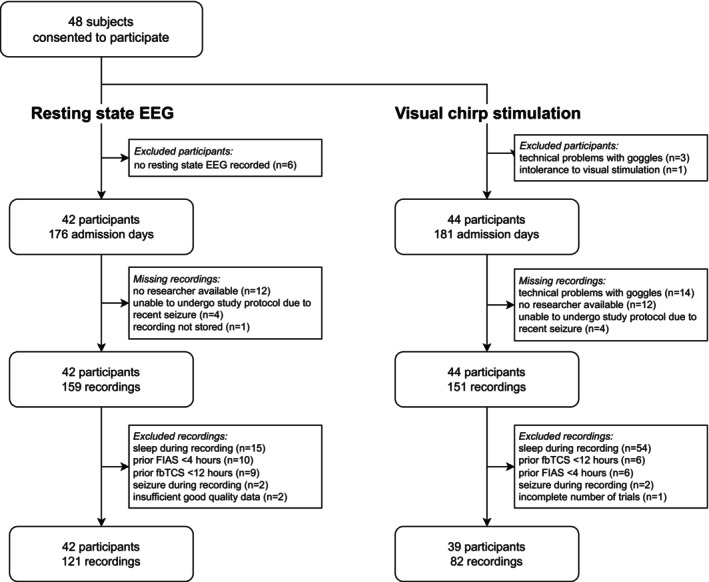
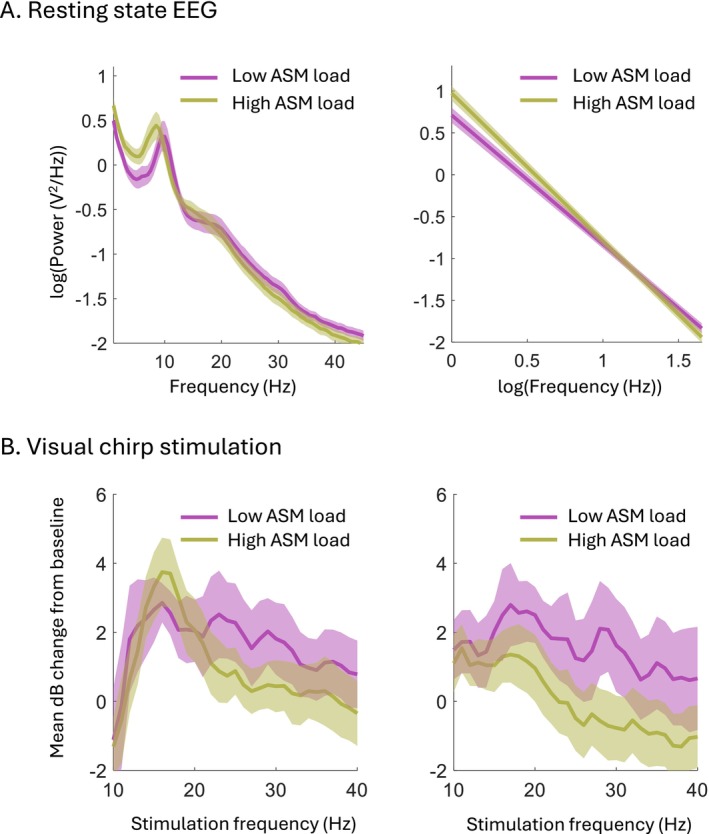
Results: Forty-eight subjects (median age 34 years, age range 16-62 years, 19 females) participated. The spectral exponent became less negative with ASM load reduction (p = 0.02), mainly attributable to reduced low-frequency power. Lowering ASM load increased the harmonic response to chirp stimulation (p = 0.004), also after accounting for sleep deprivation (p = 0.02), but did not affect the driving response. ASM tapering specifically increased harmonic responses to high stimulation frequencies (27-40 Hz, p = 0.01).
Interpretation: Resting state EEG spectral exponents and visual chirp responses reflect ASM load in refractory epilepsy. Low-frequency spectral changes in resting state EEG may only mirror ASM-induced spectral slowing. Visual chirp stimulation reveals enhanced harmonic EEG responses during low ASM loads, likely due to both increased high gamma activity and increased response to visual perturbations. Implementation of the markers would need normative values to reduce the delay to individually optimised treatment regimens.
Keywords: anti‐seizure medications; electroencephalography; photic stimulation; resting state EEG; spectral analysis.
© 2025 The Author(s). Annals of Clinical and Translational Neurology published by Wiley Periodicals LLC on behalf of American Neurological Association.
Conflict of interest statement
R.D.T. reports lecture and consultancy fees from Angelini, Eisai, LivAssured, UCB, Theravarance, Zogenix, Novartis, and Arvelle, and grants from EpilepsieNL, Michael J. Fox Foundation, and NewLife Wearables.
Figures
Similar articles
-
Cortical Excitability Before and After Long-Term Perampanel Treatment for Epilepsy.Ann Clin Transl Neurol. 2025 Jun;12(6):1256-1264. doi: 10.1002/acn3.70044. Epub 2025 Apr 17. Ann Clin Transl Neurol. 2025. PMID: 40244706 Free PMC article.
-
Population-based spectral characteristics of normal interictal scalp EEG inform diagnosis and treatment planning in focal epilepsy.Sci Rep. 2025 Jul 11;15(1):25147. doi: 10.1038/s41598-025-08871-w. Sci Rep. 2025. PMID: 40646034 Free PMC article.
-
Pro-ictal, rather than pre-ictal, brain state marked by global critical slowing and local gamma power increase.Clin Neurophysiol. 2025 Jul;175:2110742. doi: 10.1016/j.clinph.2025.2110742. Epub 2025 May 14. Clin Neurophysiol. 2025. PMID: 40479746
-
The Effectiveness of Cenobamate in Patients Treated With Vagus Nerve Stimulation for Drug Resistant Epilepsy.Eur J Neurol. 2025 Jun;32(6):e70229. doi: 10.1111/ene.70229. Eur J Neurol. 2025. PMID: 40536401 Free PMC article.
-
Association of social determinants of health with first antiseizure medication prescription for patients with newly diagnosed epilepsy: A systematic review and meta-analysis.Epilepsia. 2025 May;66(5):1560-1572. doi: 10.1111/epi.18277. Epub 2025 Jan 18. Epilepsia. 2025. PMID: 39825782
References
-
- Meisel C., Plenz D., Schulze‐Bonhage A., and Reichmann H., “Quantifying Antiepileptic Drug Effects Using Intrinsic Excitability Measures,” Epilepsia 57, no. 11 (2016): e210–e215. - PubMed
MeSH terms
Substances
Grants and funding
- 114025101/Health-Holland, Top Sector Life Sciences & Health, Netherlands Organization for Health Research and Development (ZonMW)
- The Christelijke Vereniging voor de Verpleging van Lijders aan Epilepsie
- 2022-10/The Dutch National Epilepsy Foundation
- the Medical Delta program "Medical NeuroDelta: Ambulant Neuromonitoring for Prevention and Treatment of Brain Disease"
- HORIZON project RELIEVE (grant ID 101099481)
LinkOut - more resources
Full Text Sources