. 2025 Apr 21;9(5):e0643.
doi: 10.1097/HC9.0000000000000643. eCollection 2025 May 1.

Single-cell landscape of peripheral immune cells in MASLD/MASH

Affiliations

Single-cell landscape of peripheral immune cells in MASLD/MASH

Agnes Anna Steixner-Kumar et al. Hepatol Commun. .

Abstract

Background: Metabolic dysfunction-associated steatotic liver disease (MASLD) progresses to metabolic dysfunction-associated steatohepatitis (MASH) and is a major cause of liver cirrhosis. Although liver inflammation is the hallmark feature of MASH versus MASLD, the involvement of the peripheral immune cell compartments in disease progression is poorly understood, and single-cell profiles of peripheral immune cells in MASLD/MASH are not known.

Methods: Patients with MASLD/MASH and healthy volunteers have been prospectively enrolled in a cross-sectional study. Patients have been histologically stratified and further characterized by liver bulk RNA sequencing (RNA-Seq). Peripheral immune cells from patients and control blood samples have been comprehensively profiled using bulk and single RNA-Seq.

Results: Twenty-two patients with fibrosis stage less than F3 have been histologically stratified into patients with low, medium, and high disease activity scores (NAFLD activity score [NAS]). In contrast to fibrosis, the NAS group correlated with noninvasive imaging readouts and blood biomarkers of liver damage and inflammation (ALT, AST). The prevalence of type 2 diabetes and obesity increased with the NAS stage. Bulk RNA-seq profiling of patient liver biopsies revealed gene signatures that were positively and negatively associated with NAS. Known marker genes for liver fibrosis where upregulated on RNA level. Blood bulk RNA-seq showed only moderate differences in patients versus healthy controls. In contrast, single-cell analysis of white blood cells revealed multiple alterations of immune (sub-)populations, including an increased abundance of immature B cells and myeloid suppressor cells in patients with MASLD/MASH as compared to healthy controls.

Conclusions: The study gives new insights into the pathophysiology of MASLD/MASH already manifesting relatively early in peripheral immune cell compartments. This opens new avenues for the development of new biomarker diagnostics and disease therapies.

Keywords: B cells; MASH; MASLD; blood; immature immune cells; immune cells; liver; myeloid-derived suppressor cells; neutrophils; scRNA-Seq.


Conflict of interest statement

Agnes Anna Steixner-Kumar, Alec Dick, Dennis Böttner, Diana Santacruz, Ehsan Bahrami, Eric Simon, George Okafo, Heike Neubauer, Markus Werner, Oliver Krenkel, Tobias Geiger, Werner Rust are employees of Boehringer Ingelheim. Boehringer Ingelheim is a research-oriented pharmaceutical company. The remaining authors have no conflicts of interest.

Figures

None
Graphical abstract
FIGURE 1
FIGURE 1
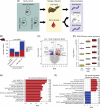
Differential expression and enrichment results from liver bulk RNAseq. (A) Study setup and data collection. (B) Number of up/downregulated DEG in a linear disease progression model (FDR<0.1, |beta|>1) and 2-group comparisons against patients with low NAS (p adj<0.05, |logFC|>0.25) (C) Volcano plot showing genes with a linear increase across MASLD severity. Significant genes with |beta|>5 are labeled. (D) MASLD and fibrosis biomarker expression increases with NAS (all FDR <0.1). (E) Significantly enriched hallmark gene sets (set size on the right) in the linear disease progression model ordered by p value. (F) Top 7 up/downregulated Reactome terms (set size on the right) in the linear disease progression model. Abbreviations: DEG, differentially expressed gene; MAFLD, metabolic-associated fatty liver disease; MASLD, metabolic-associated steatotic liver disease; MHC, major histocompatibility complex; NAS, NAFLD activity score; NES, normalized enrichment score.
FIGURE 2
FIGURE 2
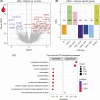
Differential expression and enrichment results from blood bulk RNAseq. (A) Volcano plot showing DEG in WBC RNAseq of patients versus controls. Significant genes with |logFC|>1 are labeled. (B) GSEA of cell type–specific genes in DE analysis comparing patients versus controls. Numbers indicate gene set sizes. **p adj<0.05, *p<0.05. (C) Top 10 biological processes in GO enrichment analysis of DE results (patients vs. controls). Abbreviations: GO, gene ontology; GSEA, gene-set enrichment analysis; NES, normalized enrichment score; WBC, white blood cell.
FIGURE 3
FIGURE 3
Whole blood single-cell atlas of patients with MASLD (n=9) and healthy controls (n=6). (A) Landscape of immune cell populations in the blood. (B) Differential abundance testing in healthy controls vs. patients across all cell types. (C) Deconvolution estimates of major immune cell populations from blood bulk RNAseq. All comparisons are nonsignificant (p>0.05, Welch test). (D) Cell populations associated with the patient (Scissor+ cells) or control status (Scissor−). Abbreviations: MASLD, metabolic-associated steatotic liver disease; NK, natural killer.
FIGURE 4
FIGURE 4
Neutrophil subpopulation shifts in healthy controls and patients with MASLD. (A) UMAP embedding showing subpopulations of neutrophils. (B) Distribution of cells from control and MASLD patient samples. (C) Differential abundance testing (cutoff ± 0.7) showing MASLD depleted/enriched subpopulations. (D) Projection of Scissor+ (MASLD-associated) and Scissor− (control-associated) cells as identified in Figure 3D onto subclustered neutrophil data. (E) Differential expression between Scissor+ (MASLD-associated) and Scissor− (control-associated) neutrophils. Abbreviations: MASLD, metabolic-associated steatotic liver disease; UMAP, Uniform Manifold Approximation and Projection.
FIGURE 5
FIGURE 5
CD14+ monocyte subpopulation shifts in healthy controls and MASLD. (A) UMAP embedding showing subpopulations of CD14+ monocytes. (B) Aggregated expression of HLA genes. (C) Distribution of cells from control and MASLD patient samples. (D) Differential abundance testing (cutoff ±0.7) showing MASLD depleted/enriched subpopulations. (E) Selection of MASLD-enriched subpopulation using Seurat CellSelector tool. (F) Volcano plot showing DEG between the MASLD-enriched subpopulation as selected in (E), characterized as MDSCs, and all other cells. Positive log2-fold changes indicate upregulation in the selected population. Genes with an|log2FC|>1 are labeled. (G) Volcano plot showing DEG between Scissor- and background CD14+ monocytes as identified in Figure 3D. Abbreviations: DEG, differentially expressed genes; HLA, human leukocyte antigen system; MASLD, metabolic-associated steatotic liver disease; MDSC, myeloid-derived suppressor cell; MHC, major histocompatibility complex; UMAP, Uniform Manifold Approximation and Projection.
FIGURE 6
FIGURE 6
B-cell subpopulation shifts in healthy controls and patients with MASLD. (A) UMAP embedding showing subpopulations of B cells and plasma cells. (B) Distribution of cells from control and MASLD patient samples. (C) Differential abundance testing (cutoff ±0.7) showing MASLD depleted/enriched subpopulations. (D) Trajectory analysis of the immature/naïve and naive B-cell populations. Inset shows the selected target population circled in red. (E) Average pseudotime of cells in the selected population comparing healthy controls and patients with MASLD. Welch t test applied. (F) Volcano plot showing DEG between naïve/immature and naive clusters. Positive log2-fold changes indicate upregulation in the naive/immature population. Genes with an|log2FC|>0.5 are labeled. Abbreviations: DEG, differentially expressed gene; MASLD, metabolic-associated steatotic liver disease; UMAP, Uniform Manifold Approximation and Projection.
FIGURE 7
FIGURE 7
T-cell subpopulation shifts in healthy controls and patients with MASLD. (A) UMAP embedding showing subpopulations of CD4+ T cells. (B) Distribution of CD4+ T cells from control and MASLD patient samples. (C) Differential abundance testing (cutoff ± 0.7) showing MASLD depleted/enriched CD4+ T-cell subpopulations. (D) UMAP embedding showing subpopulations of CD8+ T cells. (E) Distribution of CD8+ T cells from control and MASLD patient samples. (F) Differential abundance testing (cutoff ± 0.7) showing MASLD depleted/enriched CD8+ T-cell subpopulations. Abbreviations: MASLD, metabolic-associated steatotic liver disease; UMAP, Uniform Manifold Approximation and Projection.

References

    1. Younossi ZM, Blissett D, Blissett R, Henry L, Stepanova M, Younossi Y, et al. . The economic and clinical burden of nonalcoholic fatty liver disease in the United States and Europe. Hepatology. 2016;64:1577–1586. - PubMed
    1. Rinella ME, Lazarus JV, Ratziu V, Francque SM, Sanyal AJ, Kanwal F, et al. . A multisociety Delphi consensus statement on new fatty liver disease nomenclature. Hepatology. 2023;78:1966–1986. - PMC - PubMed
    1. Simon TG, Roelstraete B, Khalili H, Hagström H, Ludvigsson JF. Mortality in biopsy-confirmed nonalcoholic fatty liver disease: Results from a nationwide cohort. Gut. 2021;70:1375–1382. - PMC - PubMed
    1. Harrison SA, Taub R. A phase 3 trial of resmetirom in NASH with liver fibrosis. N Engl J Med. 2024;390:1632–1633. - PubMed
    1. Huby T, Gautier EL. Immune cell-mediated features of non-alcoholic steatohepatitis. Nat Rev Immunol. 2022;22:429–443. - PMC - PubMed

MeSH terms