. 2025 May 27;44(5):115597.
doi: 10.1016/j.celrep.2025.115597. Epub 2025 Apr 20.

Requirements for the neurodevelopmental disorder-associated gene ZNF292 in human cortical interneuron development and function

Affiliations

Requirements for the neurodevelopmental disorder-associated gene ZNF292 in human cortical interneuron development and function

Komal Kaushik et al. Cell Rep. .

Abstract

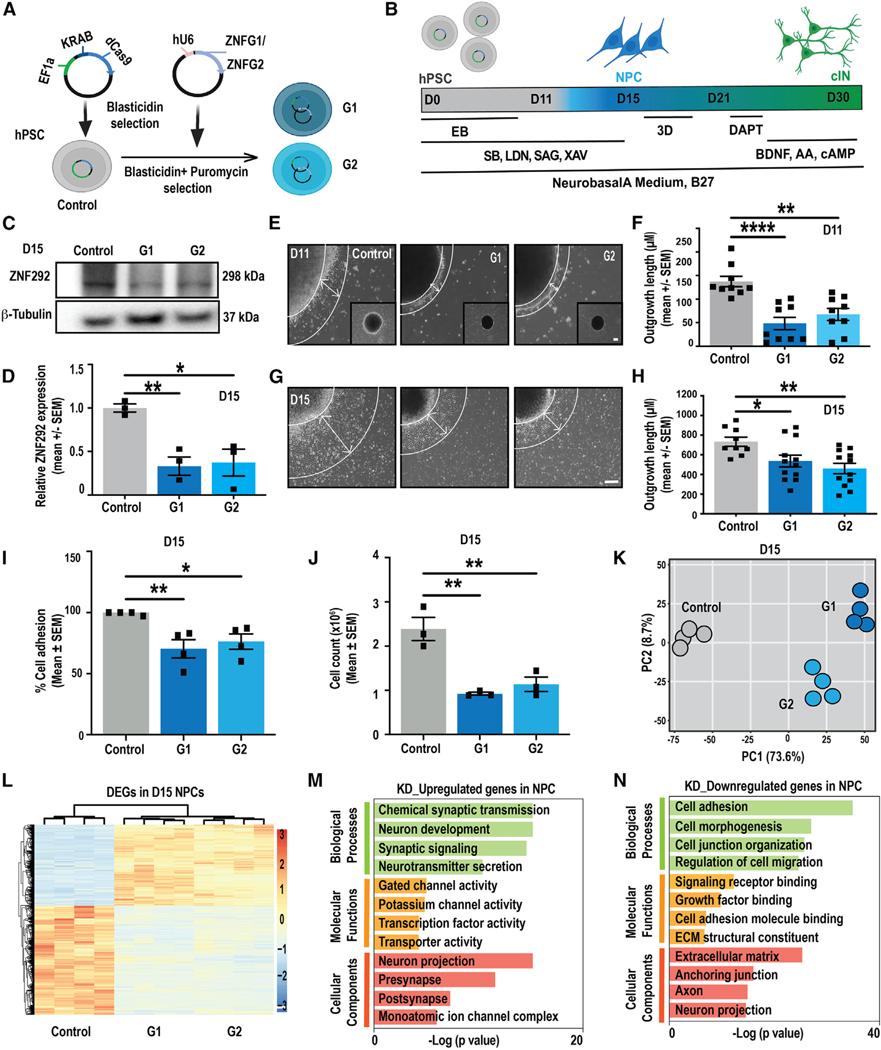
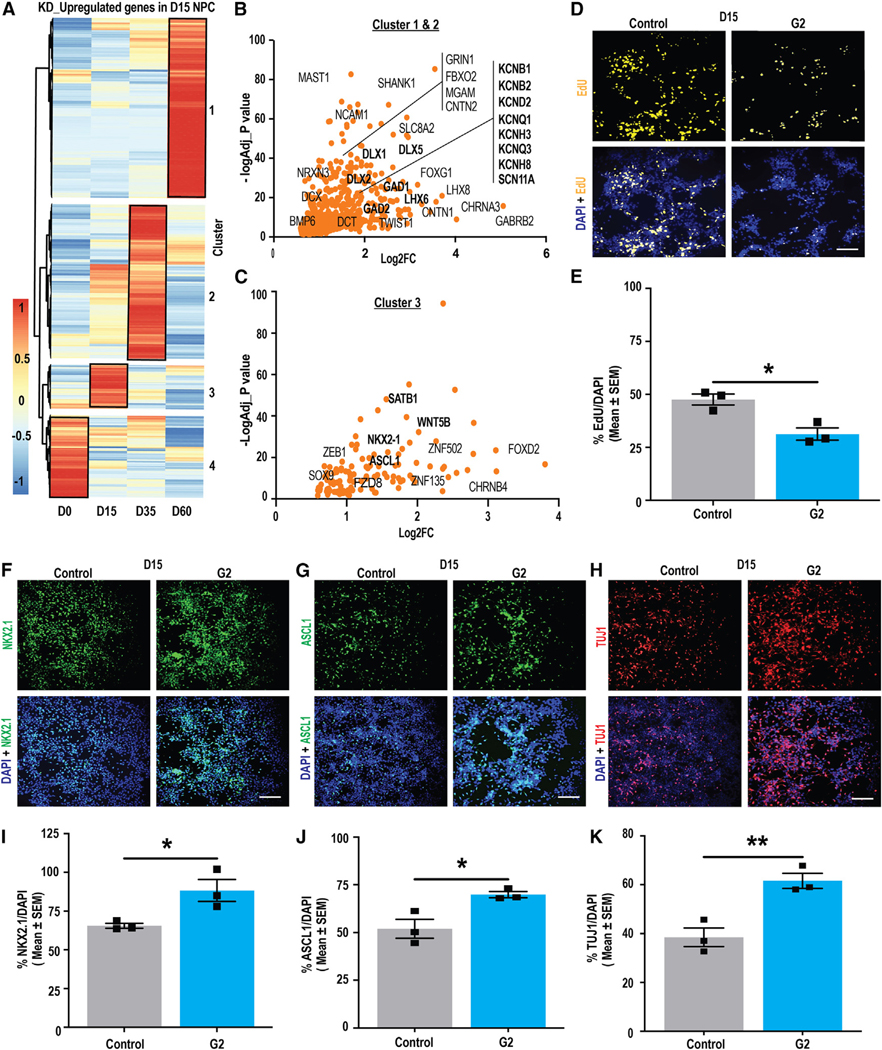
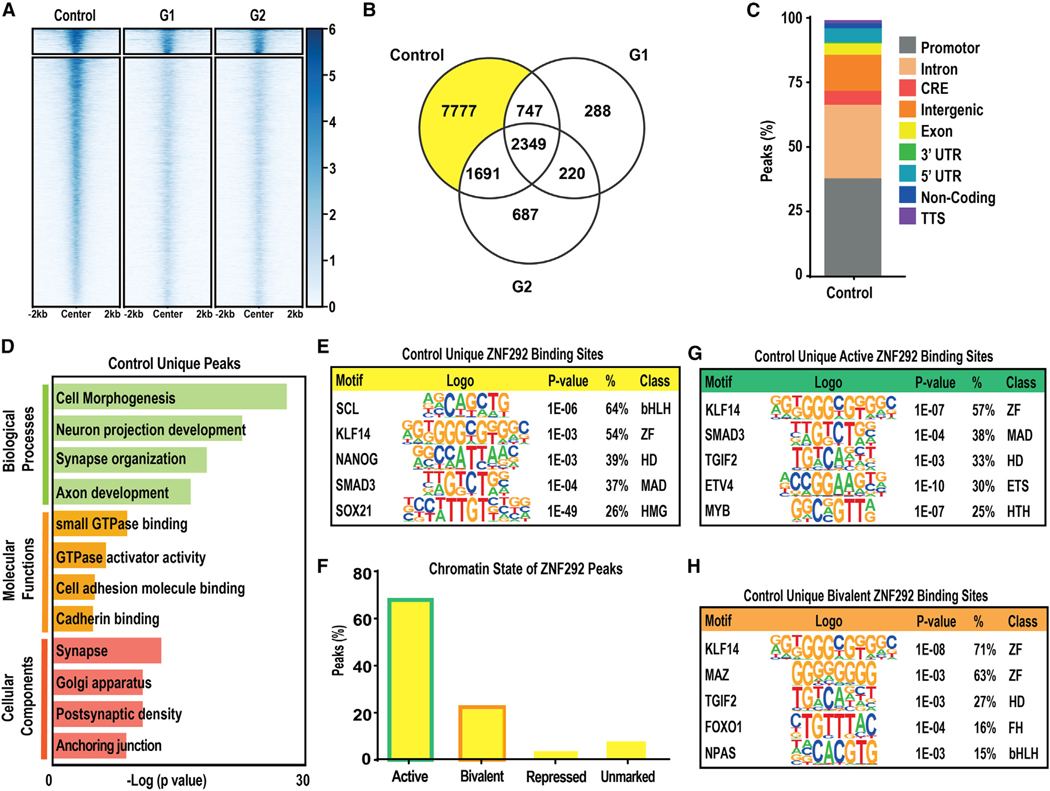
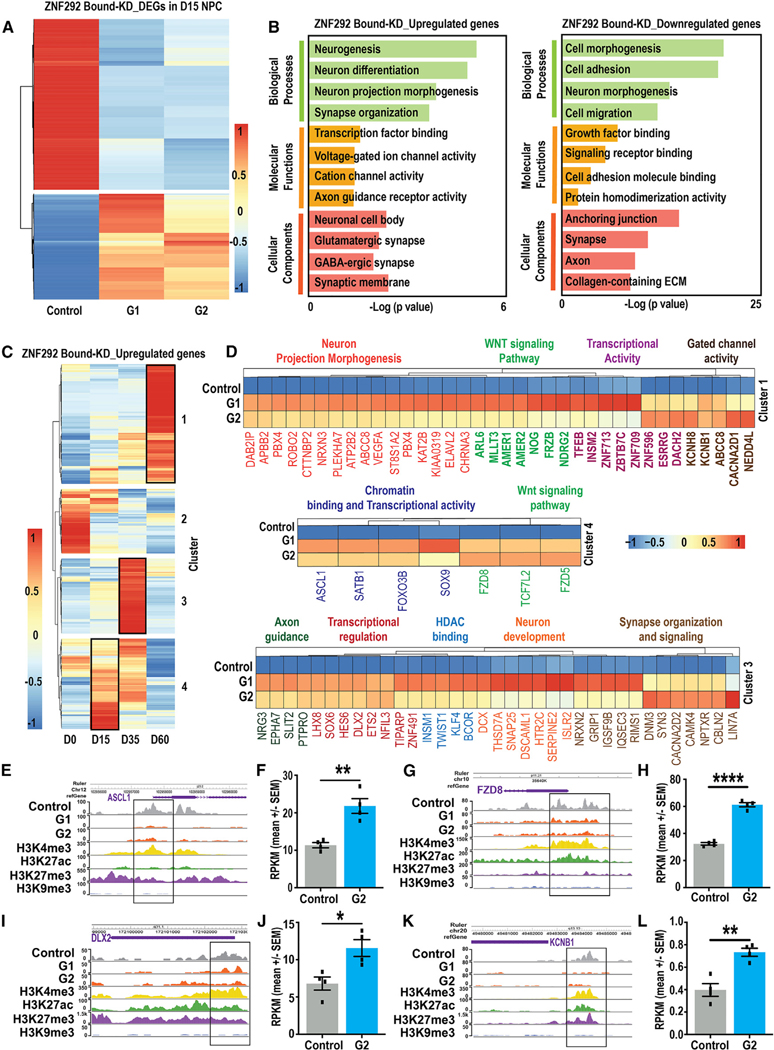
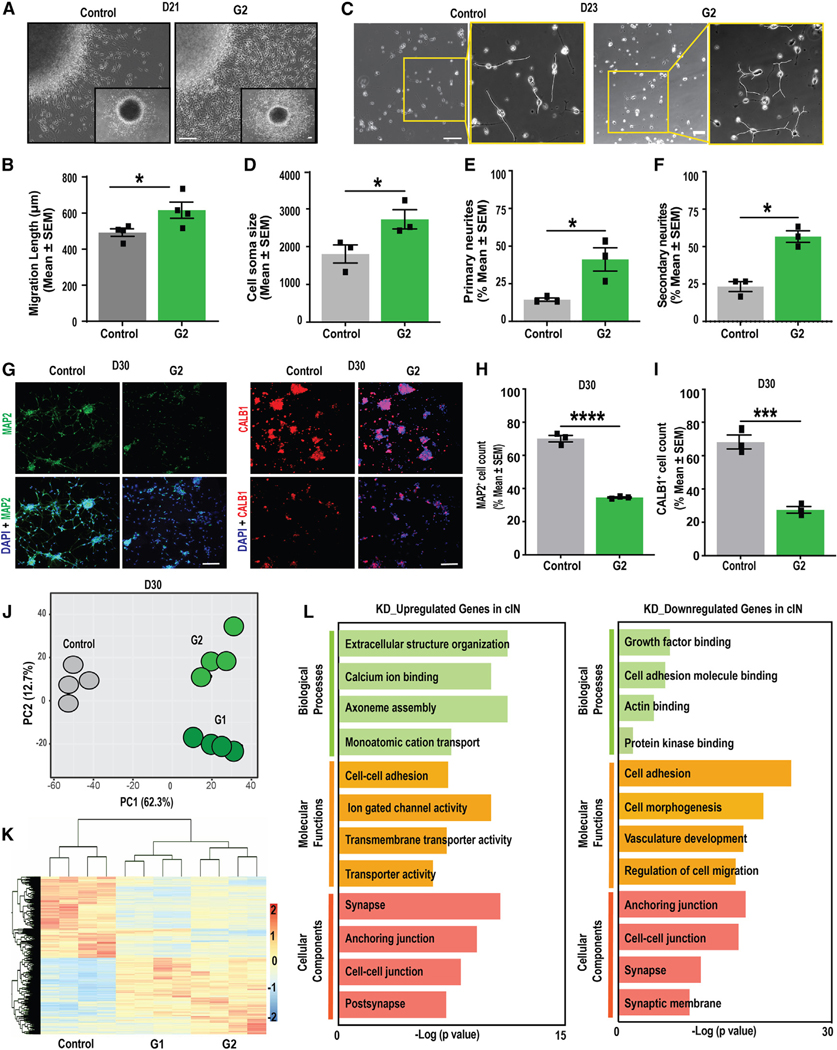
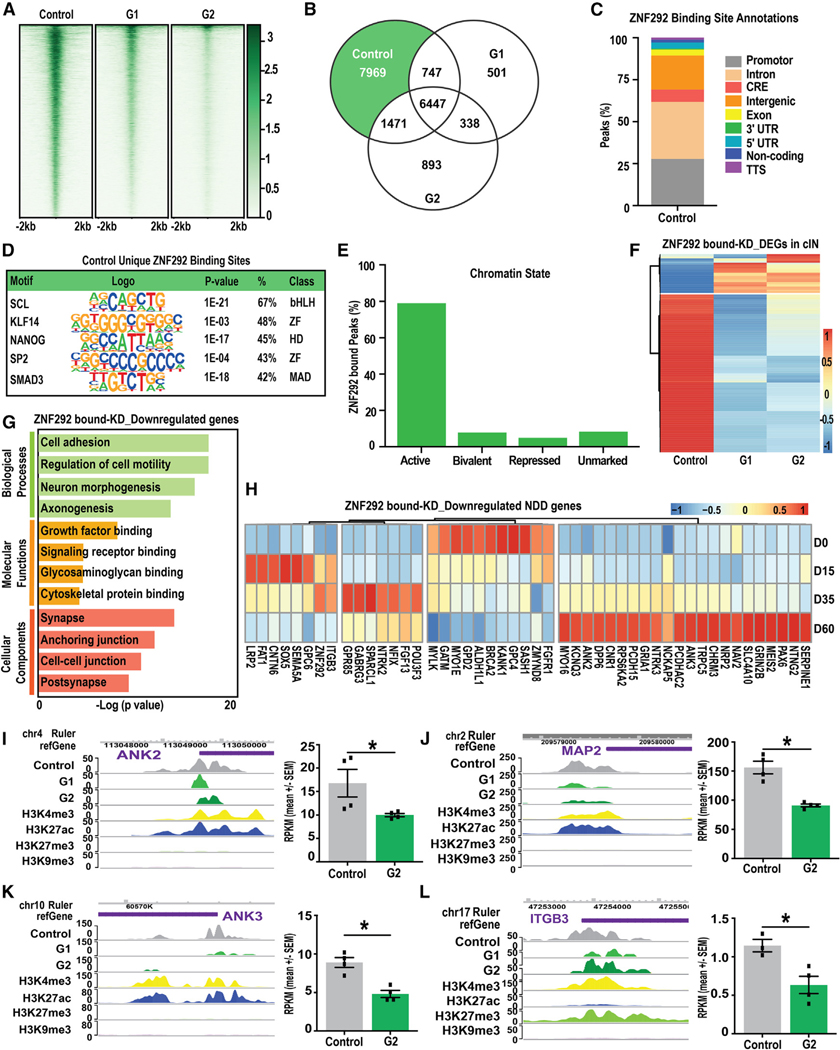
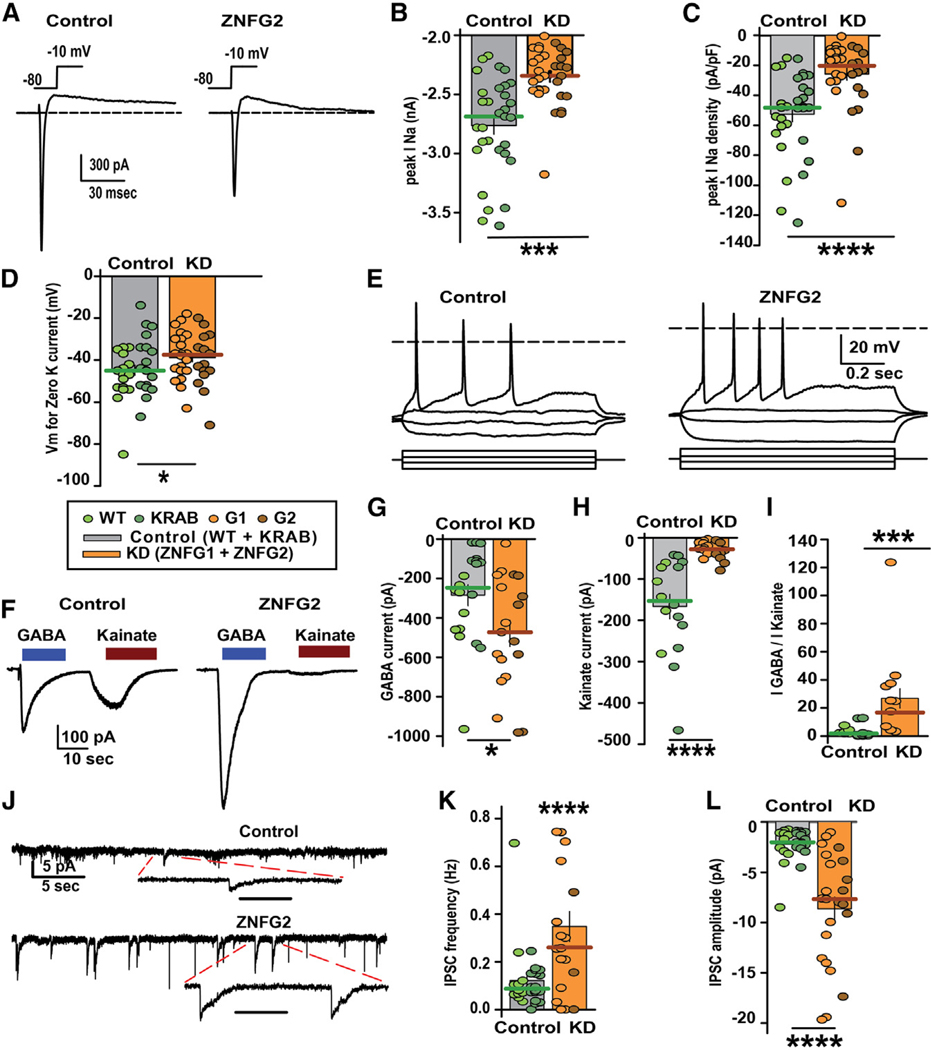
Pathogenic mutation of the zinc-finger transcription factor ZNF292 is a recently defined contributor to human neurodevelopmental disorders (NDDs). However, the gene's roles in cortical development and regulatory networks under its control were previously undefined. Here, human stem cell models of ZNF292 deficiency, resembling pathogenic haploinsufficiency, are used to derive cortical inhibitory neuron progenitors and neurons. ZNF292-deficient progenitors undergo precocious differentiation but subsequently exhibit compromised interneuron maturation and function. In progenitors, genome-wide occupancy and transcriptomic analyses identify direct target genes controlling neuronal differentiation and synapse formation that are upregulated upon ZNF292 deficiency. By contrast, deficiency in interneurons compromises ZNF292 genome-wide association with and causes downregulation of direct target genes promoting interneuron maturation and function, including other NDD genes. ZNF292-deficient interneurons also exhibit altered channel activities, elevated GABA responsiveness, and hallmarks of neuronal hyperactivity. Together, the results of this work define neurodevelopmental requirements for ZNF292, some of which may contribute to pathogenic ZNF292 mutation-related NDDs.

Keywords: CP: Developmental biology; CP: Neuroscience; autism; cortical interneuron differentiation; cortical neuron; electrophysiological function; genome-wide occupancy; human pluripotent stem cell; neurodevelopmental disorders; transcriptional regulation; zinc-finger transcription factor.


Conflict of interest statement

Declaration of interests The authors declare no competing interests.

Figures

Figure 1.
Figure 1.. ZNF292 deficiency reduces NPC proliferation and alters gene expression consistent with premature differentiation
(A) Schematic illustrating methods for generating CRISPRi-KD pluripotent stem cell (hPSC) models by stable dCas9-KRAB expression without (control) versus with CROP-Opti-seq G1 or G2 gRNA expression plasmid. (B) Protocol used to differentiate hPSCs (day [D] 0) into NPCs (D15) and cINs (D30). (C and D) (C) gRNA (G1/G2) expression significantly reduced ZNF292 in hPSC-derived NPCs also expressing dCas9-KRAB (control), with (D) immunoblotting quantification (60% ± 7.5%-G1 and 55% ± 13.6%-G2 of control; n = 3 biological replicates; for all data see Figure S1I). (E–H) Reduced outgrowth from NPC spheres (see STAR Methods), with representative images and quantification at (E and F) D11 and (G and H) D15 (n = 3). (I) Cell adhesion assay in D15 NPCs (n = 4). (J) Cell count assay 48 h after seeding (n = 3). (K) Principal-component analysis depicting variation in control and KD (G1/G2) NPC samples (n = 4, each sample type). (L) Heatmap visualizing differential expression of the 2,267 common DEGs in G1/G2 KD versus control NPCs. (M and N) Gene ontology analysis of significant DEGs in KD versus control. Analysis in (E)–(J) by one-way ANOVA is represented as the mean ± SEM; *p < 0.05, **p < 0.01, and ****p < 0.0001. Scale bars, 100 μm.
Figure 2.
Figure 2.. ZNF292 KD triggers precocious NPC specification and differentiation
(A) Gene expression during hPSC-cIN differentiation (D0–D60), grouped into four clusters, visualized for KD-upregulated DEGs in NPCs. (B) Cluster 1 and 2 DEGs, highlighting synapse formation- and interneuron function-related genes. (C) Cluster 3 DEGs, highly expressed in D15 progenitors, with genes of interest highlighted. (D and E) Reduced fraction of EdU-immunopositive (yellow) versus all DAPI-positive nuclei (blue) in G2 KD versus control NPCs (D15). (F–K) KD-enhanced fractions of cells expressing NPC specification and proneuronal markers (F and I) NKX2.1 (green/DAPI+) and (G and J) ASCL1 (green/DAPI+) and (H and K) neuronal marker TUJ1 (red/DAPI+) in G2 KD NPCs. Representative images (F, G, and H) and quantification (I, J, and K) are shown. All data are derived from n = 3 biological replicate experiments analyzed by Student’s t test and represented as the mean ± SEM. *p < 0.05 and **p < 0.01. Scale bars, 100 μm.
Figure 3.
Figure 3.. Effect of KD upon ZNF292 genome-wide occupancy in NPCs
(A) Deeptool plots depicting ZNF292 genome-wide occupancy in NPCs, including shared (top) and “control unique” (bottom) ZNF292-bound peak centers under control and KD conditions. (B) Unique and shared peak numbers under control and KD (G1/G2) conditions; highlighted peaks bound in control and lost upon G1 and/or G2 KD were further analyzed. (C–E) For control unique peak fraction (C) mapping to genomic features is shown (see STAR Methods), (D) top GO terms, and (E) TFBS enrichment. (F) Intersection of peaks with D0–D60 chromatin state. (G and H) TFBS enrichment analysis of ZNF292-bound active and bivalent peaks.
Figure 4.
Figure 4.. Putative ZNF292 direct targets in NPCs defined by ZNF292 association and differential expression upon KD
(A and B) (A) Relative expression of ZNF292-bound and -regulated DEGs in control and KD NPCs (n = 4) and (B) top GO terms. (C–L) For bound and KD-upregulated DEGs in NPCs, (C) hierarchical clustering of D0–D60 expression changes, (D) genes of interest under denoted GO terms, and (E–L) browser tracks for selected genes (E, G, I, and K) and accompanying transcriptomic data (F, H, J, and L; bar plots visualize RNA-seq reads per kilobase of transcript per million mapped reads (RPKM) mean ± SEM values; *p < 0.05, **p < 0.01, and ****p < 0.0001).
Figure 5.
Figure 5.. ZNF292 deficiency alters cIN migration, morphology, and expression of mature cIN markers
(A and B) Neurosphere outgrowth assay, with representative images in (A) and quantification of average length of neuron migration from the periphery of the neurosphere in (B) (n = 3). (C–F) Morphometric analysis of interneurons from the control and KD models at D23, with quantification of (D) cell soma size and number of cINs with (E) >3 primary neurites and (F) >2 secondary neurites. In (C) (boxes), examples of neurite branching are highlighted with white lines in representative images. (G–I) Fraction of cells expressing the mature neuronal and cIN markers MAP2 and CALB1 at D30, relative to all cells (marked by DAPI expression) is shown in representative images in (G) and quantified in (H) and (I) under control and KD conditions (n = 3). (J) Principal-component analysis (PCA) plot of cIN RNA-seq data, with segregated clustering of the control versus KD samples. (K) Heatmap visualization of relative expression of cIN DEGs in the control versus KD samples. (L) GO term enrichment analysis of KD-up- and -downregulated DEGs in cINs. Data were analyzed using Student’s t test and are represented as percentage mean ± SEM. *p < 0.05, **p < 0.01, ***p < 0.001, and ****p < 0.0001. Scale bars, 100 μm.
Figure 6.
Figure 6.. Integration of ZNF292 genome-wide occupancy and transcriptomic analysis reveals downregulation of putative ZNF292 direct targets, including other NDD-associated genes, in KD cINs
(A) Deeptool visualizations of ZNF292 peak centers under control and KD conditions in cINs (D30). (B–E) (B) Peak numbers in control and KD cINs. “Control unique” peaks highlighted in green were assessed by: (C) gene feature annotation, (D) TFBS known motif, and (E) chromatin state enrichment. (F and G) (F) Relative expression and (G) GO term enrichment of bound and KD-regulated DEGs in cINs. (H) ZNF292-bound and KD-downregulated NDD-associated DEGs, visualizing their expression profiles from D0 to D60 of cIN differentiation. (I–L) Browser tracks of selected bound and KD-downregulated genes, with bar plots (right) showing gene expression change upon KD in cINs (RPKM mean ± SEM). *p < 0.05 and **p < 0.01.
Figure 7.
Figure 7.. ZNF292 KD alters cortical interneuron function
(A–C) (A) Whole-cell inward and outward currents evoked by voltage step from —80 to 0 mV. KD (G1/G2) cINs exhibit significantly less inward (B) sodium current and (C) current density normalized by cell capacitance versus controls (WT/KRAB). (D) Reversal potential for steady-state current (Vm for 0 K current) was also significantly less negative in KD cINs versus control. (E) Voltage responses to hyperpolarizing and depolarizing current injections. (F–I) (F) Whole-cell currents evoked by GABA (blue bar) and kainate (red bar). Compared to control, KD cINs displayed (G and I) larger currents evoked by GABA and (H and I) smaller currents evoked by kainate. (J–L) Spontaneous inhibitory synaptic currents (sIPSCs; J) were (K) more frequent and (L) larger in amplitude in KD neurons versus controls. p < 0.05 was defined by Mann-Whitney rank-sum test, bars plot mean ± SEM, circles show the data values for each neuron, and thick lines show the median value.

Similar articles

References

    1. Muotri AR (2016). The Human Model: Changing Focus on Autism Research. Biol. Psychiatry 79, 642–649. 10.1016/j.bio-psych.2015.03.012. - DOI - PMC - PubMed
    1. Loke YJ, Hannan AJ, and Craig JM (2015). The Role of Epigenetic Change in Autism Spectrum Disorders. Front. Neurol. 6, 107. 10.3389/fneur.2015.00107. - DOI - PMC - PubMed
    1. Chen J, Lambo ME, Ge X, Dearborn JT, Liu Y, McCullough KB, Swift RG, Tabachnick DR, Tian L, Noguchi K, et al. (2021). A MYT1L syndrome mouse model recapitulates patient phenotypes and reveals altered brain development due to disrupted neuronal maturation. Neuron 109, 3775–3792.e14. 10.1016/j.neuron.2021.09.009. - DOI - PMC - PubMed
    1. Griesi-Oliveira K, Acab A, Gupta AR, Sunaga DY, Chailangkarn T, Nicol X, Nunez Y, Walker MF, Murdoch JD, Sanders SJ, et al. (2015). Modeling non-syndromic autism and the impact of TRPC6 disruption in human neurons. Mol. Psychiatry 20, 1350–1365. 10.1038/mp.2014.141. - DOI - PMC - PubMed
    1. Kopp ND, Nygaard KR, Liu Y, McCullough KB, Maloney SE, Gabel HW, and Dougherty JD (2020). Functions of Gtf2i and Gtf2ird1 in the developing brain: transcription, DNA binding and long-term behavioral consequences. Hum. Mol. Genet. 29, 1498–1519. 10.1093/hmg/ddaa070. - DOI - PMC - PubMed

MeSH terms

Substances

LinkOut - more resources