. 2025 May 27;44(5):115553.
doi: 10.1016/j.celrep.2025.115553. Epub 2025 Apr 20.

MyD88-mediated signaling in intestinal fibroblasts regulates macrophage antimicrobial defense and prevents dysbiosis in the gut

Affiliations

MyD88-mediated signaling in intestinal fibroblasts regulates macrophage antimicrobial defense and prevents dysbiosis in the gut

Marina Chulkina et al. Cell Rep. .

Abstract

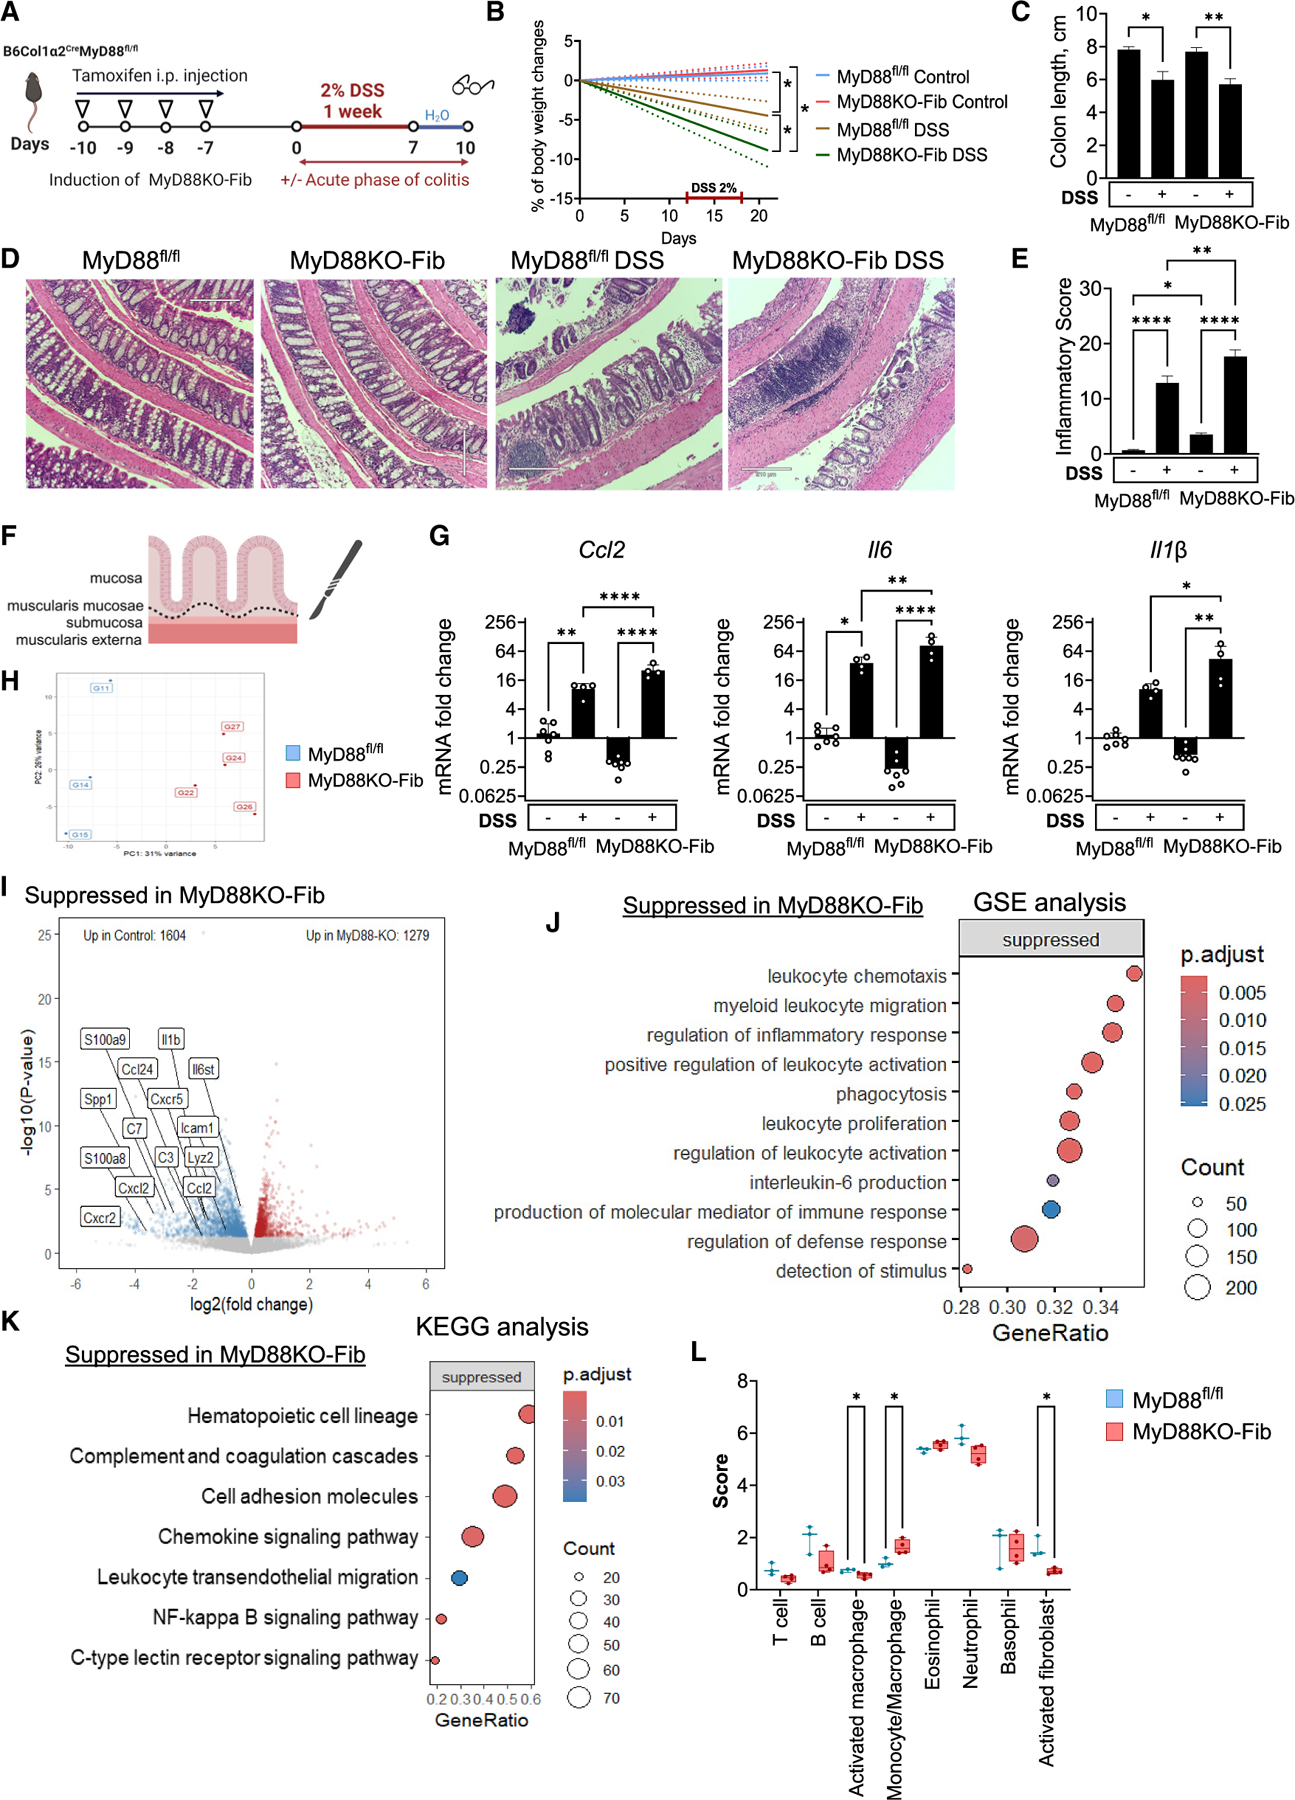
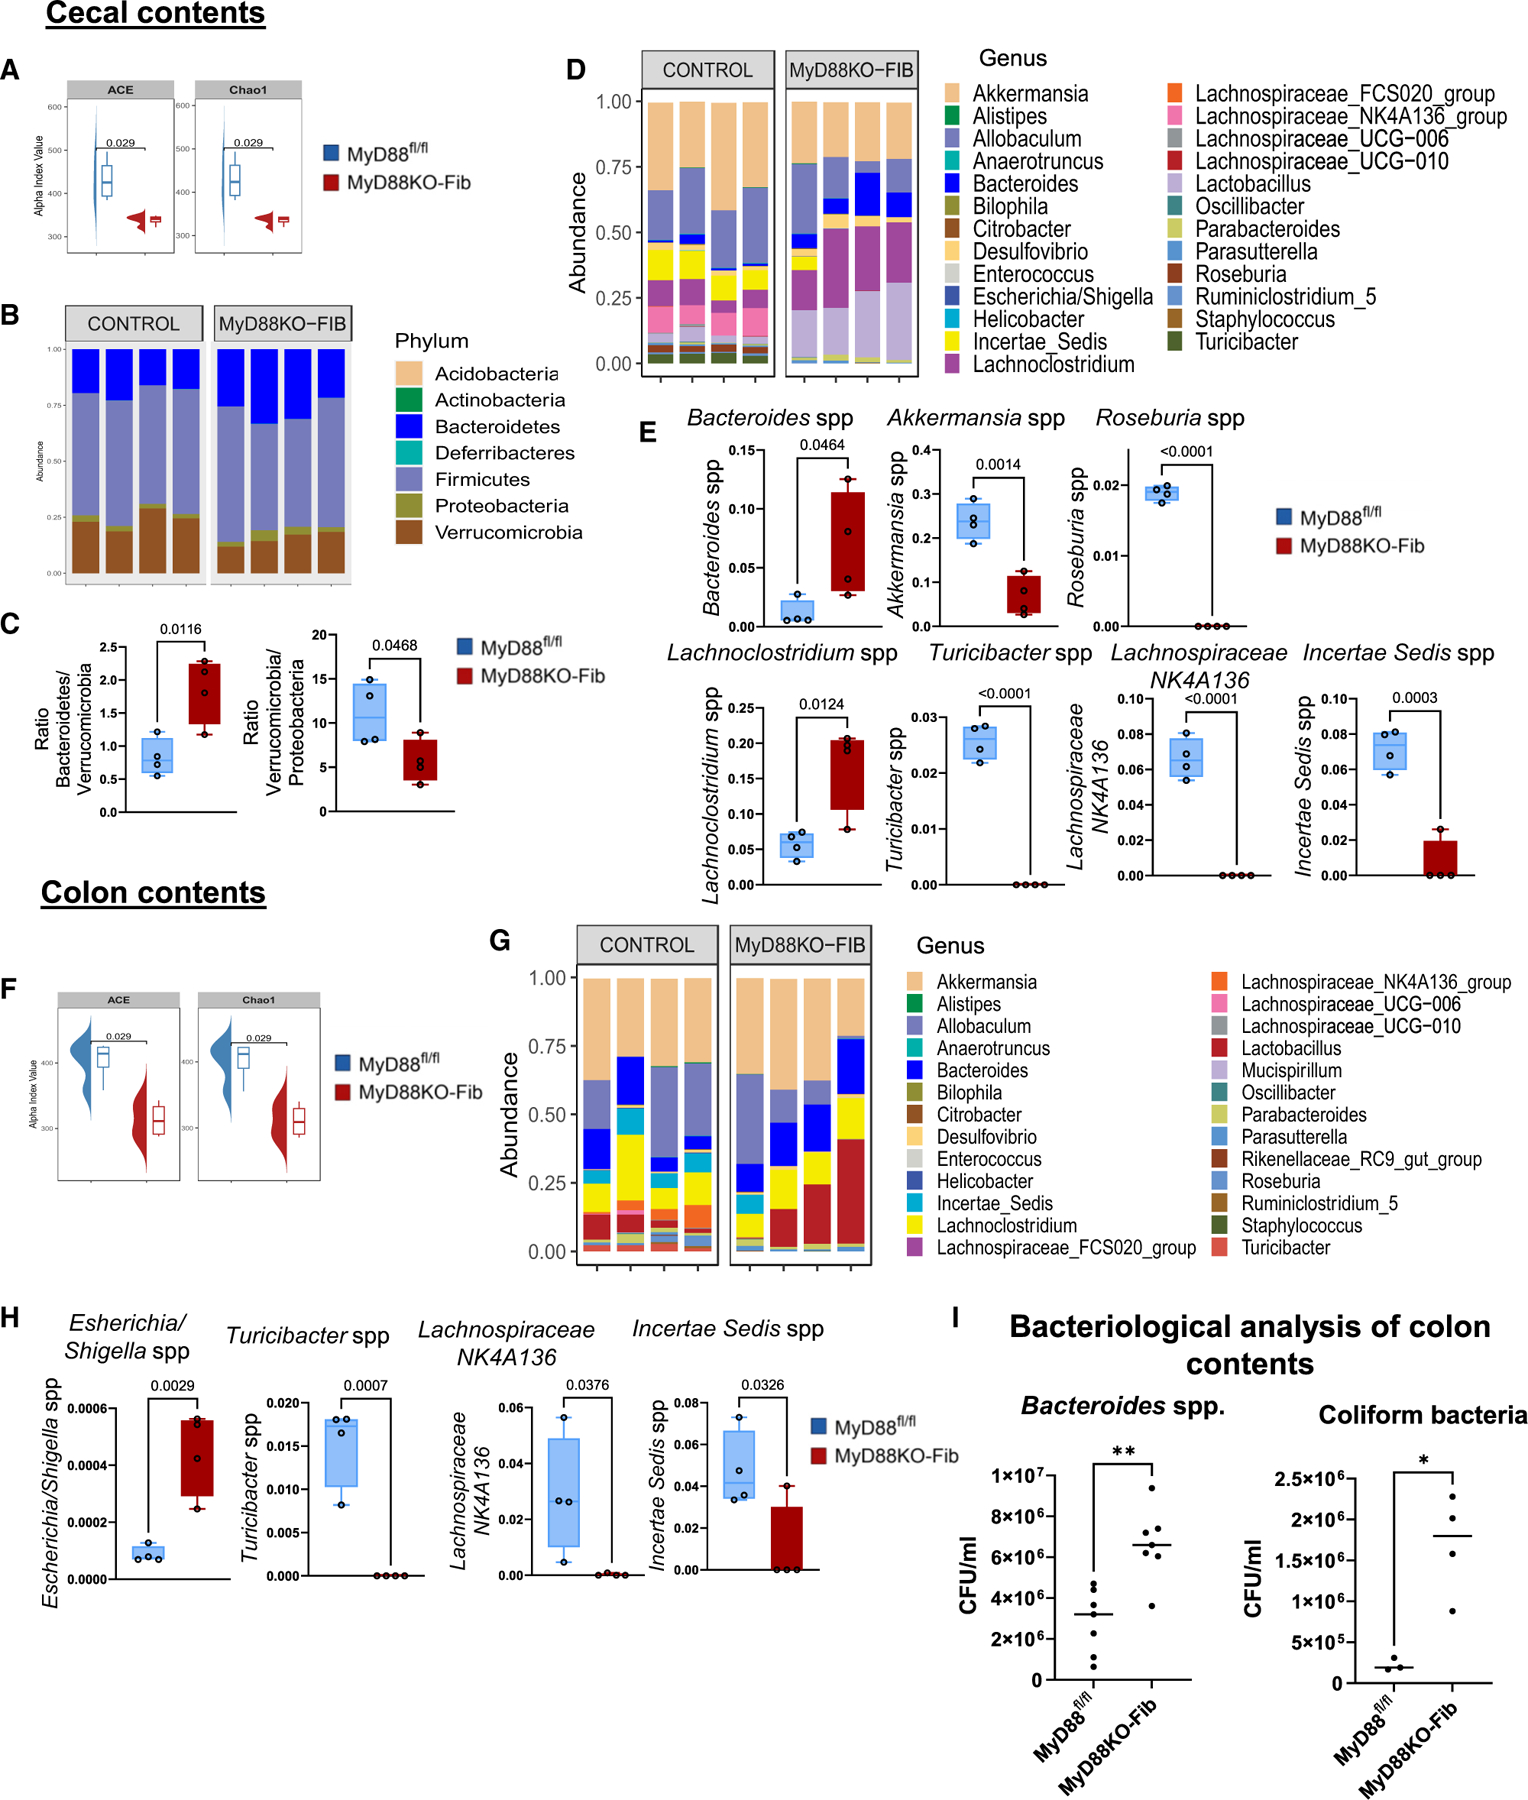
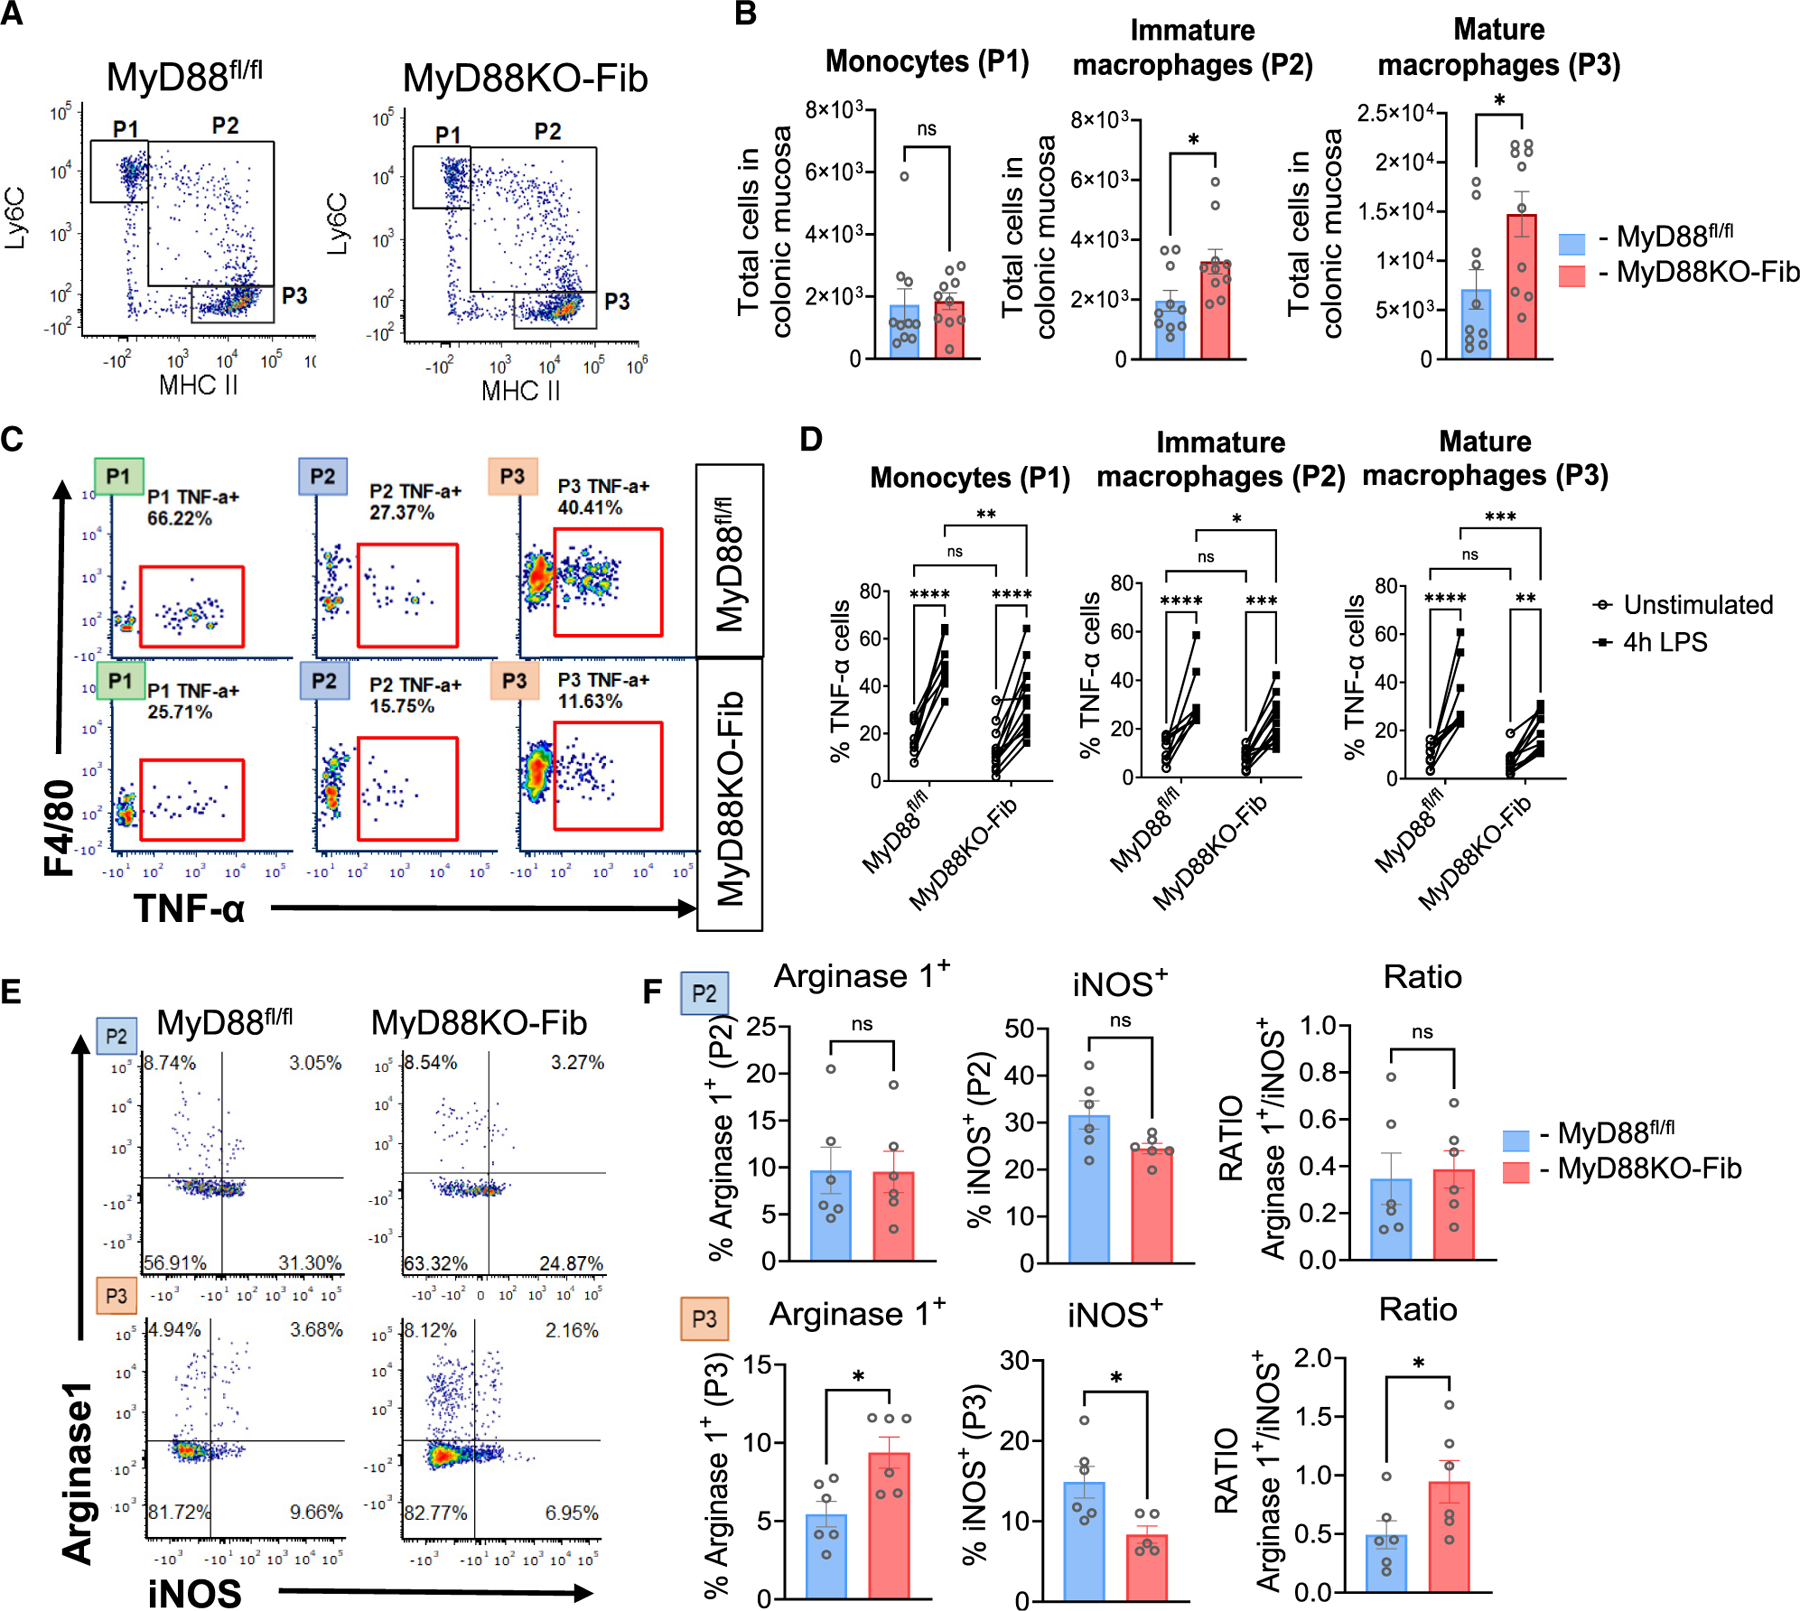
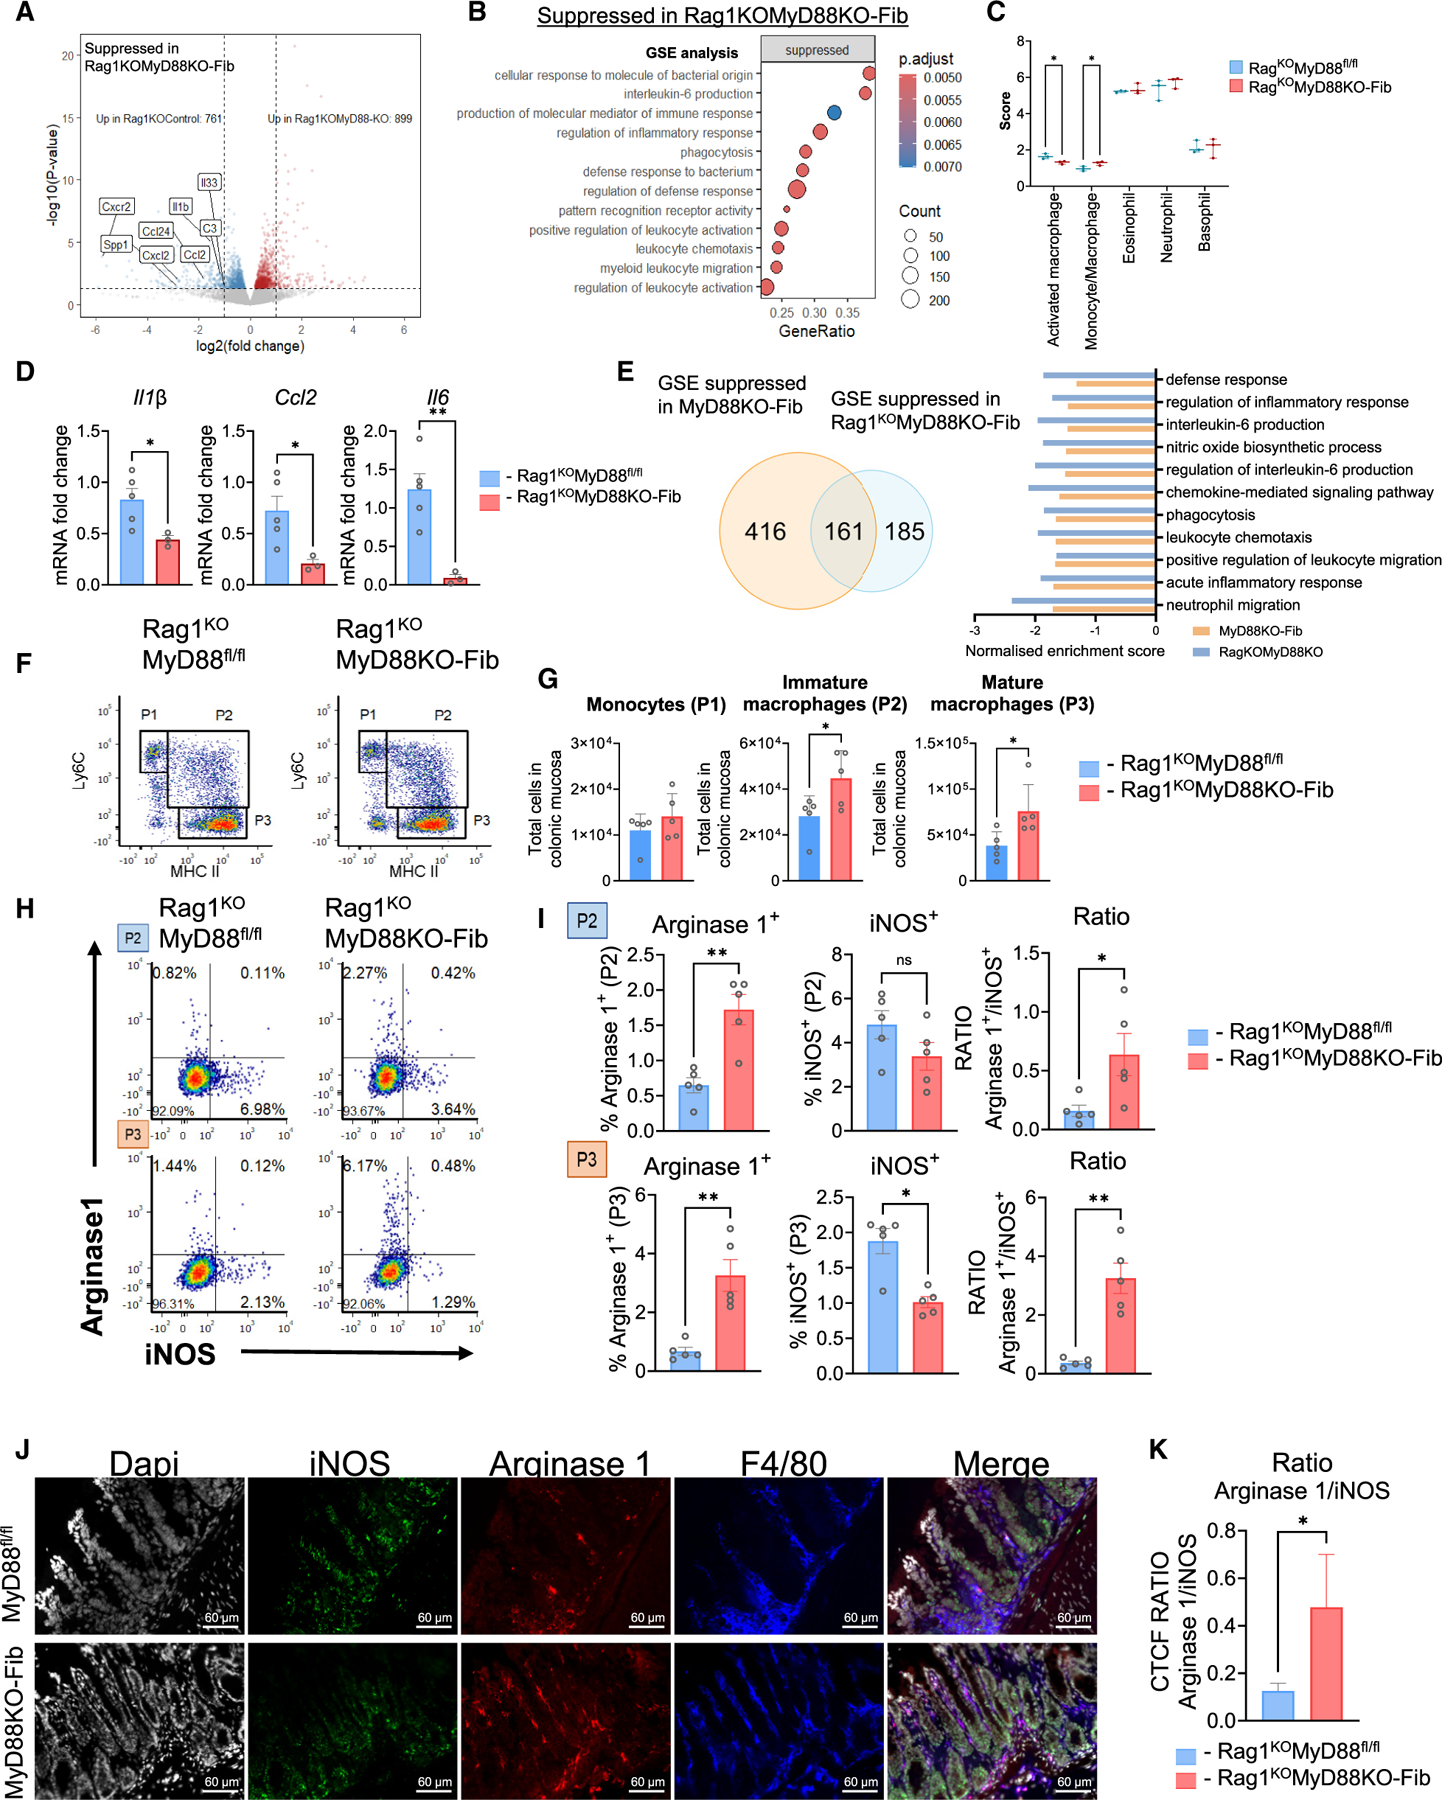
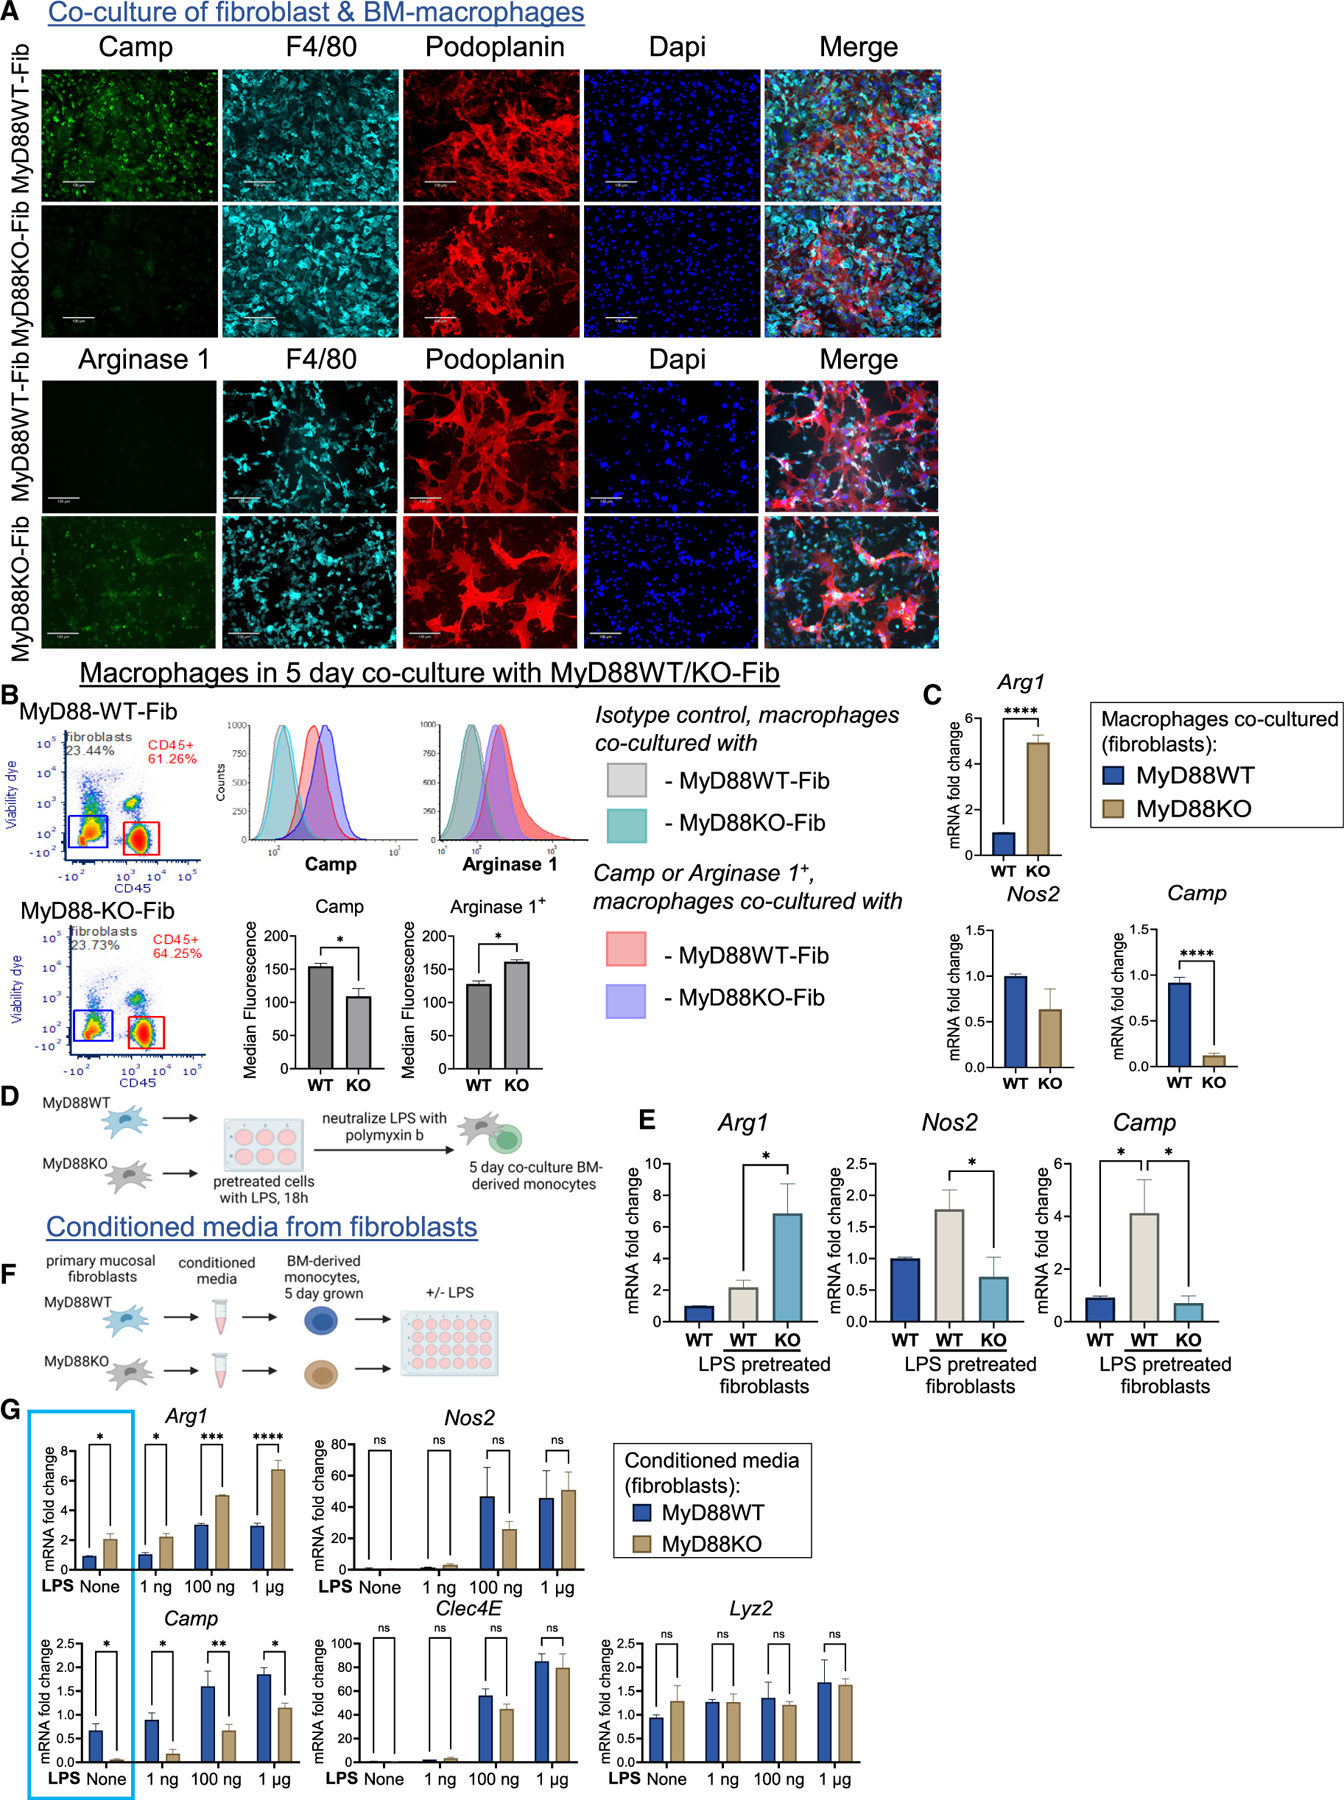
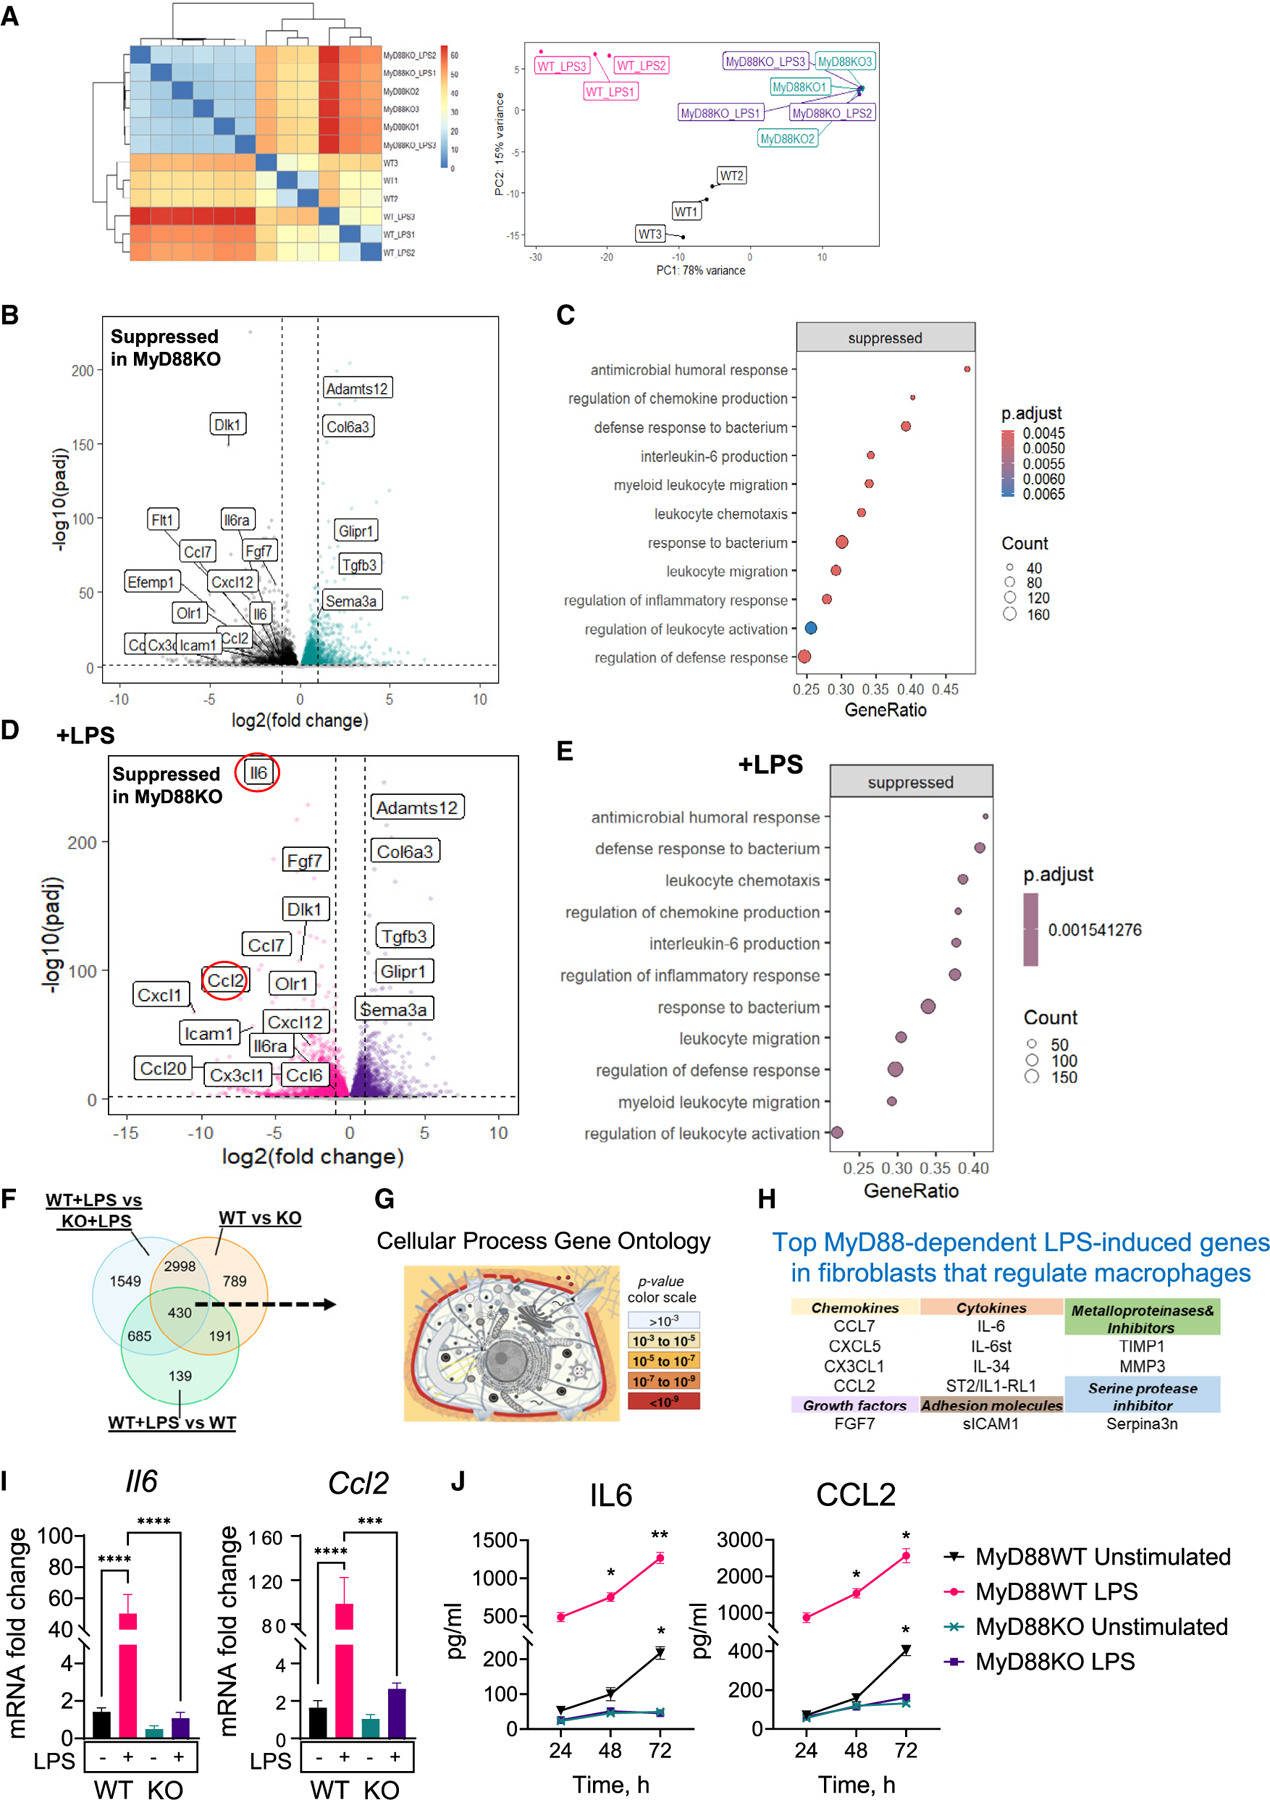
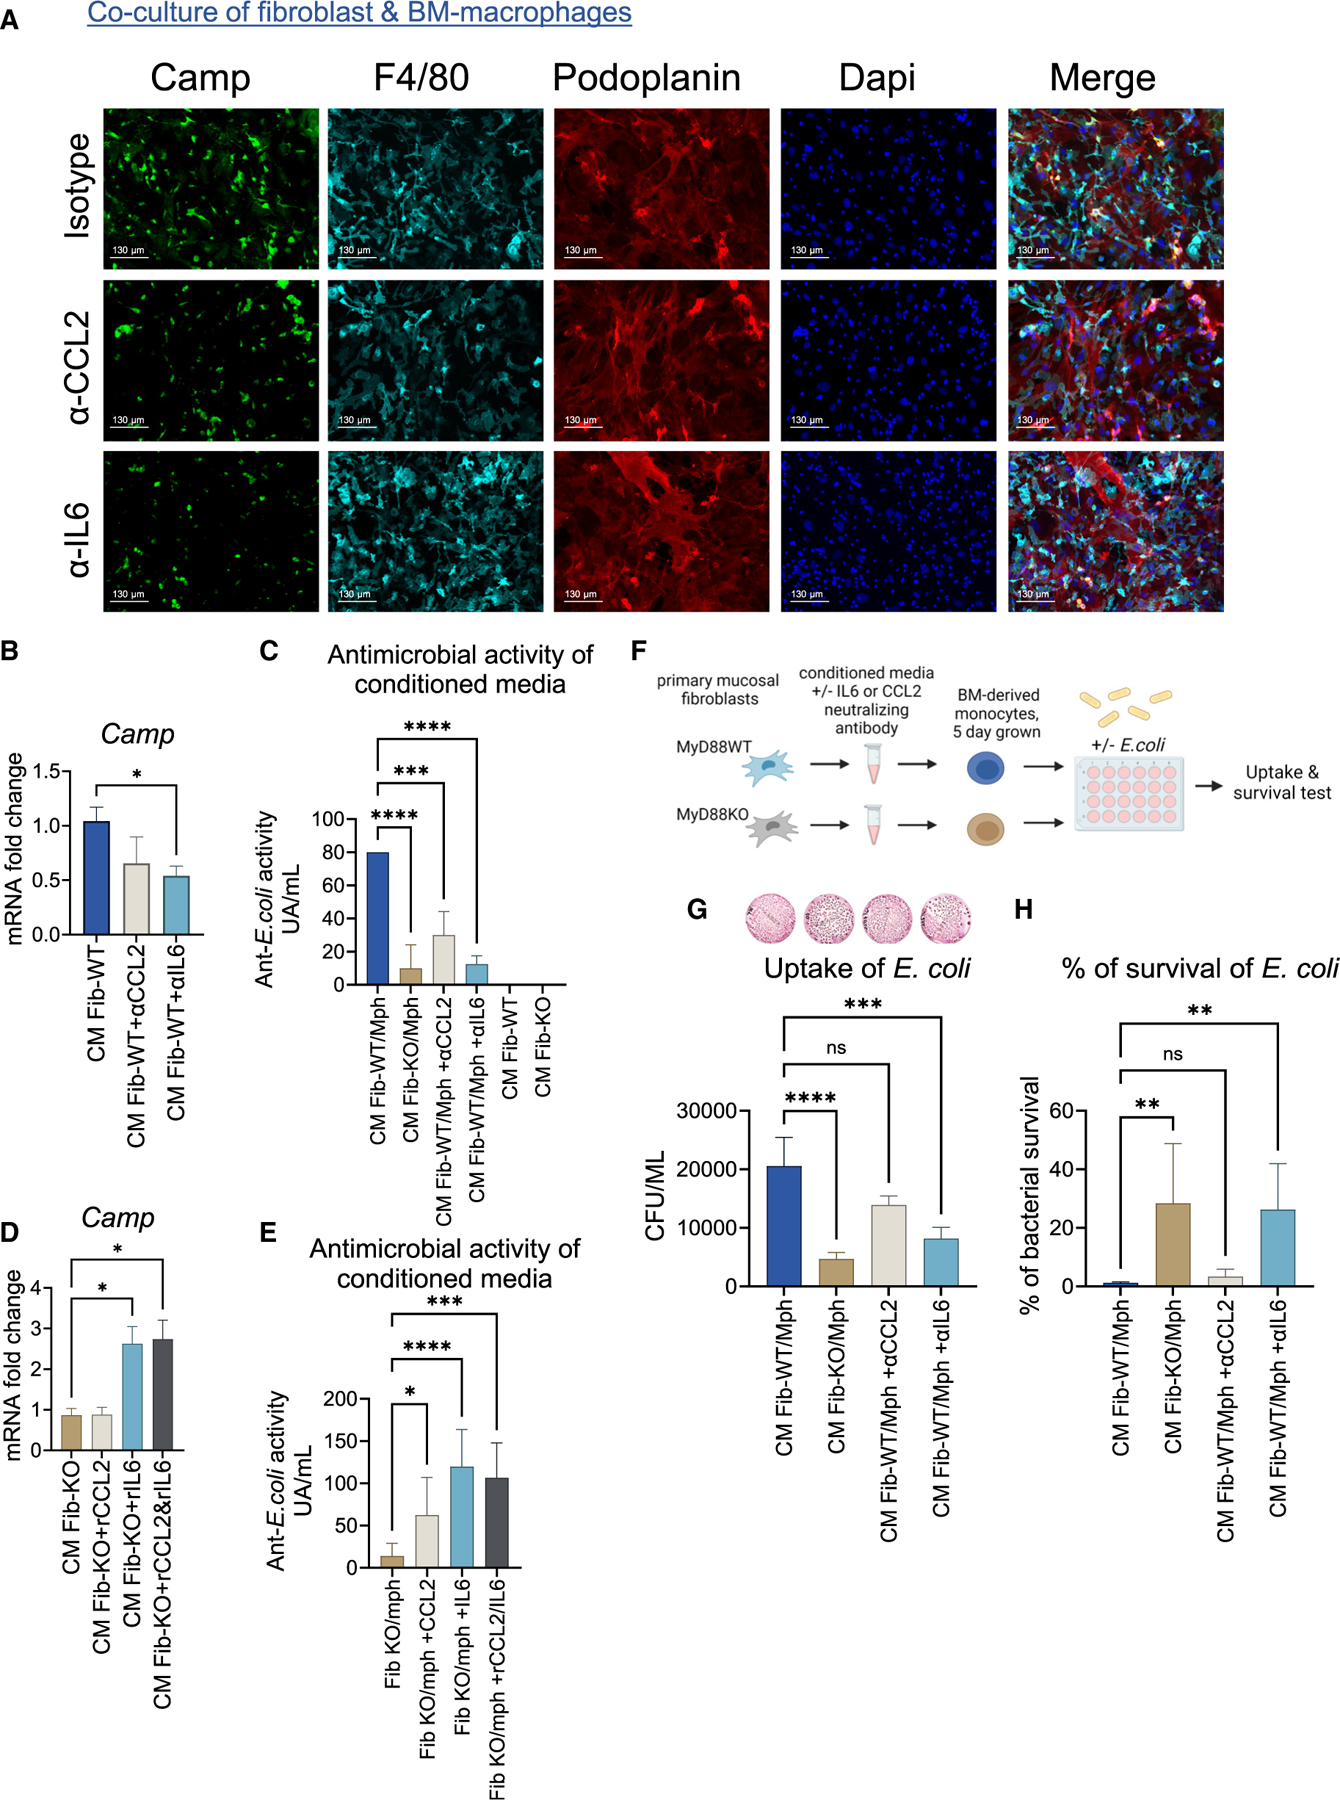
Fibroblasts that reside in the gut mucosa are among the key regulators of innate immune cells, but their role in the regulation of the defense functions of macrophages remains unknown. MyD88 is suggested to shape fibroblast responses in the intestinal microenvironment. We found that mice lacking MyD88 in fibroblasts showed a decrease in the colonic antimicrobial defense, developing dysbiosis and aggravated dextran sulfate sodium (DSS)-induced colitis. These pathological changes were associated with the accumulation of Arginase 1+ macrophages with low antimicrobial defense capability. Mechanistically, the production of interleukin (IL)-6 and CCL2 downstream of MyD88 was critically involved in fibroblast-mediated support of macrophage antimicrobial function, and IL-6/CCL2 neutralization resulted in the generation of macrophages with decreased production of the antimicrobial peptide cathelicidin and impaired bacterial clearance. Collectively, these findings revealed a critical role of fibroblast-intrinsic MyD88 signaling in regulating macrophage antimicrobial defense under colonic homeostasis, and its disruption results in dysbiosis, predisposing the host to the development of intestinal inflammation.

Keywords: CP: Immunology; MyD88; antimicrobial defense; dysbiosis; fibroblasts; gut; macrophages.


Conflict of interest statement

Declaration of interests The authors declare no competing interests.

Figures

Figure 1.
Figure 1.. Deletion of MyD88 in fibroblasts in vivo leads to worsening of acute DSS colitis and decreased defense responses in colonic mucosa
(A) Schematic representation of the experimental model. (B and C) Body weight changes (B) and measurement of colon length (C) in experimental colitis in mice. (D and E) Representative H&E pictures (scale bar: 210 μm) (D) and inflammatory score (E) (n = 5/group). (F) Schematic representation of enriched colonic mucosa. (G) RT-qPCR of Ccl2, Il6, and Il1β expression in the colitic or control enriched mucosal tissue (normalized ratio to β-actin) (n = 4–7/group). All error bars indicate mean ± SEM. *p < 0.05, **p < 0.01, and ****p < 0.001; one-way ANOVA. (H and I) PCA plot of bulk RNA-seq analysis (H) and volcano plot of DEGs (I) between MyD88fl/fl and MyD88KO-Fib mice. Wilcoxon rank-sum test; log2 fold change; p value cutoffs are 0.5 and 0.05, respectively (n = 3–4/group). (J and K) GSEA of processes downregulated in MyD88KO-Fib colonic mucosa using GO (J) and KEGG (K) databases. Adjusted p (padj) value cutoffs are 0.05. (L) Differences in (microenvironment cell population) mMCP-counter scores of estimated populations of immune cells in colonic mucosa between MyD88KO-Fib and MyD88fl/fl mice. Error bars indicate min and max; *p < 0.05; unpaired t test.
Figure 2.
Figure 2.. Deletion of MyD88 within fibroblasts leads to dysbiosis in vivo
16S rRNA-seq analysis of cecal and colonic contents analysis of MyD88KO-Fib and MyD88fl/fl control mice. (A) α-diversity of cecal microbiota. (B and C) The relative abundance at phylum level (B) and the ratios of Bacteroidetes to Verrucomicrobia and Verrucomicrobia to Proteobacteria (C) in cecal microbiota. (D and E) The relative abundance at genus level of cecal microbiota (D) and specifically for Bacteroides spp., Akkermansia spp., Roseburia spp., Lachnoclostridium spp., Incertae sedis spp., Turicibacter spp., and Lachnospiraceae NK4A136 spp. (E). (F) α-diversity of colon microbiota in mice. (G and H) The relative abundance at genus level of colon microbiota in MyD88KO-Fib and control mice (G) and specifically for Escherichia/Shigella spp., Turicibacter spp., Lachnospiraceae NK4A136 spp., and Incertae Sedis spp. (H). n = 4. (I) Bacteriological analysis of fecal microbiome of mice. n = 7 for Bacteroides spp. n = 3–4 for coliform bacteria. Unpaired t test; *p < 0.05 and **p < 0.01.
Figure 3.
Figure 3.. MyD88KO-Fib mice demonstrate an increase in colonic mucosal macrophage populations concomitant with a decrease in their defense responses
(A) Flow cytometry plots for mucosal P1, P2, and P3 populations of MyD88fl/fl and MyD88KO-Fib mice (representative of n = 10/group). (B) Calculation of total count of cells in mucosal as indicated (average of n = 10/group). All error bars indicate mean ± SEM. *p < 0.05 and **p < 0.01; unpaired t test. (C) Representative flow cytometry plots and frequency of TNF+ colonic mucosa monocytes/macrophages after LPS stimulation. (D) Percentage of TNF-producing cells out of monocytes (P1), immature macrophages (P2), and mature macrophages (P3) in colonic mucosa (two independent experiments, n = 4–6/group). *p < 0.05 and ***p < 0.001; two-way ANOVA. (E) Representative flow cytometry plots of Arginase 1-producing and iNOS-producing macrophages in colonic mucosa of mice. (F) Percentages of Arginase 1 and iNOS out of P2 and P3 populations and calculated Arginase 1-to-iNOS ratio (n = 6/group). Unpaired t test; *p < 0.05.
Figure 4.
Figure 4.. The diminished defense responses and macrophage activity in colonic mucosa of MyD88KO-Fib mice do not require T or B cell activity
(A) Volcano plot showing DEGs between Rag1KOMyD88fl/fl and Rag1KOMyD88KO-Fib mice. Wilcoxon rank-sum test; log2 fold change; p value cutoffs are 0.5 and 0.05, respectively (n = 3–4 per group). (B) GSEA analysis of processes downregulated in Rag1KOMyD88KO-Fib colonic mucosa. padj value cutoff is 0.05. (C) mMCP-counter scores of estimated populations of immune cells in colonic mucosa. Error bars indicate min and max; *p < 0.05; unpaired t test. (D) RT-qPCR of Ccl2, Il6, and Il1β expression in mucosal tissue (normalized ratio to β-actin) (n = 6/group). All error bars indicate mean ± SEM. *p < 0.05 and **p < 0.01; unpaired t test. (E) Venn diagram of processes downregulated in colonic mucosa from MyD88KO-Fib and Rag1KOMyD88KO-Fib mice. The top shared processes (intersection of Venn diagram) are represented on the graph (right). (F) Flow cytometry plots for mucosal P1, P2, and P3 populations of Rag1KOMyD88fl/fl and Rag1KOMyD88KO-Fib mice (representative of n = 5 per group). (G) Calculation of total cells count in mucosal. Mean ± SEM. *p < 0.05; unpaired t test. (H) Representative flow cytometry plots of Arginase 1- and iNOS-producing macrophages in colonic mucosa. (I) Percentages of Arginase 1 and iNOS out of P2 and P3 populations and calculated Arginase 1-to-iNOS ratio. Unpaired t test; *p < 0.05 and **p < 0.01. (J) Representative picture of immunofluorescence microscopy of colonic sections from Rag1KOMyD88fl/fl and Rag1KOMyD88KO-Fib mice stained against Arginase 1 (red), iNOS (green), F4/80 (blue), and DAPI (gray). Scale bar: 60 μm. (K) Corrected total cell fluorescence (CTCF) ratio of arginase 1 and iNOS is shown (n = 5 animals per group). Error bars indicate mean ± SEM. *p < 0.05; Mann-Whitney test.
Figure 5.
Figure 5.. MyD88KO fibroblasts directly increase Arginase 1 and decrease Camp production by macrophages in vitro
(A) Immunofluorescence microscopy of co-cultured MyD88WT or MyD88KO primary colonic fibroblasts with BM macrophages stained against Camp (green), F4/80 (cyan), podoplanin (red), and DAPI (blue) (top row) and Arginase 1 (green), F4/80 (cyan), podoplanin (red), and DAPI (blue) (bottom row). Scale bar: 130 μm. (B) Representative flow cytometry dot blot of fibroblast-BM-macrophage co-culture (left). Flow cytometry histogram and quantification of Camp and Arginase 1 in macrophages in co-culture. Error bars indicate mean ± SEM. *p < 0.05; unpaired t test. (C) RT-qPCR of Arg1, Nos2, and Camp expression in fibroblast-macrophage co-culture (normalized ratio to β-actin). Error bars indicate mean ± SEM. ****p < 0.0001; unpaired t test. (D) Experimental scheme for the co-culture system with fibroblasts, which are subsequently stimulated with LPS. (E) RT-qPCR quantification of Arg1, Nos2, and Camp expression in fibroblast-macrophage co-culture (normalized ratio to β-actin). All error bars indicate mean ± SEM. *p < 0.05; one-way ANOVA. (F) Experimental scheme of study of the effect of fibroblast-conditioned media. (G) Transcriptional expression levels of Arg1, Nos2, Camp, Clec4E, and Lyz2 in BM-derived macrophages cultured in conditioned media from colonic mucosa fibroblasts for 5 days and activated with different dosages of LPS (normalized ratio to β-actin). Error bars indicate mean ± SEM. *p < 0.05, **p < 0.01, ***p < 0.001, and ****p < 0.0001; two-way ANOVA.
Figure 6.
Figure 6.. Primary cultures of MyD88KO fibroblasts have altered expression of basal and LPS-inducible genes, which regulate myeloid cells
(A) Heatmap and PCA plot of bulk RNA-seq analysis of MyD88WT or MyD88KO primary colonic mucosal fibroblasts with or without LPS (1 μg/mL) treatment for 4 h. (B–E) Volcano plot and significant pathways from pre-ranked GSEA heatmap of gene expressions in MyD88KO fibroblasts. (F and G) Venn diagram (F) and GO enrichment analysis (G) of cellular components demonstrated genes from the middle part of the Venn diagram mostly belong to cell membrane and extracellular (secreted) molecules. The color indicates the p value of changes in cellular processes. (H) The list of the MyD88-dependent LPS-induced genes of soluble factors produced by fibroblasts that regulate macrophage activity. (I) mRNA level of Il6 and Ccl2 genes in MyD88WT or MyD88KO primary colonic mucosal cultured fibroblasts with or without LPS treatment. Error bars indicate mean ± SEM. ***p < 0.001 and ****p < 0.0001; one-way ANOVA. (J) Multiplex analysis of protein levels of IL-6 and CCL2 in the culture medium of MyD88WT or MyD88KO primary cultured fibroblasts. Error bars indicate mean ± SEM. *p < 0.05 and **p < 0.01; two-way ANOVA.
Figure 7.
Figure 7.. Antimicrobial activity in macrophages is regulated by MyD88-dependent IL-6 and CCL2 production by fibroblasts
(A) Immunofluorescence microscopy of co-cultured MyD88WT fibroblasts with BM macrophages in the presence of IL-6 or CCL2 neutralizing antibody stained against Camp (green), F4/80 (cyan), podoplanin (red), and DAPI (blue). Scale bar: 130 μm. (B) mRNA levels of Camp in BM-derived macrophages cultured in conditioned media from fibroblasts in the presence of IL-6 or CCL2 neutralizing antibody (1 μg/mL). (C) Antimicrobial activity of conditioned media from macrophages cultured in the presence of fibroblast-conditioned media with IL-6 or CCL2 neutralizing antibody. (D) mRNA levels of Camp in BM-derived macrophages cultured in conditioned media from MyD88KO fibroblasts in the presence of recombinant IL-6 (10 ng/mL) or CCL2 (20 ng/mL). (E) Antimicrobial activity of conditioned media from macrophages cultured in the presence of MyD88KO fibroblast-conditioned media with recombinant IL-6 (10 ng/mL) or CCL2 (20 ng/mL). (F) Experimental scheme of study of the direct antimicrobial activity of macrophages cultivated in conditioned media from fibroblasts in the presence of IL-6 or CCL2 neutralizing antibody. (G and H) Uptake (G) and killing (H) of E. coli by macrophages. Error bars indicate mean ± SEM. *p < 0.05, **p < 0.01, ***p < 0.001, and ****p < 0.0001; one-way ANOVA.

Similar articles

References

    1. Alatab S, Sepanlou SG, Ikuta K, Vahedi H, Bisignano C, Safiri S, Sadeghi A, Nixon MR, Abdoli A, Abolhassani H, and Alipour V (2020). The global, regional, and national burden of inflammatory bowel disease in 195 countries and territories, 1990–2017: a systematic analysis for the Global Burden of Disease Study 2017. The Lancet Gastroenterology & Hepatology 5, 17–30. - PMC - PubMed
    1. Pizarro TT, Stappenbeck TS, Rieder F, Rosen MJ, Colombel JF, Donowitz M, Towne J, Mazmanian SK, Faith JJ, Hodin RA, et al. (2019). Challenges in IBD Research: Preclinical Human IBD Mechanisms. Inflamm. Bowel Dis 25, S5–S12. - PubMed
    1. Uhlig HH, and Powrie F (2018). Translating Immunology into Therapeutic Concepts for Inflammatory Bowel Disease. Annu. Rev. Immunol 36, 755–781. - PubMed
    1. Belkaid Y, and Harrison OJ (2017). Homeostatic Immunity and the Microbiota. Immunity 46, 562–576. - PMC - PubMed
    1. Ignacio A, Czyz S, and McCoy KD (2024). Early life microbiome influences on development of the mucosal innate immune system. Semin. Immunol 73, 101885. - PubMed

MeSH terms

LinkOut - more resources