

Identifying reproducible transcription regulator coexpression patterns with single cell transcriptomics
- PMID: 40257984
- PMCID: PMC12011263
- DOI: 10.1371/journal.pcbi.1012962
Identifying reproducible transcription regulator coexpression patterns with single cell transcriptomics
Abstract
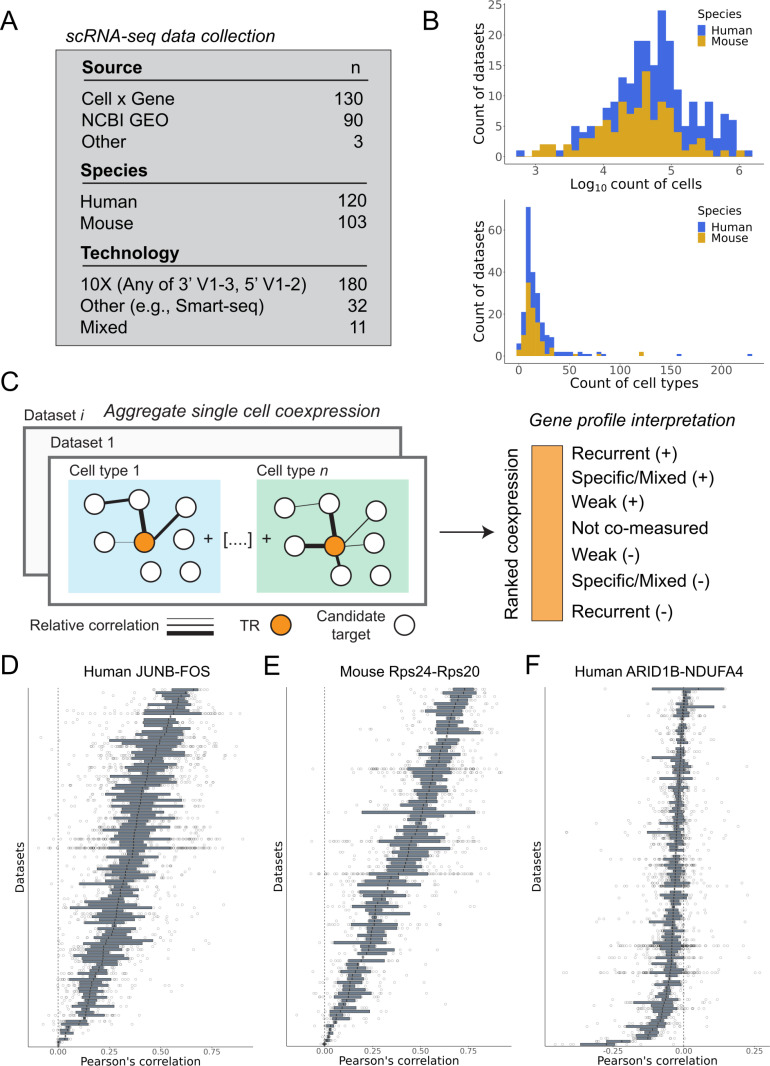
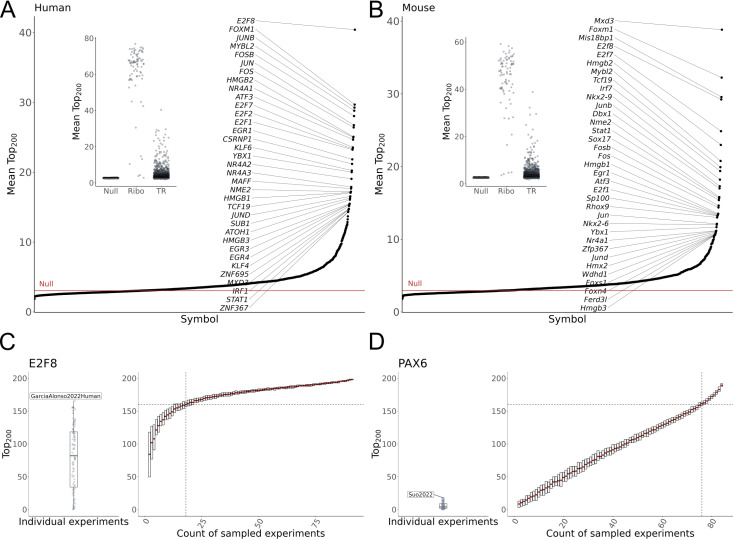
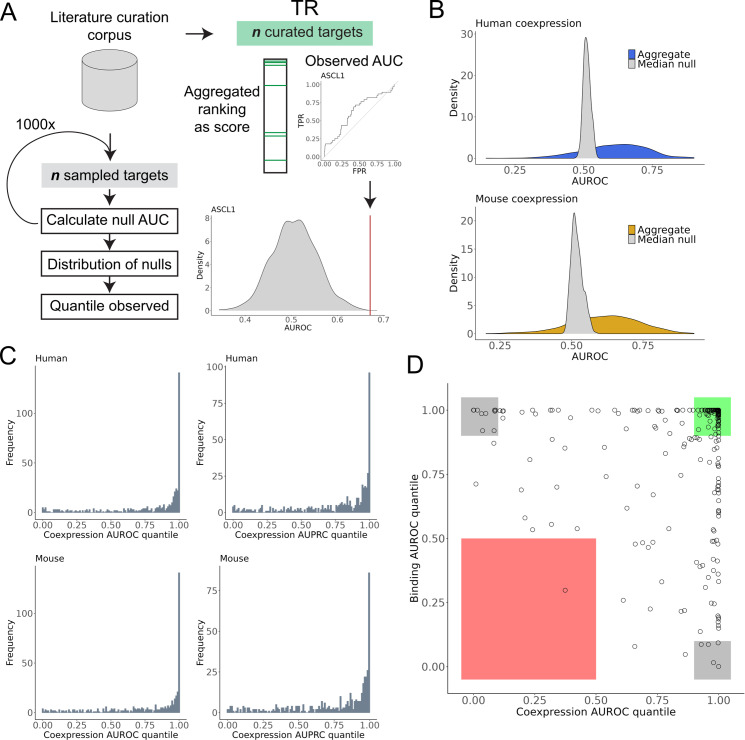
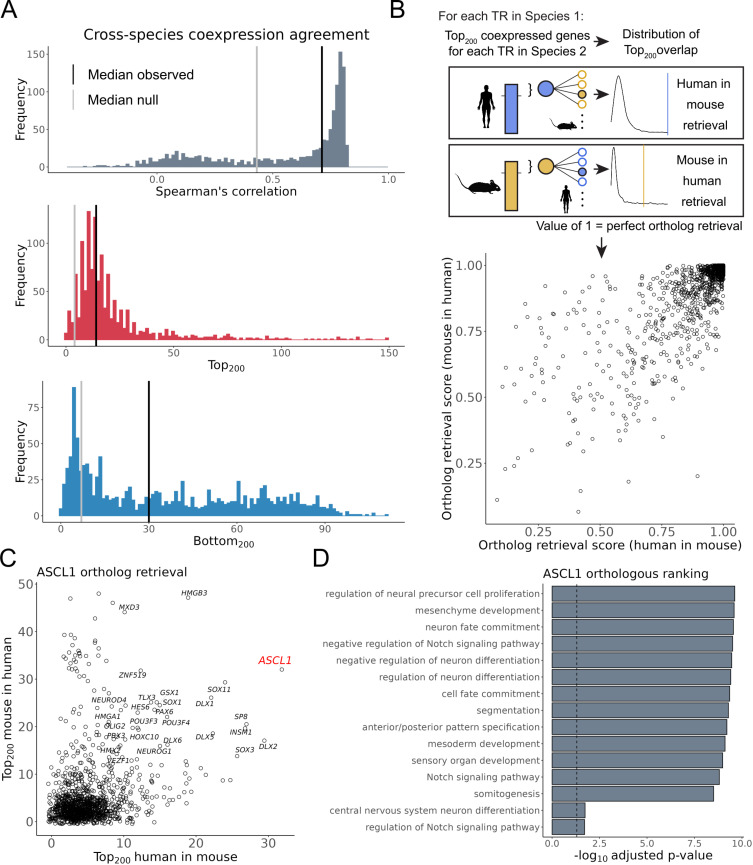
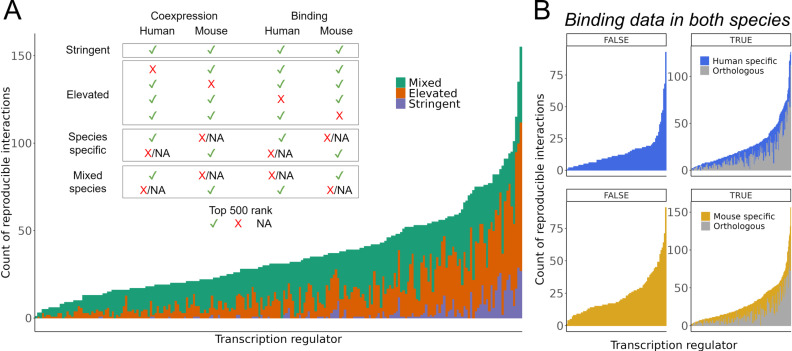
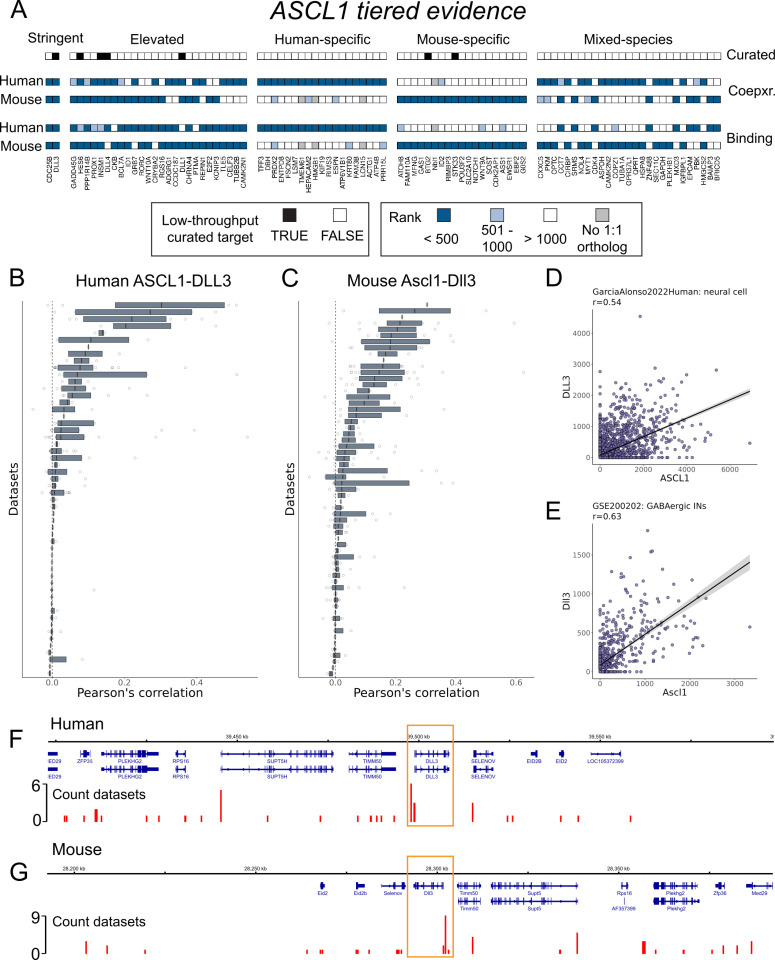
The proliferation of single cell transcriptomics has potentiated our ability to unveil patterns that reflect dynamic cellular processes such as the regulation of gene transcription. In this study, we leverage a broad collection of single cell RNA-seq data to identify the gene partners whose expression is most coordinated with each human and mouse transcription regulator (TR). We assembled 120 human and 103 mouse scRNA-seq datasets from the literature (>28 million cells), constructing a single cell coexpression network for each. We aimed to understand the consistency of TR coexpression profiles across a broad sampling of biological contexts, rather than examine the preservation of context-specific signals. Our workflow therefore explicitly prioritizes the patterns that are most reproducible across cell types. Towards this goal, we characterize the similarity of each TR's coexpression within and across species. We create single cell coexpression rankings for each TR, demonstrating that this aggregated information recovers literature curated targets on par with ChIP-seq data. We then combine the coexpression and ChIP-seq information to identify candidate regulatory interactions supported across methods and species. Finally, we highlight interactions for the important neural TR ASCL1 to demonstrate how our compiled information can be adopted for community use.
Copyright: © 2025 Morin et al. This is an open access article distributed under the terms of the Creative Commons Attribution License, which permits unrestricted use, distribution, and reproduction in any medium, provided the original author and source are credited.
Conflict of interest statement
The authors have declared that no competing interests exist.
Figures
Update of
-
Identifying Reproducible Transcription Regulator Coexpression Patterns with Single Cell Transcriptomics.bioRxiv [Preprint]. 2025 Feb 3:2024.02.15.580581. doi: 10.1101/2024.02.15.580581. bioRxiv. 2025. Update in: PLoS Comput Biol. 2025 Apr 21;21(4):e1012962. doi: 10.1371/journal.pcbi.1012962. PMID: 38559016 Free PMC article. Updated. Preprint.
Similar articles
-
Identifying Reproducible Transcription Regulator Coexpression Patterns with Single Cell Transcriptomics.bioRxiv [Preprint]. 2025 Feb 3:2024.02.15.580581. doi: 10.1101/2024.02.15.580581. bioRxiv. 2025. Update in: PLoS Comput Biol. 2025 Apr 21;21(4):e1012962. doi: 10.1371/journal.pcbi.1012962. PMID: 38559016 Free PMC article. Updated. Preprint.
-
Identifying gene expression from single cells to single genes.Methods Cell Biol. 2019;151:127-158. doi: 10.1016/bs.mcb.2018.11.018. Epub 2019 Jan 2. Methods Cell Biol. 2019. PMID: 30948004 Free PMC article. Review.
-
Cell Heterogeneity Analysis in Single-Cell RNA-seq Data Using Mixture Exponential Graph and Markov Random Field Model.Biomed Res Int. 2021 May 22;2021:9919080. doi: 10.1155/2021/9919080. eCollection 2021. Biomed Res Int. 2021. PMID: 34095314 Free PMC article.
-
Debiased personalized gene coexpression networks for population-scale scRNA-seq data.Genome Res. 2023 Jun;33(6):932-947. doi: 10.1101/gr.277363.122. Epub 2023 Jun 9. Genome Res. 2023. PMID: 37295843 Free PMC article.
-
A single-cell multimodal view on gene regulatory network inference from transcriptomics and chromatin accessibility data.Brief Bioinform. 2024 Jul 25;25(5):bbae382. doi: 10.1093/bib/bbae382. Brief Bioinform. 2024. PMID: 39207727 Free PMC article. Review.
References
-
- Lambert SA, Jolma A, Campitelli LF, Das PK, Yin Y, Albu M, et al.. The human transcription factors. Cell. 2018;172(4):650–65. - PubMed
MeSH terms
Substances
Grants and funding
LinkOut - more resources
Full Text Sources
