. 2025 Apr 21;21(4):e1012999.
doi: 10.1371/journal.pcbi.1012999. eCollection 2025 Apr.

Revealing cancer driver genes through integrative transcriptomic and epigenomic analyses with Moonlight

Affiliations

Revealing cancer driver genes through integrative transcriptomic and epigenomic analyses with Moonlight

Mona Nourbakhsh et al. PLoS Comput Biol. .

Abstract

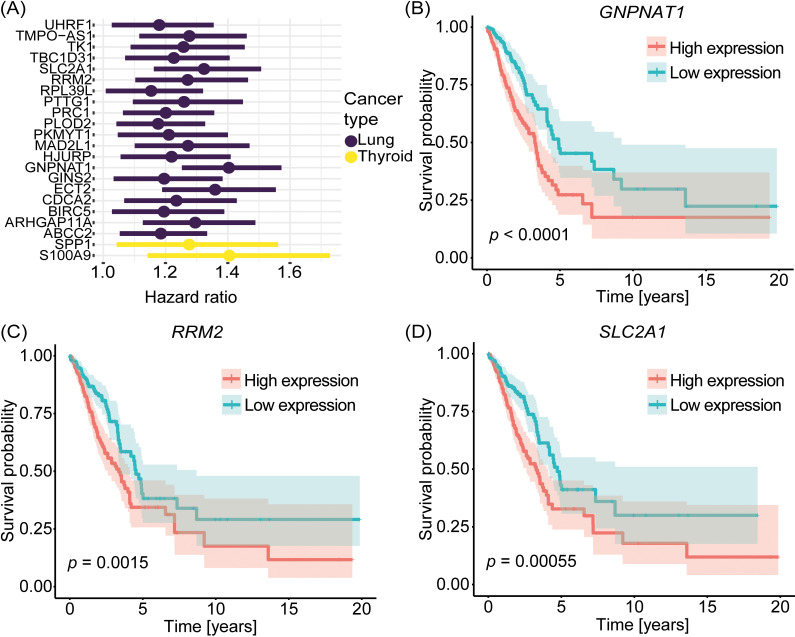
Cancer involves dynamic changes caused by (epi)genetic alterations such as mutations or abnormal DNA methylation patterns which occur in cancer driver genes. These driver genes are divided into oncogenes and tumor suppressors depending on their function and mechanism of action. Discovering driver genes in different cancer (sub)types is important not only for increasing current understanding of carcinogenesis but also from prognostic and therapeutic perspectives. We have previously developed a framework called Moonlight which uses a systems biology multi-omics approach for prediction of driver genes. Here, we present an important development in Moonlight2 by incorporating a DNA methylation layer which provides epigenetic evidence for deregulated expression profiles of driver genes. To this end, we present a novel functionality called Gene Methylation Analysis (GMA) which investigates abnormal DNA methylation patterns to predict driver genes. This is achieved by integrating the tool EpiMix which is designed to detect such aberrant DNA methylation patterns in a cohort of patients and further couples these patterns with gene expression changes. To showcase GMA, we applied it to three cancer (sub)types (basal-like breast cancer, lung adenocarcinoma, and thyroid carcinoma) where we discovered 33, 190, and 263 epigenetically driven genes, respectively. A subset of these driver genes had prognostic effects with expression levels significantly affecting survival of the patients. Moreover, a subset of the driver genes demonstrated therapeutic potential as drug targets. This study provides a framework for exploring the driving forces behind cancer and provides novel insights into the landscape of three cancer sub(types) by integrating gene expression and methylation data.


Conflict of interest statement

The authors have declared that no competing interests exist.

Figures

Fig 1
Fig 1. Overview of the Moonlight framework with new methylation functionality.
(A) Moonlight consists of a primary layer requiring differentially expressed genes and gene expression data as input. The primary layer predicts oncogenic mediators through a series of functions called functional enrichment analysis (FEA), gene regulatory network analysis (GRN), upstream regulator analysis (URA), and pattern recognition analysis (PRA). Moonlight’s secondary mutation layer requires mutation data as input and is carried out via the driver mutation analysis (DMA) function and similarly, Moonlight’s secondary methylation layer implemented in the gene methylation analysis (GMA) function requires methylation data as input. The secondary layer results in the final prediction of driver genes. (B) DNA methylation is a mechanism occurring under physiological conditions in cells which functions to regulate gene expression. However, in cancer, the DNA methylation process is altered. A loss of methylation called hypomethylation can occur which can lead to increased expression of a gene and thus an increased amount of the resulting protein. In contrast, gain of methylation called hypermethylation can also occur which can silence gene expression and lead to decreased protein expression. These two mechanisms can finally lead to cancer. Hypo- and hypermethylation can activate and inactivate oncogenes and tumor suppressors, respectively, the biological principle that GMA is built on. (C) The outputs of EpiMix and Moonlight are integrated to predict driver genes. EpiMix outputs a table of CpG-gene pairs containing differentially methylated CpG sites whose DNA methylation state is associated with gene expression. Moonlight outputs a list of oncogenic mediators and their putative driver role as tumor suppressors or oncogenes. (D) Driver genes are defined in GMA by comparing EpiMix’s predictions of methylation state and Moonlight’s predictions of driver role in “evidence” categories. Those oncogenic mediators labeled with an “agreement” evidence are retained as the final set of predicted driver genes.
Fig 2
Fig 2. Integration of Moonlight and EpiMix for prediction of cancer driver genes.
(A) Number of differentially methylated CpGs as found from EpiMix in oncogenic mediators predicted from Moonlight’s primary layer. The differentially methylated CpGs are categorized into methylation status and stratified by cancer (sub)type. (B) Heatmap showing number of differentially methylated CpGs and classifications of methylation status in the oncogenic mediators in basal-like breast cancer. The heatmap was generated using the plotGMA function. (C) Venn diagram comparing oncogenic mediators predicted from Moonlight’s primary layer with functional genes predicted from EpiMix in basal-like breast cancer. The functional genes are genes containing differentially methylated CpG pairs whose DNA methylation state is associated with expression of the gene. Only those functional genes that contained the same methylation state in all of its associated CpGs were included in this comparison, and moreover, the dual methylation states were excluded. (D) Heatmap showing the effect of the predicted driver genes in basal-like breast cancer on apoptosis and proliferation of cells. This heatmap was generated using the function plotMoonlightMet. These effects define the basis upon which the oncogenic mediators are predicted from the PRA step in Moonlight’s primary layer. (E) Comparison between the predicted driver genes with the predicted oncogenic mediators in all three cancer (sub)types where the driver genes were predicted with the new functionality GMA in Moonlight’s secondary layer, and the oncogenic mediators were predicted with Moonlight’s primary layer. The comparisons were quantified in terms of overlaps with genes reported in the COSMIC Cancer Gene Census (CGC) by computing the precision and sensitivity. The precision was calculated as (TP/(TP + FP))*100 and sensitivity as (TP/(TP + FN))*100. The true positives (TP) are the overlap between the gene set (either the driver genes or the oncogenic mediators) and the CGC. The false positives (FP) are those genes found in the gene set but are not included in CGC. The false negatives (FN) comprise those genes reported in CGC but are not predicted in our gene set.
Fig 3
Fig 3. Enrichment analyses of predicted driver genes.
Enrichment analysis of predicted driver genes in (A) basal-like breast cancer, (B) lung adenocarcinoma, and (C) thyroid carcinoma using the “MSigDB Hallmark 2020” database. The top 10 most significantly enriched terms (adjusted p-value < 0.05) are included. The gene ratio on the x axis is the ratio between the number of predicted driver genes that intersect with genes annotated in the given hallmark gene set and the total number of genes annotated in the respective hallmark gene set. The point sizes reflect the number of driver genes playing a role in the respective hallmark gene set.
Fig 4
Fig 4. Survival analysis of predicted driver genes.
(A) Hazard ratios from multivariate Cox proportional hazards regression of 20 of the predicted OCGs in lung adenocarcinoma and of two of the predicted OCGs in thyroid carcinoma. (B-D) Kaplan-Meier survival plots of three of the predicted OCGs in lung adenocarcinoma which were deemed prognostic from multivariate Cox regression analysis: (B) GNPNAT1, (C) RRM2, and (D) SLC2A1. Patients with expression values above and below the median expression level of the respective gene were divided into a high and low expression group, respectively. The p-values represent the significance of difference in survival between the two groups for each gene.
Fig 5
Fig 5. Exploration of predicted driver genes as drug targets.
(A) Distribution of driver gene-drug interactions stratified by cancer type with the number of drug interactions on the x axis and number of driver genes on the y axis. (B-D) Heatmaps visualizing driver gene-drug interactions in (B) lung adenocarcinoma, (C) basal-like breast cancer, and (D) thyroid carcinoma. Only those driver gene-drug interactions where the interaction type was known are included in the heatmaps. The type of interaction is shown in different colors. The driver genes are divided into OCGs and TSGs.
Fig 6
Fig 6. Comparison of number of mutation- and methylation-driven driver genes.
Venn diagram comparing (A, D) the number of driver genes, (B, E) TSGs, and (C, F) OCGs predicted by the Driver Mutation Analysis (DMA) and Gene Methylation Analysis (GMA) functions of Moonlight2 for (A-C) basal-like breast cancer and (D-F) lung adenocarcinoma.
Fig 7
Fig 7. Enrichment analysis of predicted mutation-driven driver genes.
Enrichment analysis of (A) mutation-driven driver genes predicted by Driver Mutation Analysis (DMA) in basal-like breast cancer, (B) mutation-driven driver genes predicted by Driver Mutation Analysis (DMA) in lung adenocarcinoma, and (C) driver genes predicted by both DMA and GMA in lung adenocarcinoma. The “MSigDB Hallmark 2020” database was used for the enrichment analyses. The top 10 most significantly enriched terms (adjusted p-value < 0.05) are included. The gene ratio on the x axis is the ratio between the number of predicted driver genes that intersect with genes annotated in the given hallmark gene set and the total number of genes annotated in the respective hallmark gene set. The point sizes reflect the number of driver genes playing a role in the respective hallmark gene set.

Similar articles

References

    1. Sung H, Ferlay J, Siegel RL, Laversanne M, Soerjomataram I, Jemal A, et al.. Global Cancer Statistics 2020: GLOBOCAN estimates of incidence and mortality worldwide for 36 cancers in 185 countries. CA Cancer J Clin. 2021;71(3):209–49. doi: 10.3322/caac.21660 - DOI - PubMed
    1. Stratton MR, Campbell PJ, Futreal PA. The cancer genome. Nature. 2009;458(7239):719–24. doi: 10.1038/nature07943 - DOI - PMC - PubMed
    1. Vogelstein B, Papadopoulos N, Velculescu VE, Zhou S, Diaz LA Jr, Kinzler KW. Cancer genome landscapes. Science. 2013;339(6127):1546–58. doi: 10.1126/science.1235122 - DOI - PMC - PubMed
    1. Shen L, Shi Q, Wang W. Double agents: genes with both oncogenic and tumor-suppressor functions. Oncogenesis. 2018;7(3):25. doi: 10.1038/s41389-018-0034-x - DOI - PMC - PubMed
    1. Datta N, Chakraborty S, Basu M, Ghosh MK. Tumor suppressors having oncogenic functions: the double agents. Cells. 2020;10(1):46. doi: 10.3390/cells10010046 - DOI - PMC - PubMed