. 2025 Apr 22;166(9):2162-2180.
doi: 10.1097/j.pain.0000000000003599.

CRMP2 phosphorylation regulates polarization and spinal infiltration of CD4 + T lymphocytes, inhibits spinal glial activation, and arthritic pain

Affiliations

CRMP2 phosphorylation regulates polarization and spinal infiltration of CD4 + T lymphocytes, inhibits spinal glial activation, and arthritic pain

Yue-Peng Jiang et al. Pain. .

Abstract

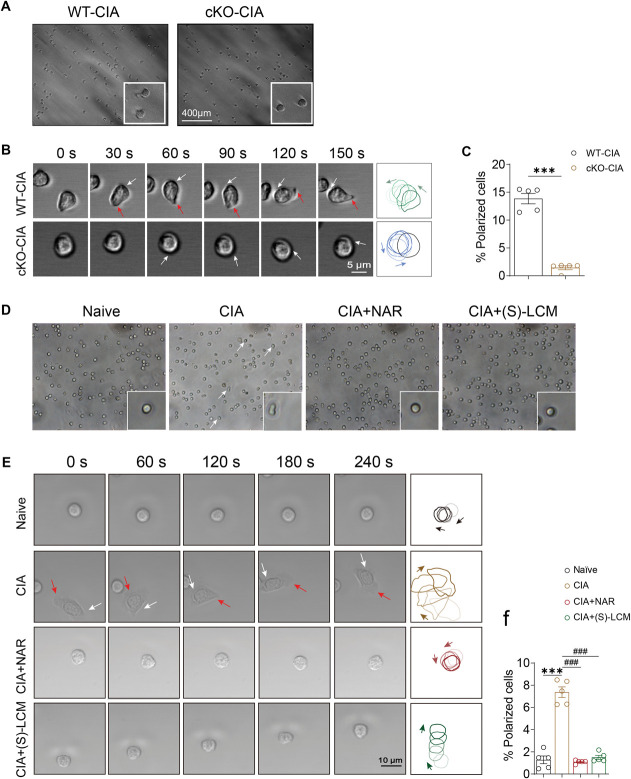
Chronic pain, a hallmark symptom of rheumatoid arthritis (RA), is strongly linked to central sensitization driven by spinal glial cell activation. Despite its clinical significance, the precise mechanisms remain unclear. Recent findings highlight the crucial role of interactions between circulating monocytes and central nervous system glial cells in chronic pain associated with autoimmune conditions. Our study focuses on CD4 + T-cell infiltration into the spinal dorsal horn (SDH) after collagen-induced arthritis (CIA) immunization. Immunohistochemistry results indicate that CD4 + T cells are critical in initiating arthritic pain. Intrathecal injection of CD4 + T cells in naïve mice induced glial activation and pain-like behaviors, while neutralizing antibodies suppressed these effects. Elevated phosphorylation of collapsin response mediator protein 2 (CRMP2) in CIA-derived CD4 + T lymphocytes was closely associated with pathological spinal infiltration. To modulate CRMP2 phosphorylation, we used naringenin (NAR), a known CRMP2 regulator, and (S)-Lacosamide ((S)-LCM), a specific inhibitor of phosphorylated CRMP2. Both compounds reduced CD4 + T-cell infiltration into the SDH and attenuated central sensitization in CIA rats. CRMP2 conditional knockout (cKO) in CD4 + T cells significantly alleviated arthritic pain. In addition, in vitro blood brain barrier models and Transwell assays showed impaired CD4 + T-cell migration and transendothelial invasion upon cKO or treatment with NAR and (S)-LCM. These interventions also decreased the proportion of polarized CD4 + T cells in CIA-induced mice. Our research highlights the role of CRMP2 phosphorylation in CD4 + T-cell behavior, spinal infiltration, and pain modulation, suggesting potential novel therapeutic strategies for RA-associated chronic pain.

Keywords: CRMP2; Central sensitization; Chronic pain; Rheumatoid arthritis.


Conflict of interest statement

The authors declare that they have no known competing financial interests.

Sponsorships or competing interests that may be relevant to content are disclosed at the end of this article.

Figures

Figure 1.
Figure 1.
Temporal progression of spinal glial and CD4+ T lymphocyte expression in rats experiencing chronic pain because of collagen-induced arthritis (CIA). Immunofluorescence staining of IBA1 (a marker for microglia) (A), GFAP (an indicator of astrocytes) (C), or CD4+ cells (T lymphocytes) (E) in the dorsal horn of the spinal cord at different days post-CIA induction. Quantification of the relative fluorescence intensity of IBA-1 (B), GFAP (D), CD4+ cells (F) over various days. (G) CD4+ T cells flow cytometry in the SDH of rats. Statistical significance is indicated as follows: *P < 0.05 and **P < 0.01 when compared to day 1, as determined by repeated-measures 1-way ANOVA with a subsequent Tukey multiple comparisons test. All scale bars represent either 50 µm or 100 µm, as specified. The dotted white lines outline the edge of the section. The second column provides a higher magnification view of the area highlighted by the white box in the first column images. Data are presented as means ± SEM, with each group consisting of 3 to 5 rats. The experimenters conducting the study were blinded to the treatment conditions. This blinding protocol was consistently applied throughout the study. ANOVA, analysis of variance; SDH, spinal dorsal horn.
Figure 2.
Figure 2.
The intrathecal injection of CD4+ T cells in naïve mice triggers the activation of microglia and astrocytes, as well as induces pain behavior. Immunofluorescence staining of CD4+ cells (A), IBA-1 (B), and GFAP (C) in the dorsal horn of the spinal cord across various groups. Quantification of the number of CD4+ T cells per mm2 is shown below each panel. The measurement of the mechanical pain threshold (D) and thermal withdrawal latency (E) after intrathecal injection of CD4+ cells. Statistical significance is denoted as *P < 0.05 and **P < 0.01 when compared to the naïve group, as determined by repeated-measures 1-way ANOVA or 2-way ANOVA, followed by a Dunnett multiple comparisons test. All scale bars represent 50 µm. Data are presented as means ± SEM, with each group consisting of 5 mice. ANOVA, analysis of variance.
Figure 3.
Figure 3.
The depletion of intrathecal CD4+ T cells mitigates the overactivation of microglia, astrocytes, and pain behavior in mice with collagen-induced arthritis (CIA). Immunofluorescence staining of CD4 (A), IBA-1 (B), or GFAP (C) in the dorsal horn of the spinal cord across 3 groups with quantification of the number of CD4+ T cells per mm2 shown below each panel, after the intrathecal injection of a neutralizing antibody against CD4+ T cells. (D and E) The measurement of the mechanical pain threshold (D) and thermal withdrawal latency (E) in CIA mice after antibody injection. Statistical significance is denoted as *P < 0.05 and **P < 0.01 when compared to the naïve group, and #P < 0.05 and ##P < 0.01 when compared to the CIA + Vehicle group, as determined by repeated-measures 1-way ANOVA or 2-way ANOVA, followed by a Dunnett multiple comparisons test. All scale bars represent 50 µm. Data are presented as means ± SEM, with each group consisting of 5 mice. ANOVA, analysis of variance.
Figure 4.
Figure 4.
(S)-LCM mitigates the infiltration of CD4+ T cells and the activation of glial cells in the Substantia Gelatinosa (SDH) of Collagen-Induced Arthritis (CIA) model mice, thereby alleviating chronic pain. (A, C, E) Examination of the dorsal horn of the spinal cord across various groups using immunofluorescence and quantification of CD4+ (A), IBA-1 (C), or GFAP (E) expression. (B, D, F) Representative immunoblots and quantification of CD4+ (B), IBA-1 (D), or GFAP (F) expression in the dorsal horn of the spinal cord across the indicated groups. Statistical significance is denoted as *P < 0.05 and **P < 0.01 compared to the naïve group, and #P < 0.05 compared to the CIA + Vehicle group, as determined by repeated-measures 1-way ANOVA followed by Dunnett multiple comparisons test. All scale bars represent 50 µm. Data are presented as means ± SEM, with each group consisting of 5 mice. ANOVA, analysis of variance; SDH, spinal dorsal horn; (S)-LCM, (S)-Lacosamide.
Figure 5.
Figure 5.
Naringenin reduces the spinal infiltration of CD4+ T lymphocytes in rats with collagen-induced arthritis (CIA). (A) Representative immunofluorescence micrographs of CD4 expression in the dorsal horn of the spinal cord on days 28 and 42 postprimary immunization. (B and C) Quantification of CD4 expression on day 28 (B) and day 42 (C). (D and E) Representative western blots illustrating CD4 expression in the dorsal horn of the spinal cord in CIA (D) and NAR (E) groups on days 28 and 42 postprimary immunization. Statistical significance is denoted as *P < 0.05 and **P < 0.01 compared to the naïve group, and #P < 0.05 and ##P < 0.01 compared to the CIA model group, as determined by repeated-measures 1-way ANOVA followed by Dunnett multiple comparisons test. All scale bars represent 50 µm. Data are presented as means ± SEM, with each group consisting of 5 rats. ANOVA, analysis of variance; NAR, naringenin.
Figure 6.
Figure 6.
CD4+ cell–specific CRMP2 deficiency alleviates spinal infiltration of CD4+ cells, central microglia activation, and arthritic pain. (A and B) CD4-cre and CRMP2fl/fl mice were crossed, and CRMP2 expression was verified by western blot. (C and E) von Frey mechanical thresholds and paw swelling indicated that the loss of CRMP2 in CD4+ T cells prevented the development of arthritic pain after CIA induction in both male and female CD4-cre CRMP2fl/fl mice. (D) No differences in thermal pain latency were observed between genotypes in both males and females. (F) Immunofluorescence staining of IBA-1 (left panel) and CD4 (right panel) in the spinal cord dorsal horn of male CD4-cre CRMP2fl/fl mice after CIA induction. *P < 0.05, ***P < 0.001 vs WT female group, ##P < 0.01, ###P < 0.001 vs WT male group, by repeated-measures 1-way ANOVA followed by post hoc Dunnett multiple comparisons test. Scale bars are 50 and 100 µm as indicated. Data are presented as means ± SEM (n = 5 mice per group). ANOVA, analysis of variance; CIA, collagen-induced arthritis; CRMP, collapsin response mediator protein; WT, wild-type.
Figure 7.
Figure 7.
CRMP2 conditional knockout alleviated CD4+ T lymphocyte migration and invasion through the endothelium in vitro. (A and B) Migration metrics via Transwell assays for both WT-CIA and cKO-CIA groups indicated a significant reduction in cell migration in the cKO-CIA group (***P < 0.001 vs WT-CIA). (C–F) Live cell tracking analysis revealed notable decreases in migration distances and velocities of cKO-CIA cells (***P < 0.001 vs WT-CIA). (G and H) Quantified by cell counts and fluorescence intensities, the cKO-CIA group showed significantly decreased infiltration (***P < 0.001 vs WT-CIA). (I) Confocal imaging captured layered scans of the Transwell endothelium, showing diminished endothelial invasion by CD4+ T cells in the cKO-CIA group with sagittal views (right plane). CIA, collagen-induced arthritis; cKO, conditional knockout; CRMP, collapsin response mediator protein; WT, wild-type.
Figure 8.
Figure 8.
The genetic and pharmacological disruption of CRMP2 S522 phosphorylation reduces the migration of CD4+ T cells in vitro. (A) Schematic of the Transwell assay showing the addition of CD4+ T cells into the inner chamber of a standard Transwell, stimulated by CXCL12. (B) Relative Transwell migration of CD4+ T cells from untreated cells, or those transfected with scramble siRNA or CRMP2 siRNA. (C) Relative Transwell migration of CD4+ T cells from untreated cells, or those treated with (S)-LCM and naringenin. A significant difference compared to the untreated group is indicated by *P < 0.05. (D) Relative Transwell migration of CD4+ T cells from untreated cells, or those transfected with wild-type (WT) or CRMP2 S522A. Statistical significance is denoted as *P < 0.05 compared to the untreated group, determined by repeated-measures 1-way ANOVA followed by Dunnett multiple comparisons test. Data are presented as means ± SEM, with each group consisting of 5 samples. ANOVA, analysis of variance; CRMP, collapsin response mediator protein; (S)-LCM, (S)-Lacosamide.
Figure 9.
Figure 9.
NAR and (S)-LCM Decrease Migration and Endothelial Invasion of CD4+ T Lymphocytes. (A-F) Quantitative live cell tracking of motility reveals significant reductions in migration distance and velocities of CD4+ T lymphocytes treated with NAR and (S)-LCM both in vitro (A-C) and in vivo (D-F) (***P < 0.001 vs Naïve group, ###P < 0.001 vs CIA or CXCL12 group). (G-I) The number and immunofluorescent intensity of CD4+ T lymphocytes attaching to the Transwell endothelial layer significantly decreased with NAR and (S)-LCM application (***P < 0.001 vs Naïve group, ###P < 0.001 vs CIA). (J-L) Assessment of endothelial invasion of CD4+ T cells shows that NAR and (S)-LCM treatments reduced the invasive potential of CD4+ T cells (***P < 0.001 vs Naïve group; ###P < 0.001 vs CIA group, 1-way ANOVA followed by post hoc Dunnett multiple comparisons test). All scale bars are 50 µm. Data are presented as means ± SEM. ANOVA, analysis of variance; CIA, collagen-induced arthritis; NAR, naringenin; (S)-LCM, (S)-Lacosamide.
Figure 10.
Figure 10.
Polarized CD4+ T Lymphocytes in CIA Groups. (A and C) Relative images and counts of polarized CD4+ T cells show a significant decrease in polarization in the cKO-CIA group (***P < 0.001 vs WT-CIA, by student t-test). (B and E) Visual narrative of cell morphology through time-lapse imaging and tracking; distinct cellular structures such as lamellipodia and uropodia are annotated with white and red arrows, with detailed cell contours presented on the right. (D and F) Relative images and counts of polarized CD4+ T cells from 4 groups highlight the effectiveness of NAR and (S)-LCM treatments in reducing polarization (***P < 0.001 vs Naïve group, ###P < 0.001 vs CIA group, 1-way ANOVA followed by post hoc Dunnett multiple comparisons test). Data are presented as means ± SEM (n = 5 per group). ANOVA, analysis of variance; CIA, collagen-induced arthritis; cKO, conditional knockout; NAR, naringenin; (S)-LCM, (S)-Lacosamide; WT, wild-type.
Figure 11.
Figure 11.
F-actin and Tubulin Dynamics in CD4+ T-Cell Polarization. (A and B) Immunofluorescence analysis shows the expression and interaction of F-actin and Tubulin in control, CXCL12-treated, NAR-treated, and (S)-LCM-treated groups. Colocalization is indicated by dotted lines, with specific attention to the uropod, marked by white arrows. (C) Illustration of the cellular polarization process induced by CXCL12, highlighting structural changes. (D–F) Western blot quantification of RhoA and phosphorylated MLC S19 shows a decrease in expression with NAR and (S)-LCM treatment (*P < 0.05 vs Naïve; ***P < 0.001 vs Naïve; #P < 0.05 vs CXCL12). (G and H) Post-AAV (CRMP2 S522A) transduction, the expression patterns and spatial relationship of F-actin and Tubulin are further analyzed, indicating cytoskeletal rearrangements and polarization of CD4+ T cells alleviated by CRMP2 dephosphorylation. CRMP, collapsin response mediator protein; pMLC S19, phosphorylated (Ser19) Myosin Light Chain; NAR, naringenin; (S)-LCM, (S)-Lacosamide.

References

    1. Appel SH, Beers DR, Henkel JS. T cell-microglial dialogue in Parkinson's disease and amyotrophic lateral sclerosis: are we listening? Trends Immunol 2010;31:7–17. - PMC - PubMed
    1. Baig S, DiRenzo DD. Complementary and alternative medicine use in rheumatoid arthritis. Curr Rheumatol Rep 2020;22:61. - PubMed
    1. Bindu S, Mazumder S, Bandyopadhyay U. Non-steroidal anti-inflammatory drugs (NSAIDS) and organ damage: a current perspective. Biochem Pharmacol 2020;180:114147. - PMC - PubMed
    1. Bonin RP, Bories C, De Koninck Y. A simplified up-down method (SUDO) for measuring mechanical nociception in rodents using von frey filaments. Mol Pain 2014;10:26. - PMC - PubMed
    1. Brooks TA, Hawkins BT, Huber JD, Egleton RD, Davis TP. Chronic inflammatory pain leads to increased blood-brain barrier permeability and tight junction protein alterations. Am J Physiol Heart Circ Physiol 2005;289:H738–43. - PMC - PubMed

MeSH terms

Substances